How to create custom WooCommerce customer dashboard
The WooCommerce customer dashboard is a dedicated section or interface within the WooCommerce platform designed to provide a comprehensive view and control over customer-related data and interactions. This dashboard for WooCommerce typically offers a consolidated display of customer information, such as order history, customer account details, customer location data, and any other relevant data associated with individual customers. It’s a centralized hub for website owners to efficiently track, manage, and engage with their customers, enabling streamlined customer management and fostering better user experiences within the WooCommerce ecosystem.
In this article, we’ll show you how to create a custom WooCommerce customer dashboard and create custom reports with a dedicated WooCommerce customer area. With a customer dashboard and data insights you can get from it, you can make data-driven decisions and improve your decision-making process.
One of the most significant assets of tech-based companies is their data. That’s because data can help us understand our business and customers. Collecting and processing the right data points is the difference between making amazingly good or bad and uninformed decisions.
If you are using WooCommerce, a lot of data is being collected already. In this article, we’ll understand how to go from raw data in your WooCommerce database to creating your own WooCommerce customer dashboard.
The benefits of data visualization and data-driven decisions
Before we dive into the details, some definitions are needed. Data visualization is the study and method used to organize and present your data. There are many ways to visualize and present your data, such as charts, tables, infographics, and databases.
Data visualization and data-driven decisions in WooCommerce customer management offer significant advantages. By employing visual representations of customer data within the dashboard for WooCommerce, website owners can efficiently comprehend and analyze customer behavior patterns, purchase history, and engagement metrics. This aids in identifying trends and preferences. Utilizing these insights, one can tailor and customize the layout, add custom features, and optimize the customer experience. Making data-driven decisions based on these visualizations allows for strategic adjustments in marketing strategies, product offerings, and service improvements, ultimately leading to more targeted and effective customer engagement and management within the WooCommerce platform.
When used correctly, data visualization can help you digest a lot of information very quickly.
Because of these data tools, you can use your data as a thermometer of your business activities and results. Your customer account dashboard can be used as a way to evaluate performance. For instance, if a state brings more product sales than others, we can determine why. It could mean just that this particular state has more traffic (this can be easily verifiable by tools like Google Analytics). Still, it could be because of other reasons like higher conversion rates or better product market fit.
Therefore, you can use your WooCommerce dashboard to understand your data and its subsets better. You can also use it to track down performance. Going further, you can use these performance metrics to find trends, and customize the WooCommerce customer experience by redesigning the website, customize user dashboard or customize the my account page etc.
What data should I track on my WooCommerce Customer Dashboard?
Let’s define what good data visualization means for your WooCommerce user Dashboard. According to the Information is Beautiful team, there are four elements that, when combined, tell us what we need to know:
- Information – Our data points include a sale, customer address, sale price, and products.
- Story – What concept do we have in this report? Why is this important? Why should we even build this? What kind of issues lead to the need to make this?
- Goal – What are we trying to achieve? Understand sales? Please get to know our customers. Understand sales from the product X in 2018?
- Visual Form – The representation we choose, be it a report, table, charts
Regarding data storage, most of the work is already done by the WooCommerce team. You can bring more data if you want to spice up your WooCommerce customer dashboard. For example, as a dashboard plugin, Users Insights can collect your user location via the GeoLocation API or user tracking activity data.
You can collect more data using custom fields and tools such as Gravity Forms or ACF. Additionally, when collecting your data, keep in mind its granularity. The granularity is how big or small your data point is. For example, if you collect your customers’ birth dates, you can calculate their ages. But if you collect only their age, you can’t update this information later. The same rule applies to your sales data, product costs, stock information, etc.
Finally, it would be best to consider which metrics you want to create. We have many articles on different metrics you can use; here are some suggestions:
- Customer login activity
- Customer Wishlist products purchase
- WooCommerce membership reports
- Returning customers & repeat purchases
- Finding your revenue by country
- Customer Conversion rates
- Customer coupon usage
How to create a WooCommerce customer Dashboard
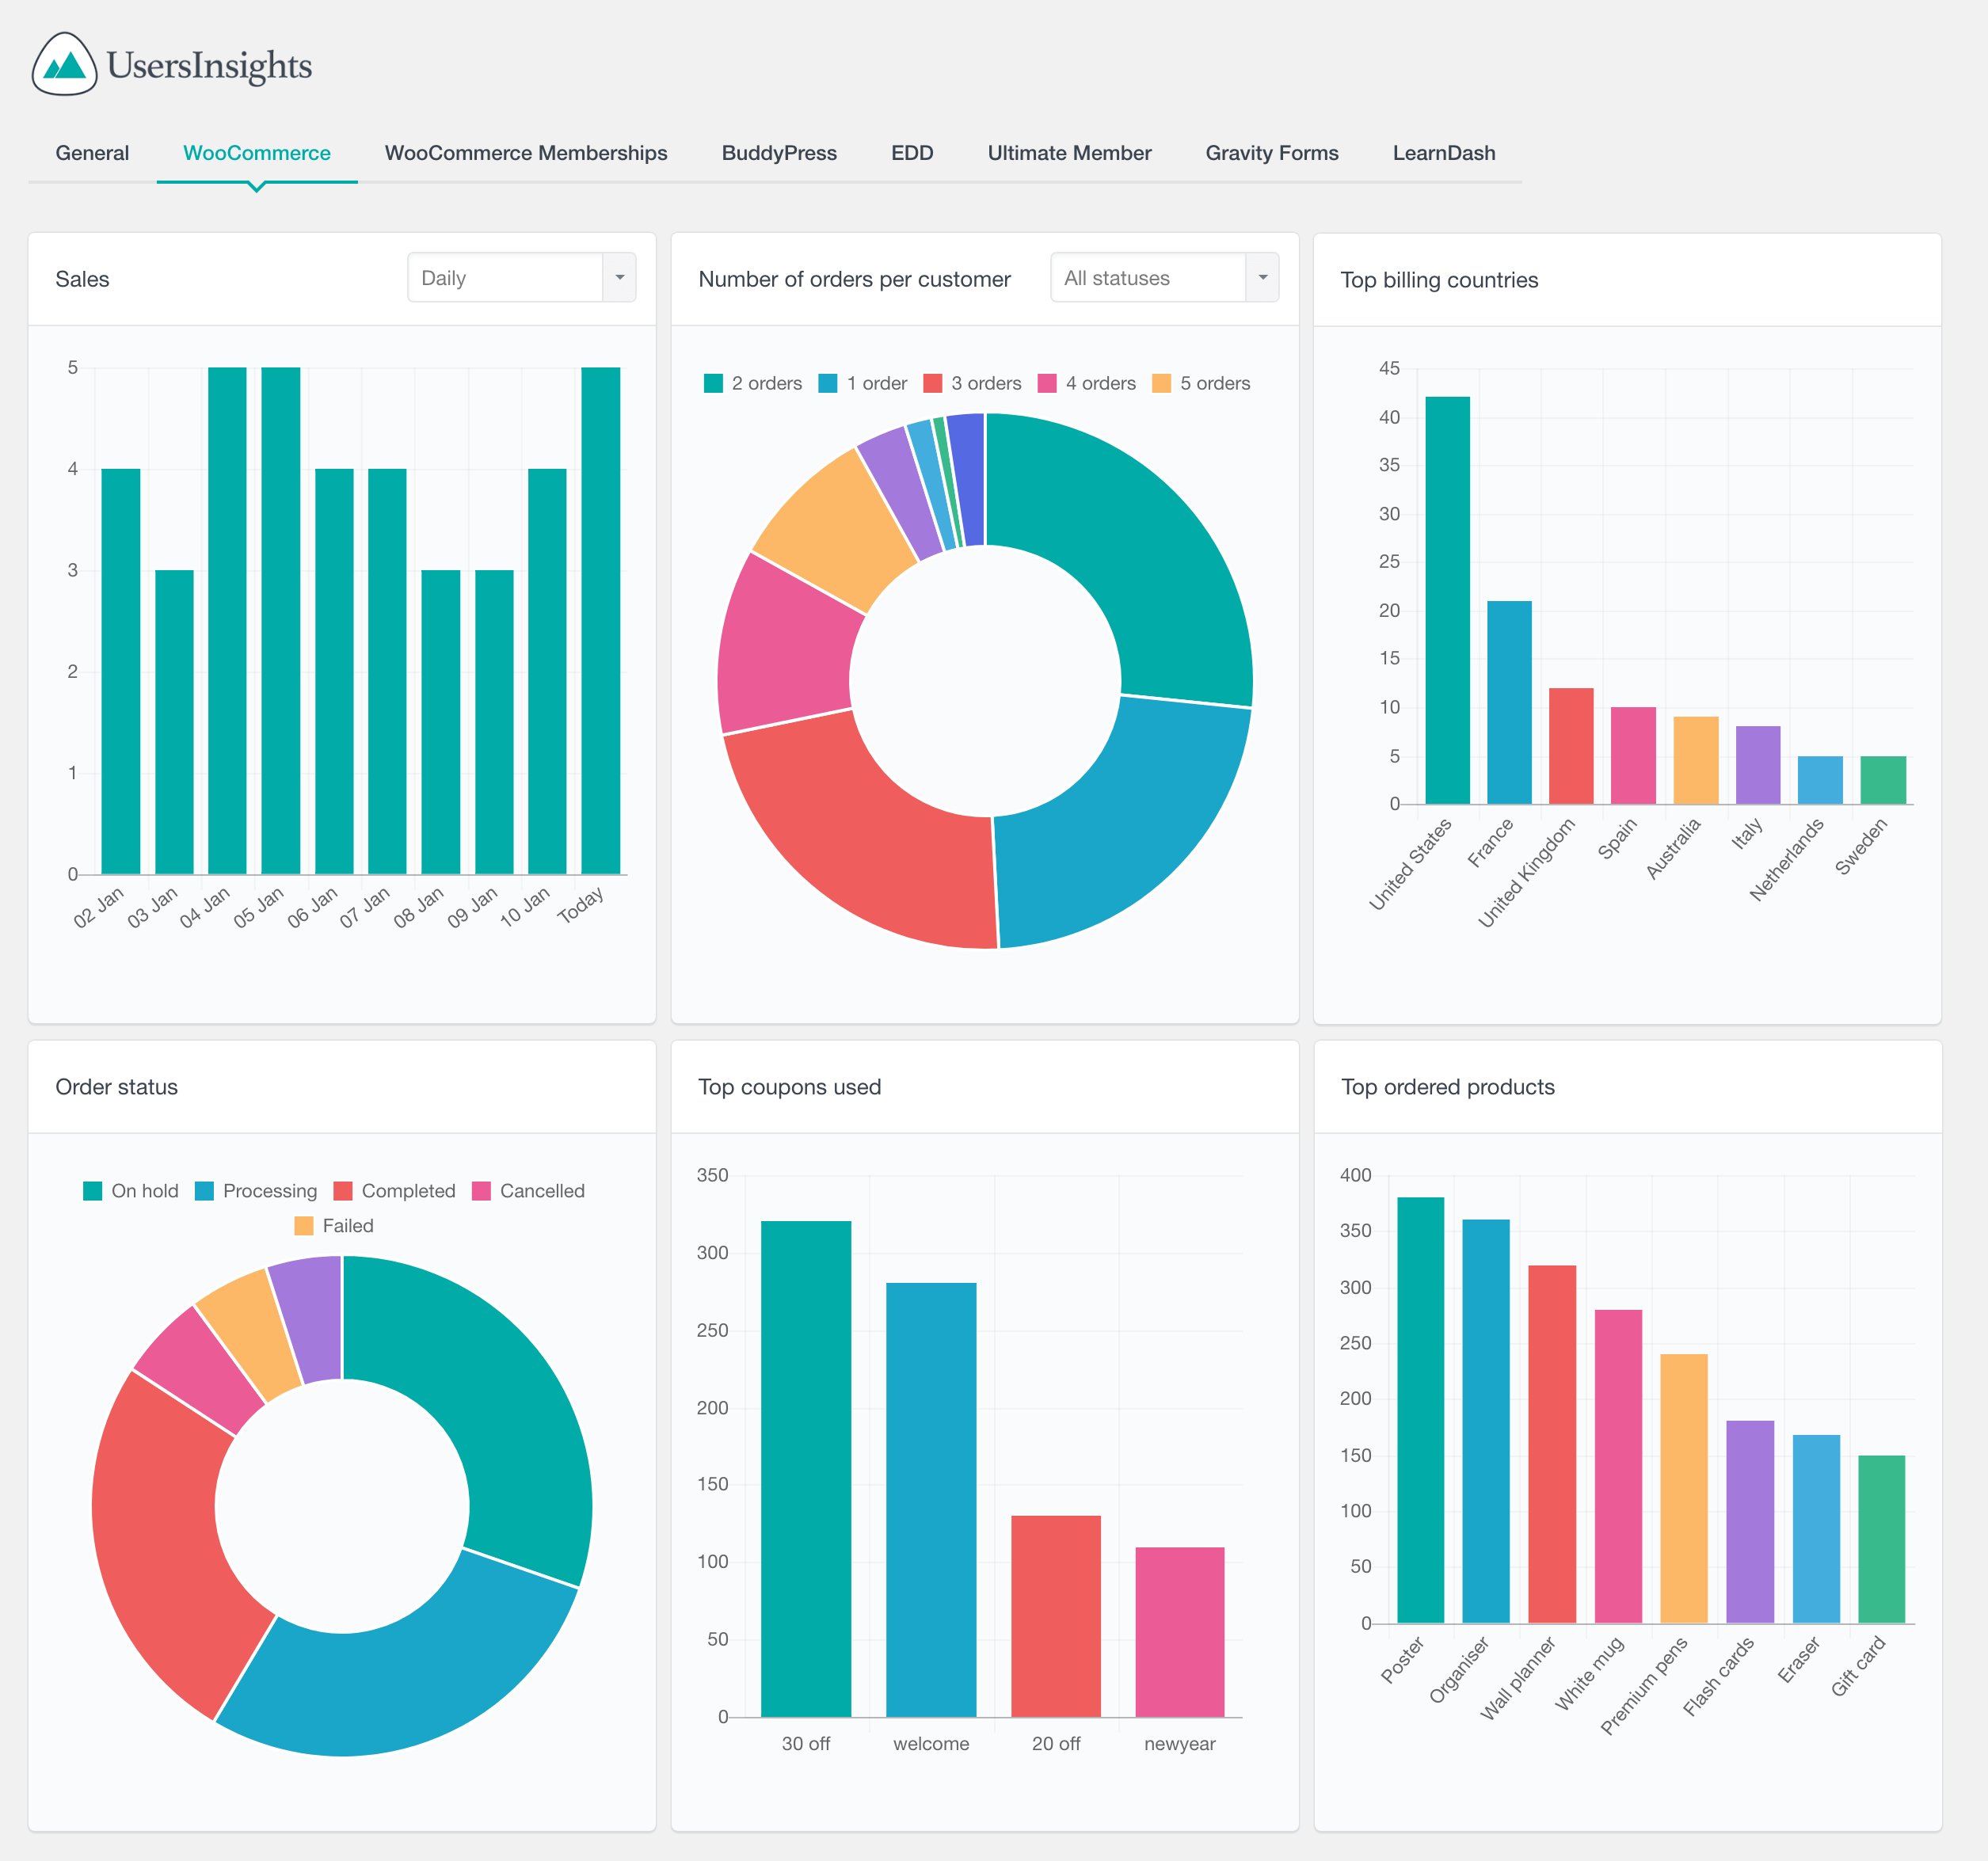
The Users Insights plugin has the Reports section. There, you have a WooCommerce customer dashboard ready to use with many exciting metrics. Let’s go through a few of the metrics you can find.
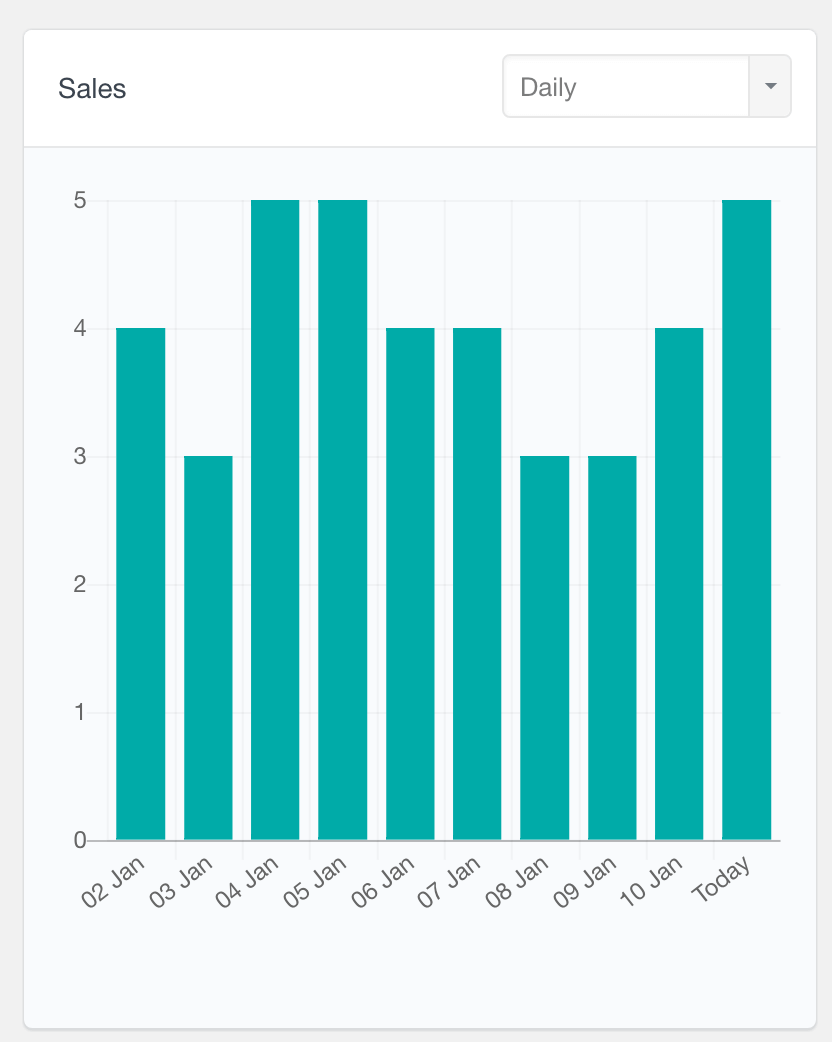
First, your sales report. Any WooCommerce customer dashboard should give you an idea of how much you sell. But beyond that, we need the flexibility of checking how sales stats progress over time. Therefore, on the sales dashboard widget, you can switch the sales report from daily, weekly, monthly, or even yearly reports.
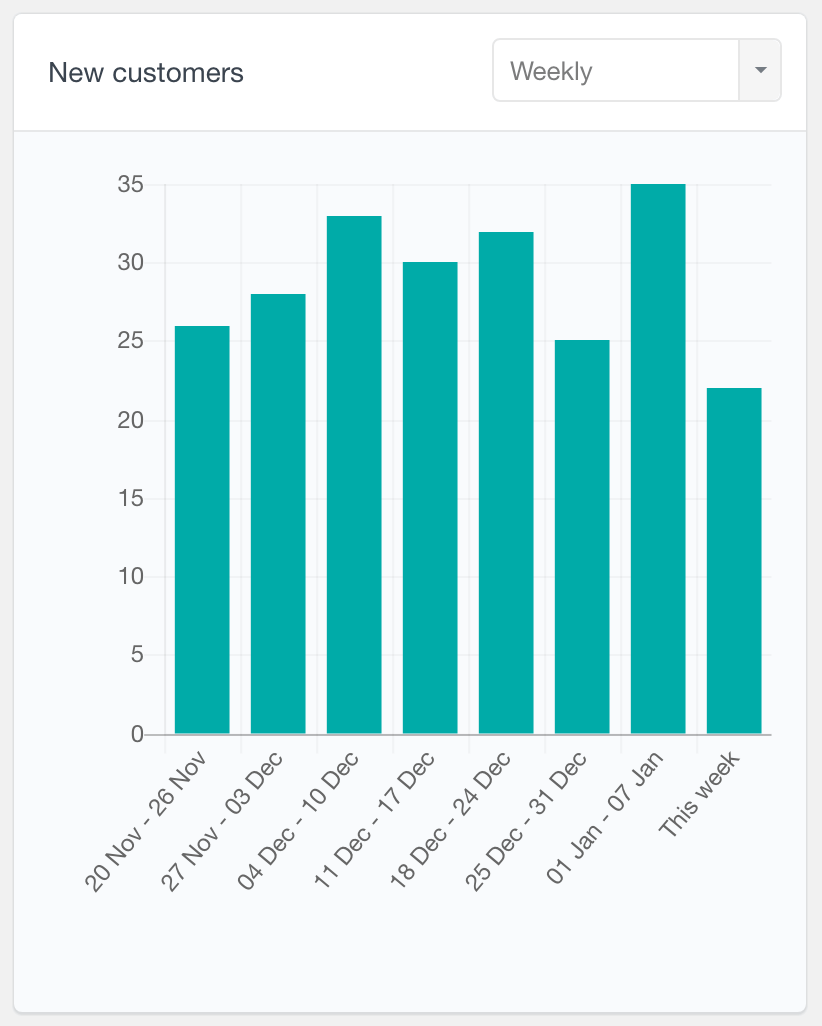
In your WooCommerce dashboard, you often need to see how many new WooCommerce customers you’ve got quickly. That’s when the new customer sections are going to be helpful. Since you are using a dashboard, you can quickly see how customer acquisition works and how it compares to other periods.
As we mentioned before, the repeat purchase ratio is a critical metric. That’s why it should be in your customer dashboard. With it, you can see how the repeat buyers are distributed in a pie chart.
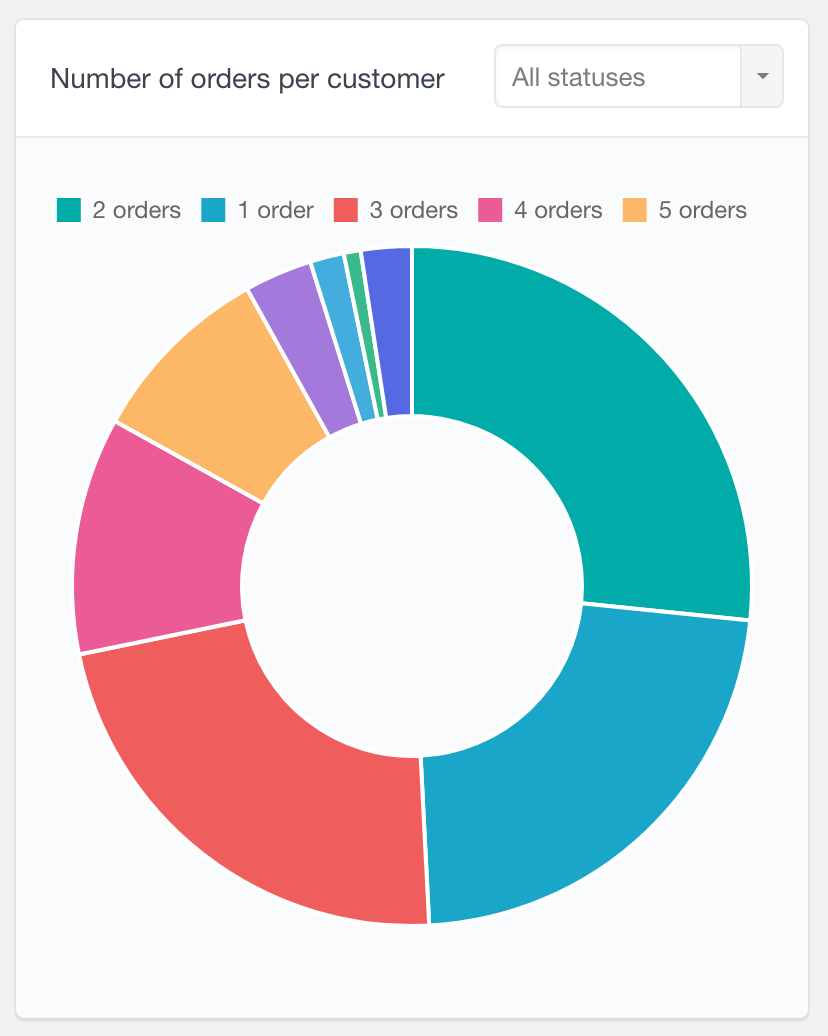
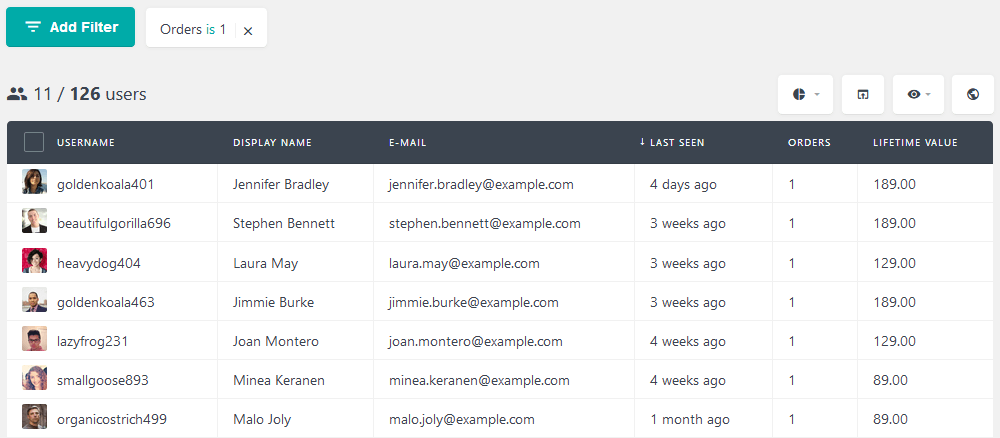
This may be useful if you consider strategies for loyal or new customers. For example, if you identify single purchase users in your “Number of orders per customer” dashboard widget, let’s track them and offer them discounts. On the other hand, if you have many loyal customers with many orders, let’s reward them. This can be done in another type of WooCommerce user dashboard, which is using the Users Insights filers:
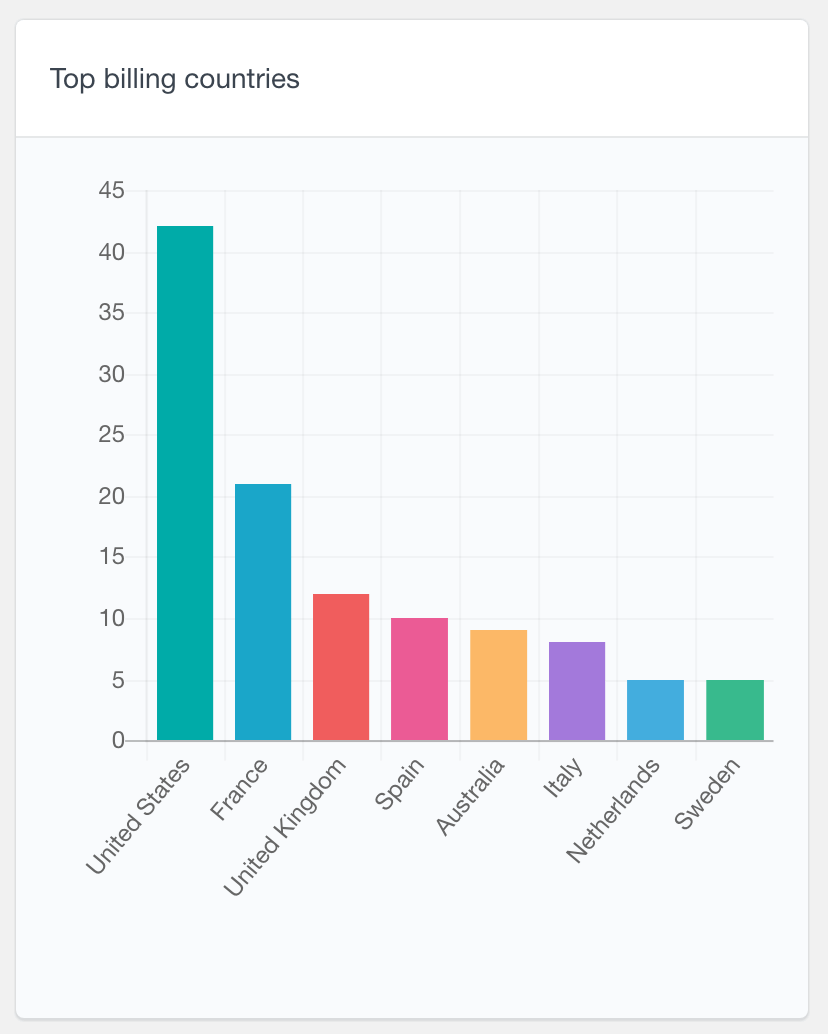
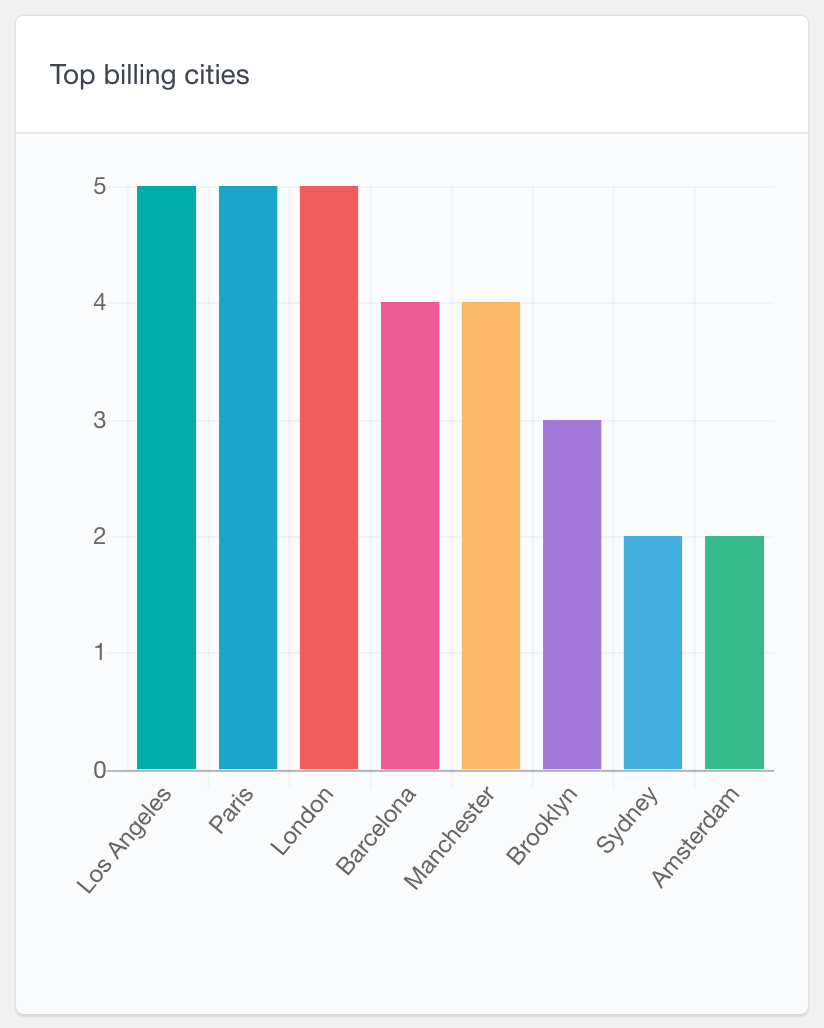
Glancing over your most common billing locations can also provide you with good insights. You can use the Users Insights top WooCommerce billing location report to identify popular countries and cities.
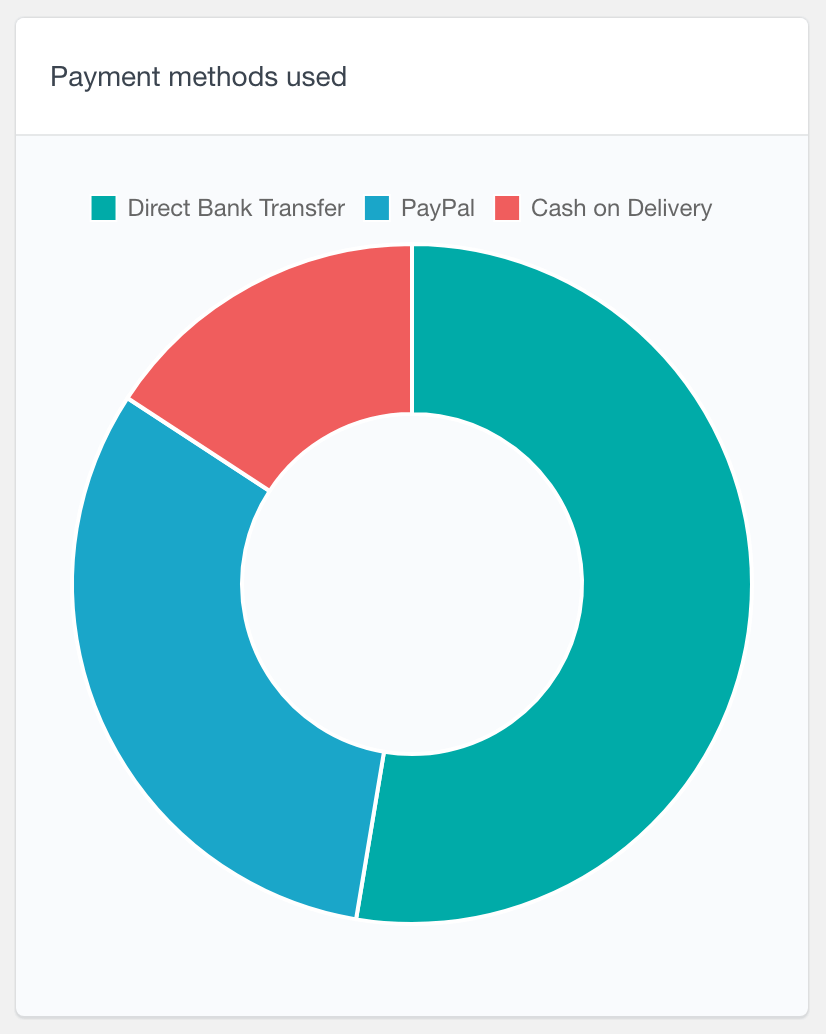
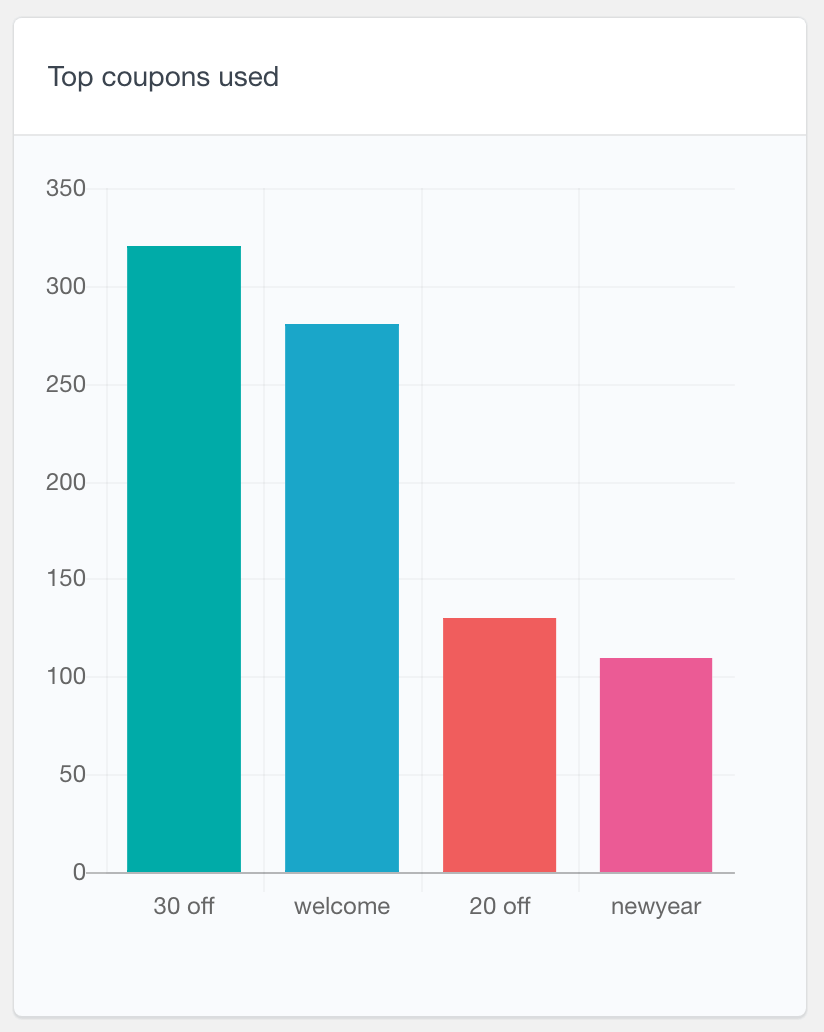
Your WooCommerce customer dashboard will be more complete once you look at the payment methods and coupon usage. This gives you an insight into how payment options and discounts can affect your conversions.
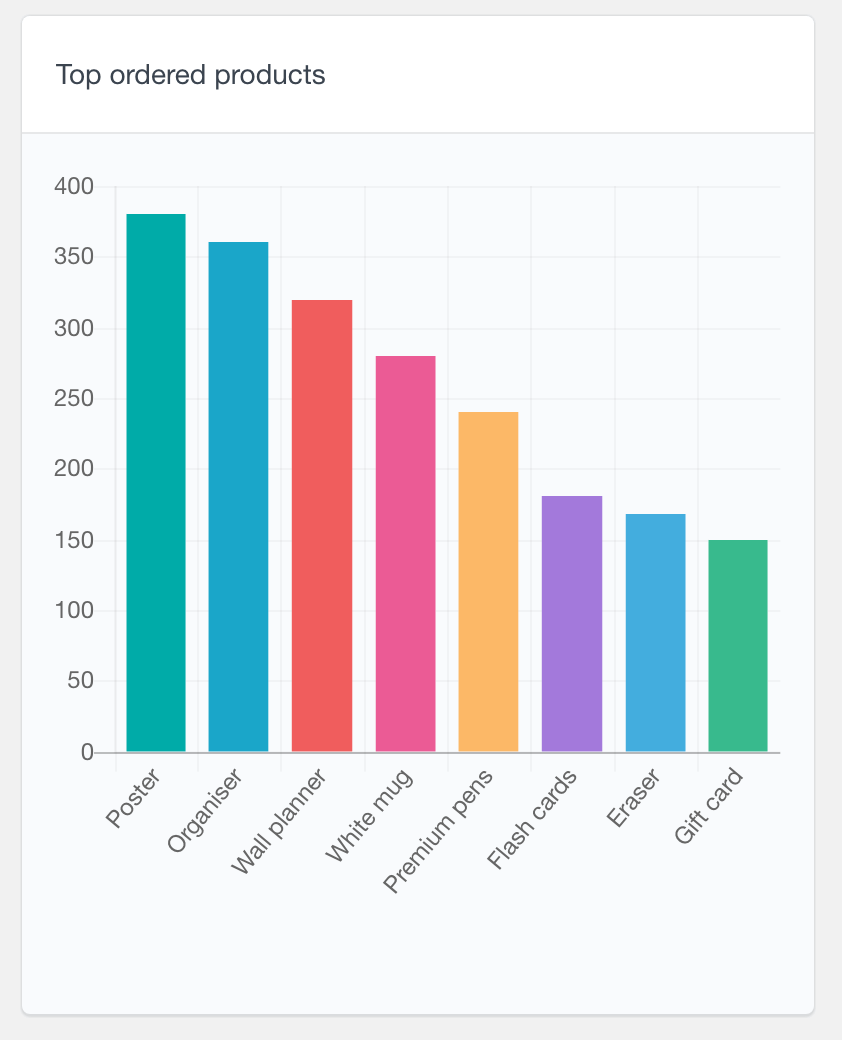
And the last highlight of our WooCommerce dashboard is the best sellers section. There, you can see which products are your top performers.
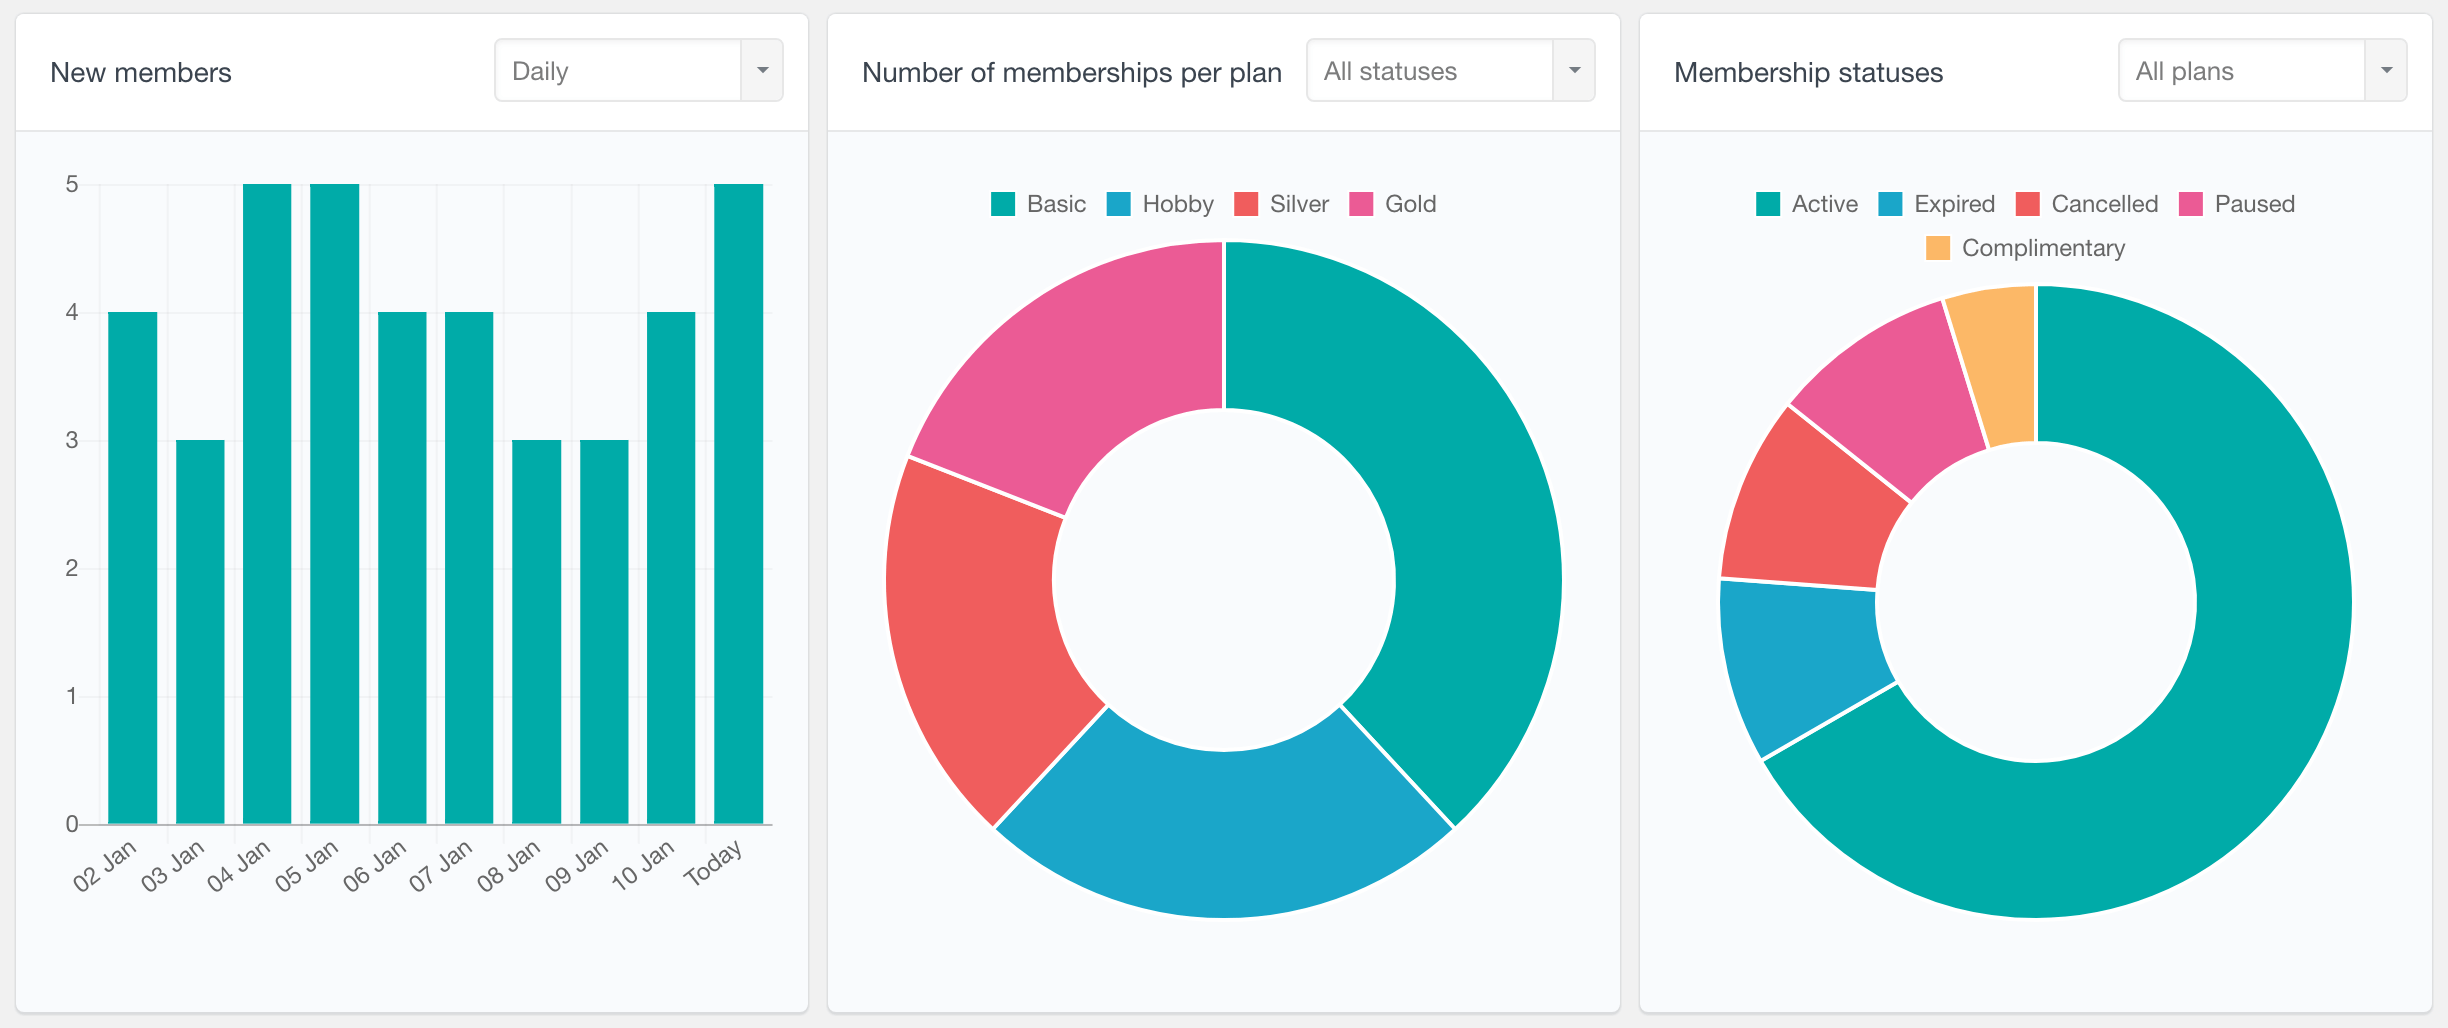
And this is only from the default WooCommerce plugin data. Users Insights also supports the WooCommerce subscriptions and WooCommerce membership extensions. Since a WooCommerce subscription is treated as a regular WooCommerce product, the Woocommerce subscription data is automatically detected and displayed in the default WooCommerce reports. However, for WooCommerce Memberships, a separate report dashboard can be accessed via its custom tab.
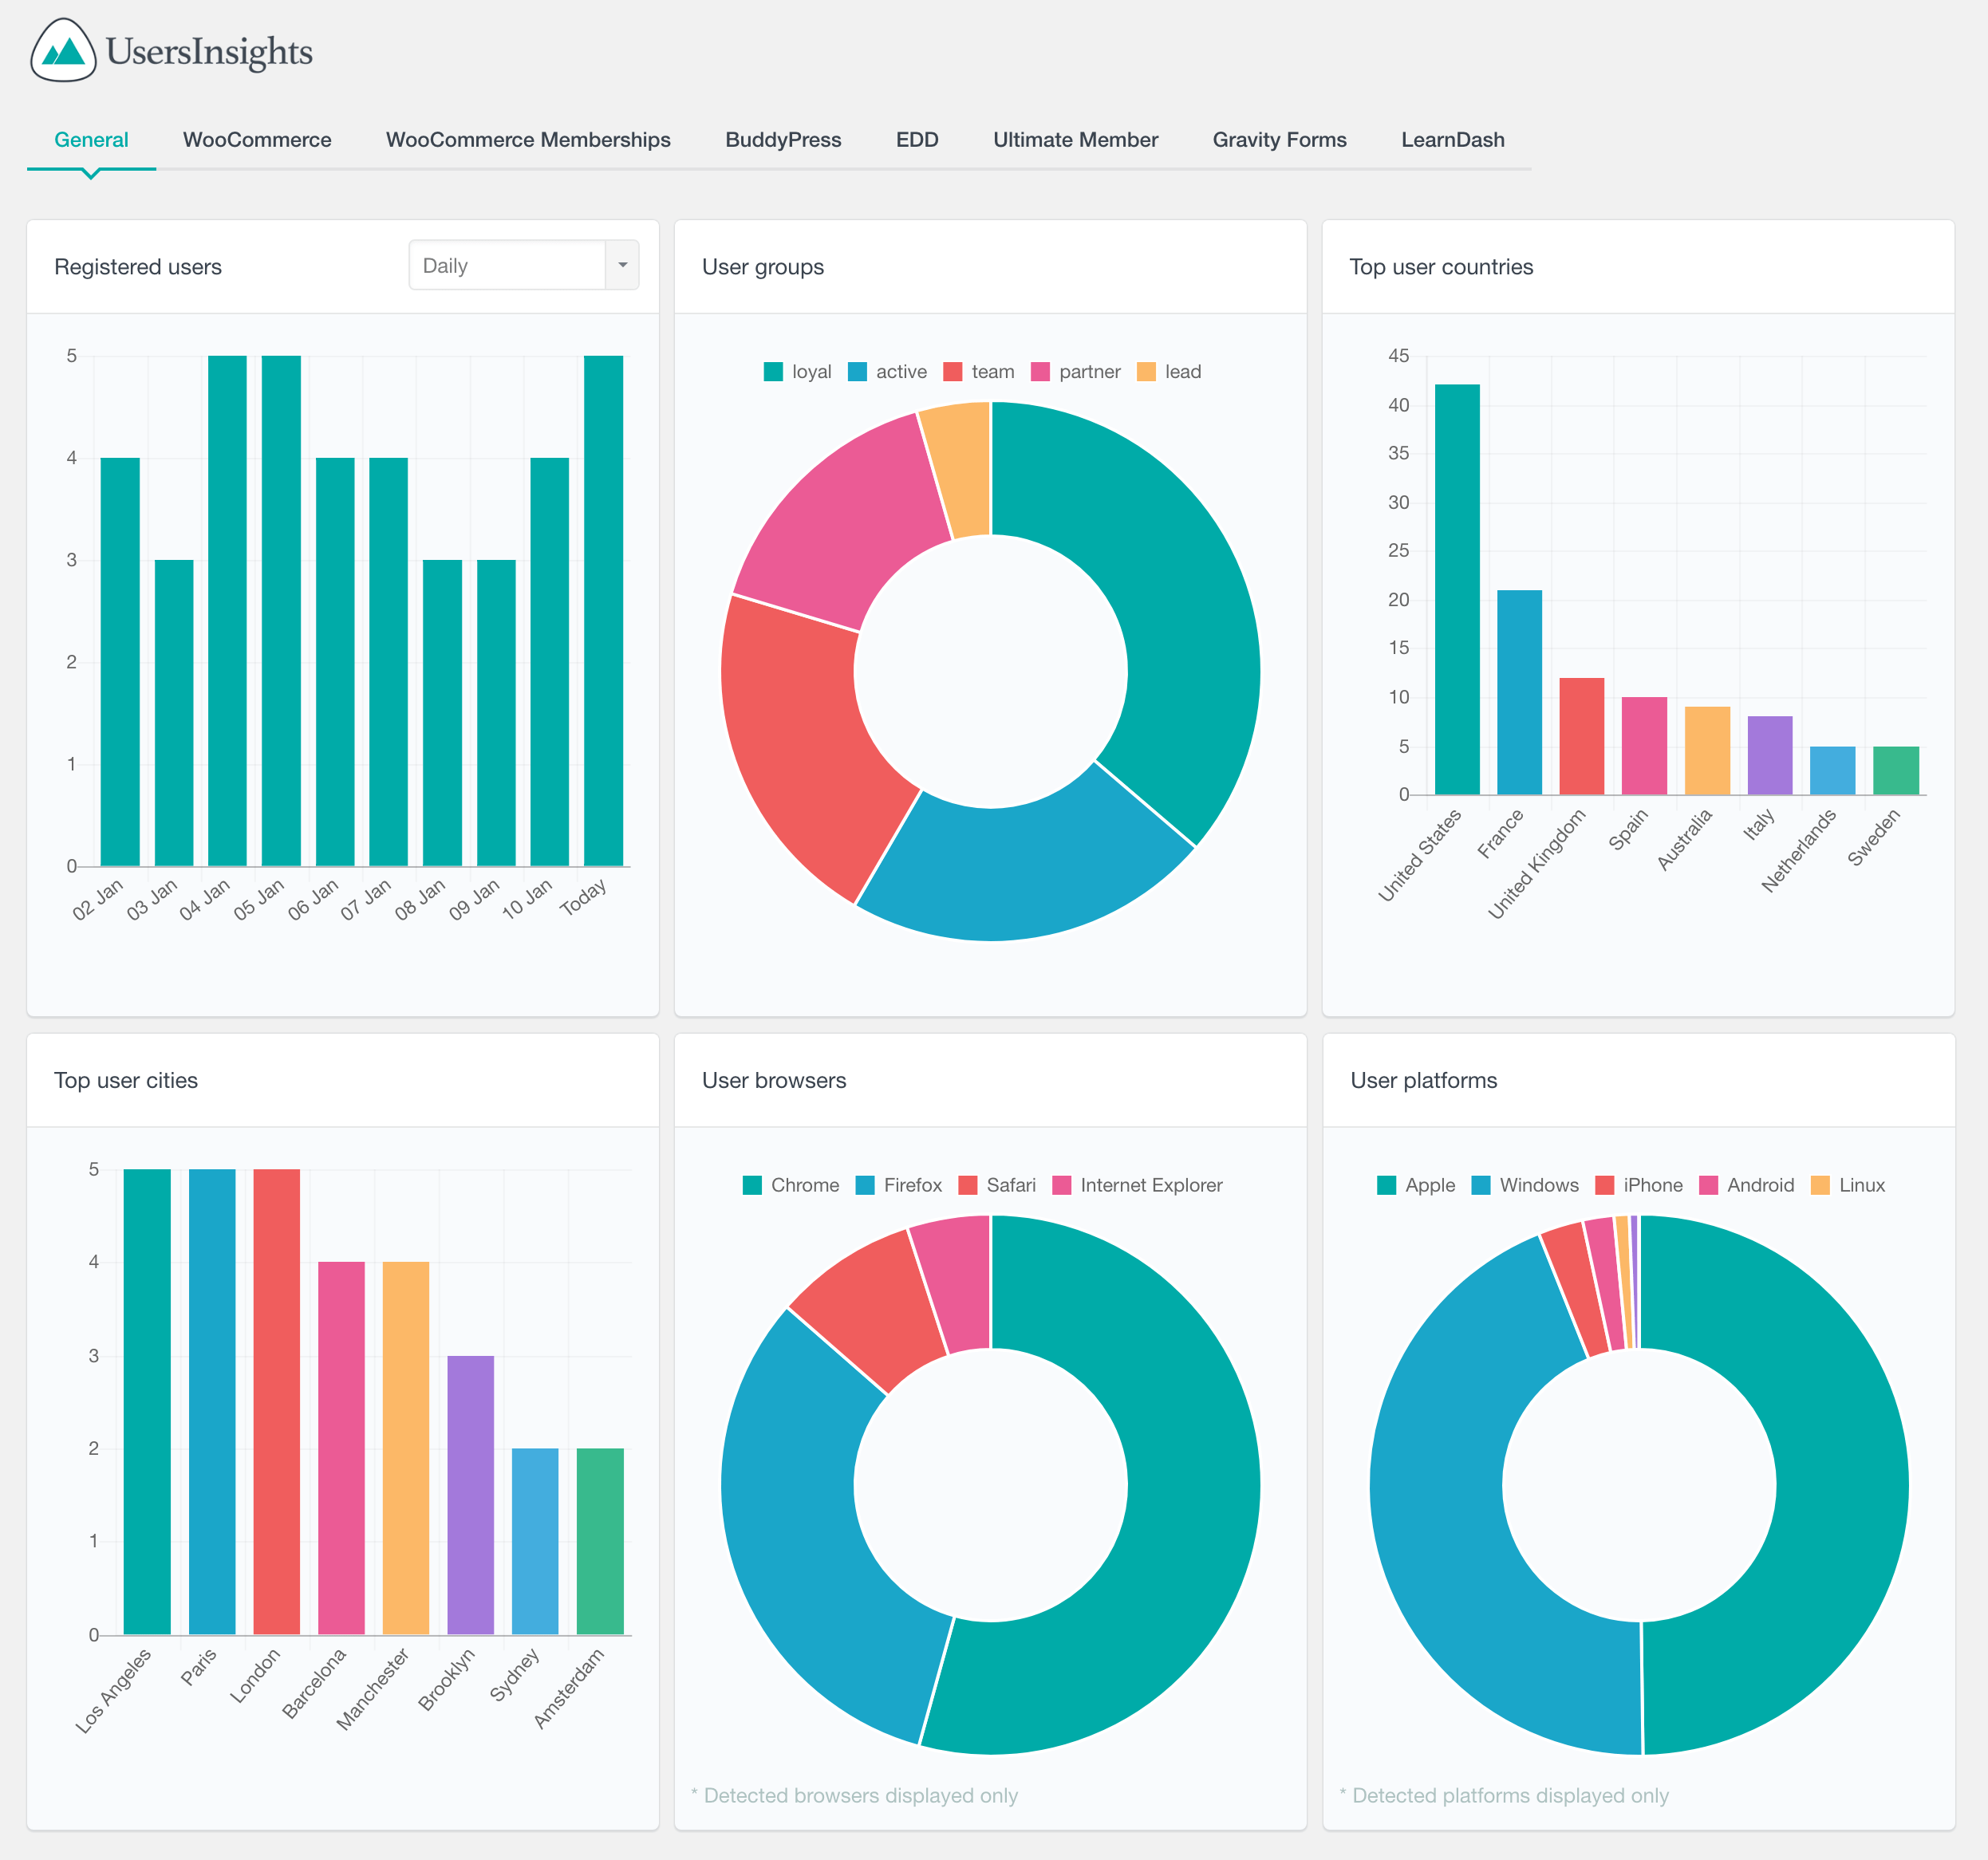
Of course, there is the general WordPress custom dashboard report that includes a lot of additional information about your WooCommerce store:
WooCommerce customer area
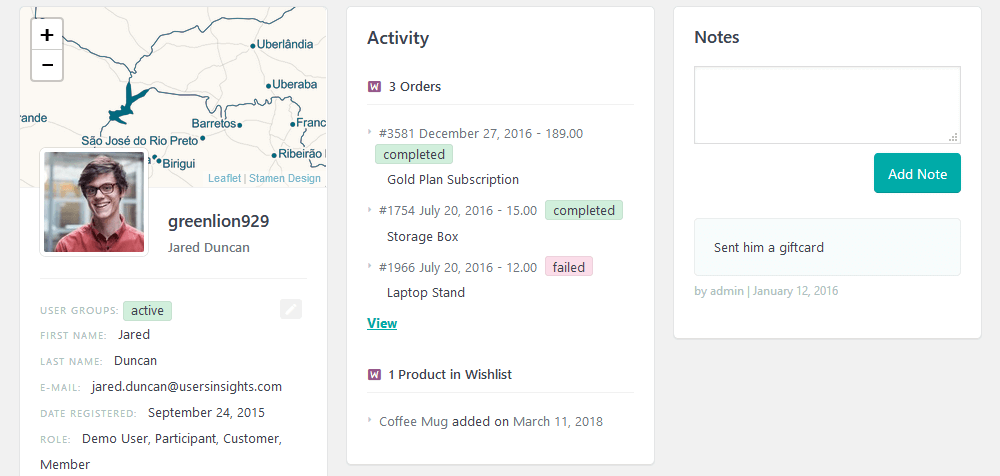
Additionally, there are other sections in the Users Insights WooCommerce reports that we haven’t mentioned, and that is the WooCommerce customer area or, as we call it, the WooCommerce customer profile or WooCommerce account page.
This section of your WooCommerce dashboard will have a page for each customer where shop owners and managers can review all the customer account details. Including order details data like orders they have placed, the list of items they purchased, and their payment details. But also a lot of other account details data like name, email, date of birth, customer location, user role, page visited, custom field data, items in cart, items in wishlist, product reviews made, and more. This provides a complete view of each WooCommerce user, and you can check their profile. You may see all their orders, Wishlist products, reviews, and any activity there.
Since this is a WordPress admin dashboard, it will be accessible only to the users with WordPress dashboard access who have logged in to their accounts. Once logged in, they can retrieve the data from the database for reports, analysis, and more!
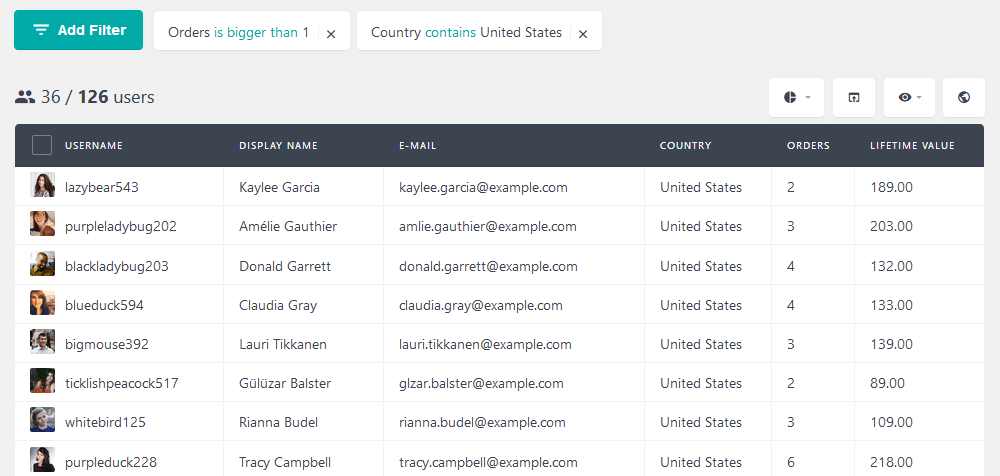
Finally, you can create your filters and segments using the Users Insights filters. This is for situations where you might want to drill down other reports from your user data and combine information from different reports. For instance, you may want to know the lifetime value of your repeat buyers from the US.
Conclusion
Today we investigated many aspects that go into building a good WooCommerce customer dashboard. We saw the basics of how a customer dashboard works, and how they can be useful. Additionally, we learned how to use Users Insights to build your own Customer Dashboard and find out more about your customer base.
We hope you enjoyed and see you again next time!