The Users Insights Reports are where all the WordPress user data comes together. The reports dashboards display a real-time summary of your user data. Taken as a whole, these WordPress reports are designed to help you make smarter decisions, monitor the progress of your goals and quickly identify problems.
Every single report provides a visual representation of the different category of your user data. The reports can be from different types depending on the nature of the information that is represented. Multiple reports are grouped into different tabs based on their type and data source. Most of the reports are grouped by the Users Insights module the data comes from:
The reports dashboard comes with 50+ different WordPress reports that provide an easy way to visualize, measure and analyze performance across all the different metrics and get a detailed picture of your business. Every WordPress user report transforms your specific user data into actionable insights that help you better understand your users and make better business decisions.
For example, all the reports from the WooCommerce data, like the number of sales or the number of orders per customer, are grouped under the WooCommerce tab. Additionally, you have the option to build our own custom WordPress report by choose which WordPress reports and WordPress analytics to be visible from each module. Some of the WordPress reports also have the option to filter the report data shown by different metrics. For example, on the registered users report you can choose to have it displayed by day, week, month or year.
One of the advantages of the Users Insights reporting plugin is that since it loads the data from the WordPress database, they also detect past data that was collected before installing the plugin. For all of the 3rd party modules, their past data will be available in the reports, regardless of when you have activated Users Insights. This is because Users Insights only reads the existing data from the WordPress database that is stored by those plugins and doesn’t require storing any additional data.
General WordPress User Reports
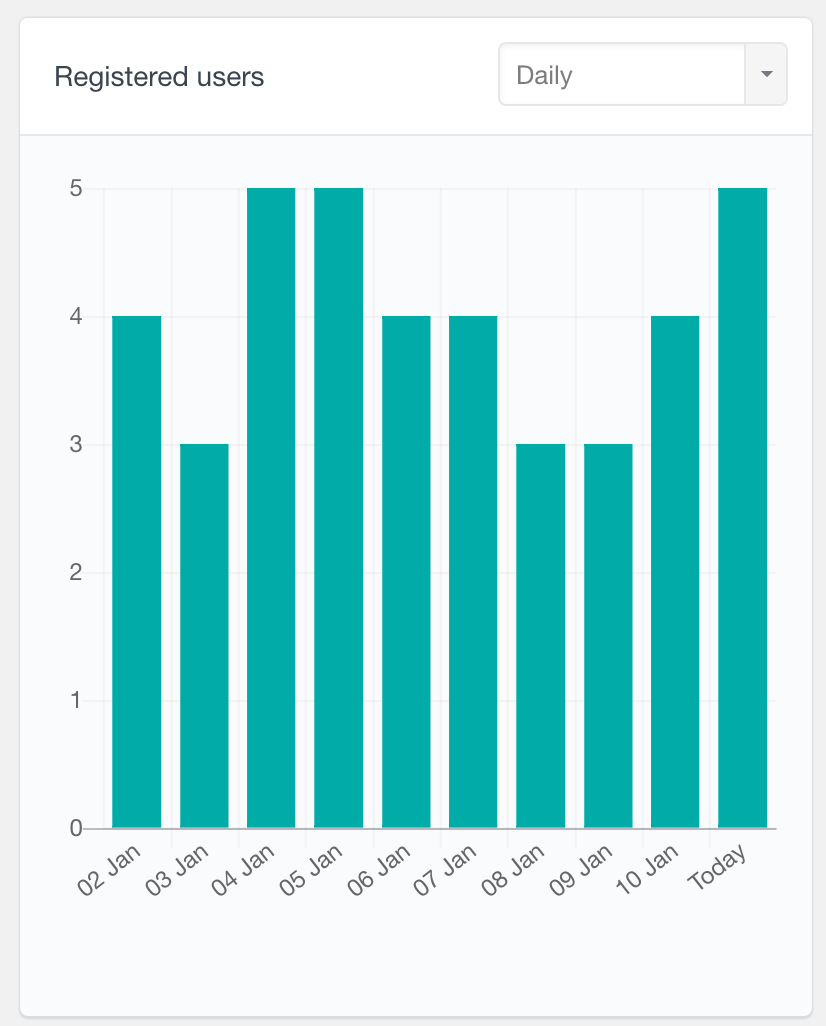
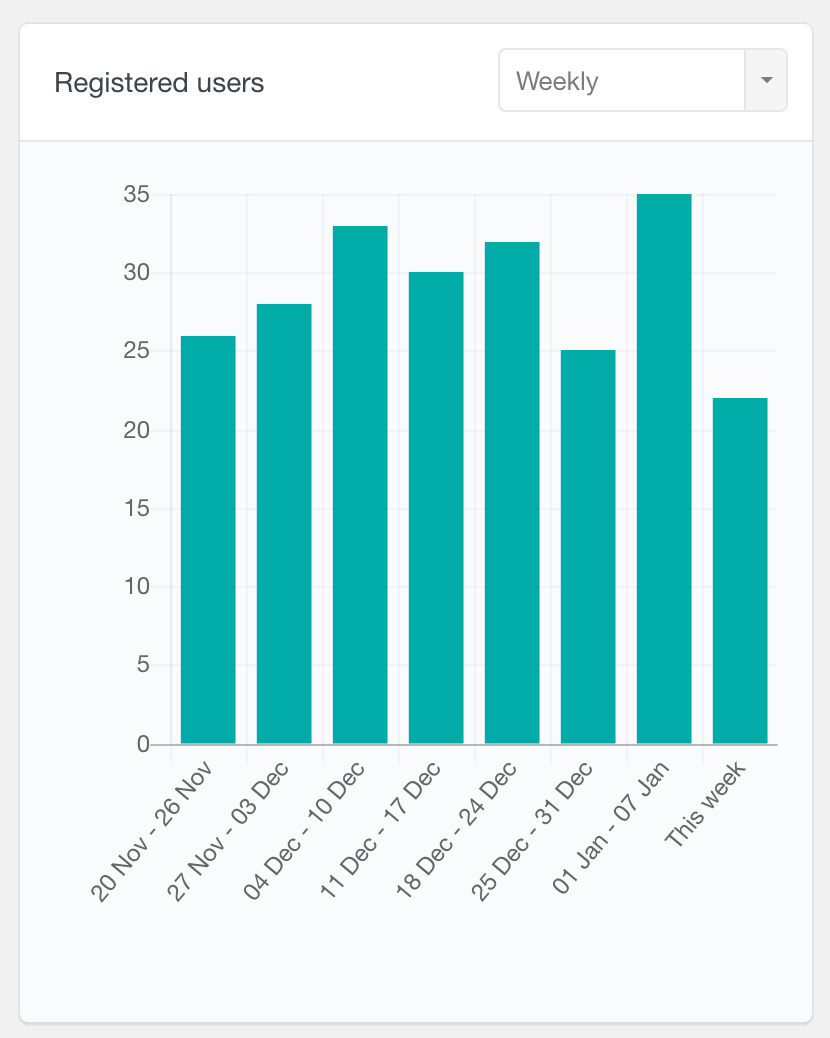
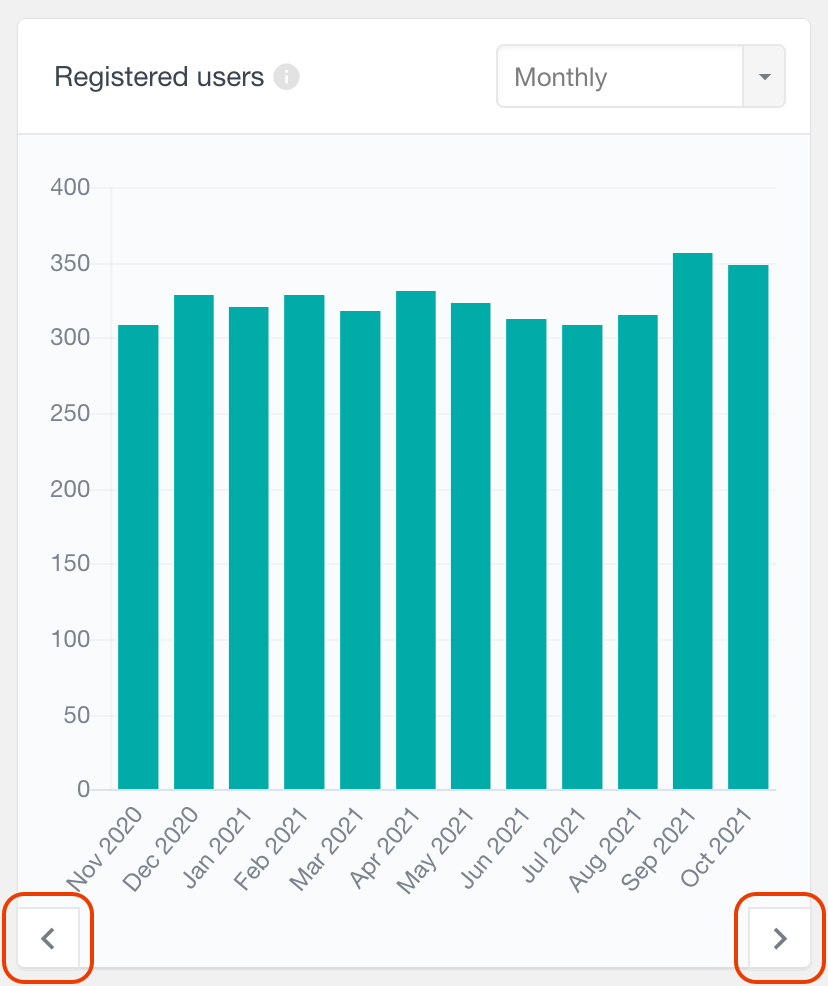
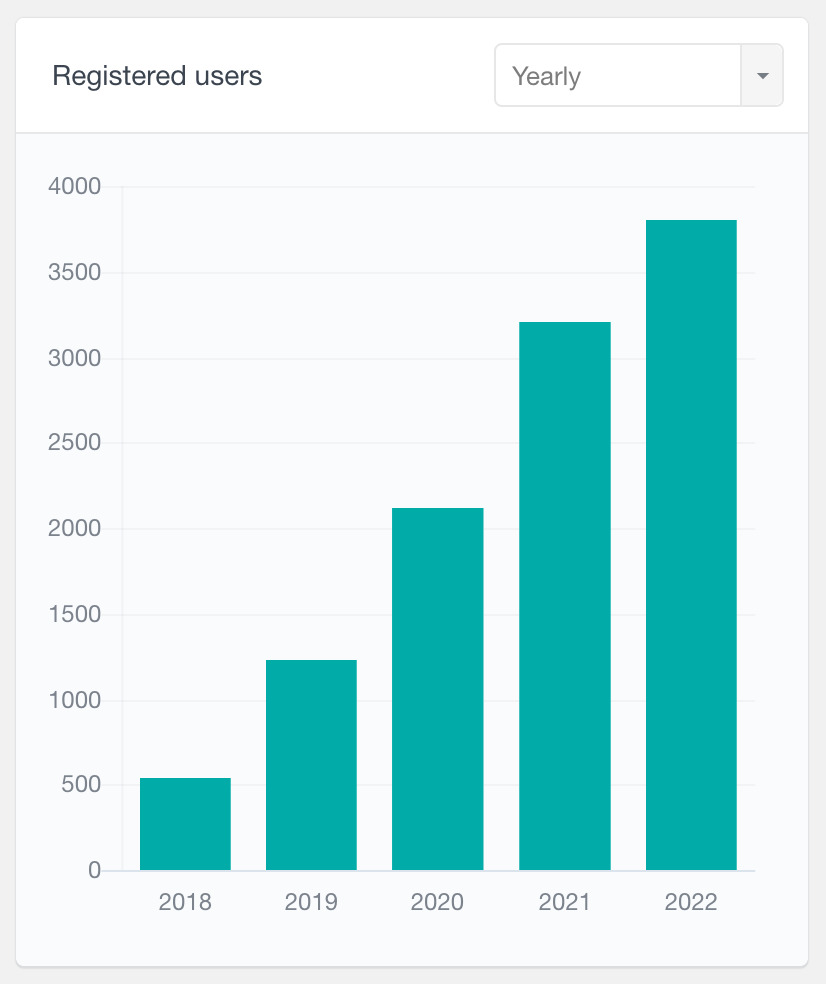
Registered WordPress Users Report
The registered users report shows the number of users registered by date. It supports a daily, weekly, monthly and yearly views. By default it shows the number of WordPress users registered for the most recent period, however for a custom reporting, you have the option to move back in time and explore previous periods. This WordPress user report can be very useful to explore the user base growth over time on your WordPress site.
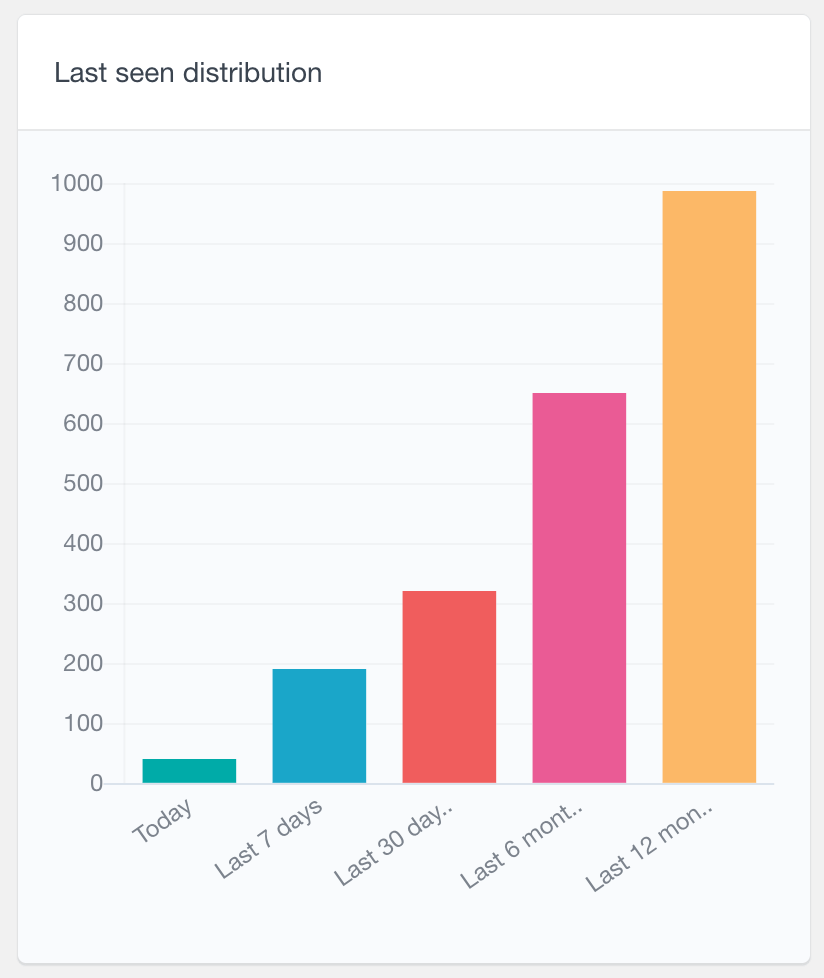
WordPress User Last Seen Distribution Reports
The Last seen distribution report is part of the Activity module and it shows the number of users that last logged into your site during various recent periods. This includes periods like Today, Last 7 days, Last 30 days and Last 12 months. This report is particularly useful for understanding user engagement and identifying trends in activity.
User Geolocation WordPress Reports
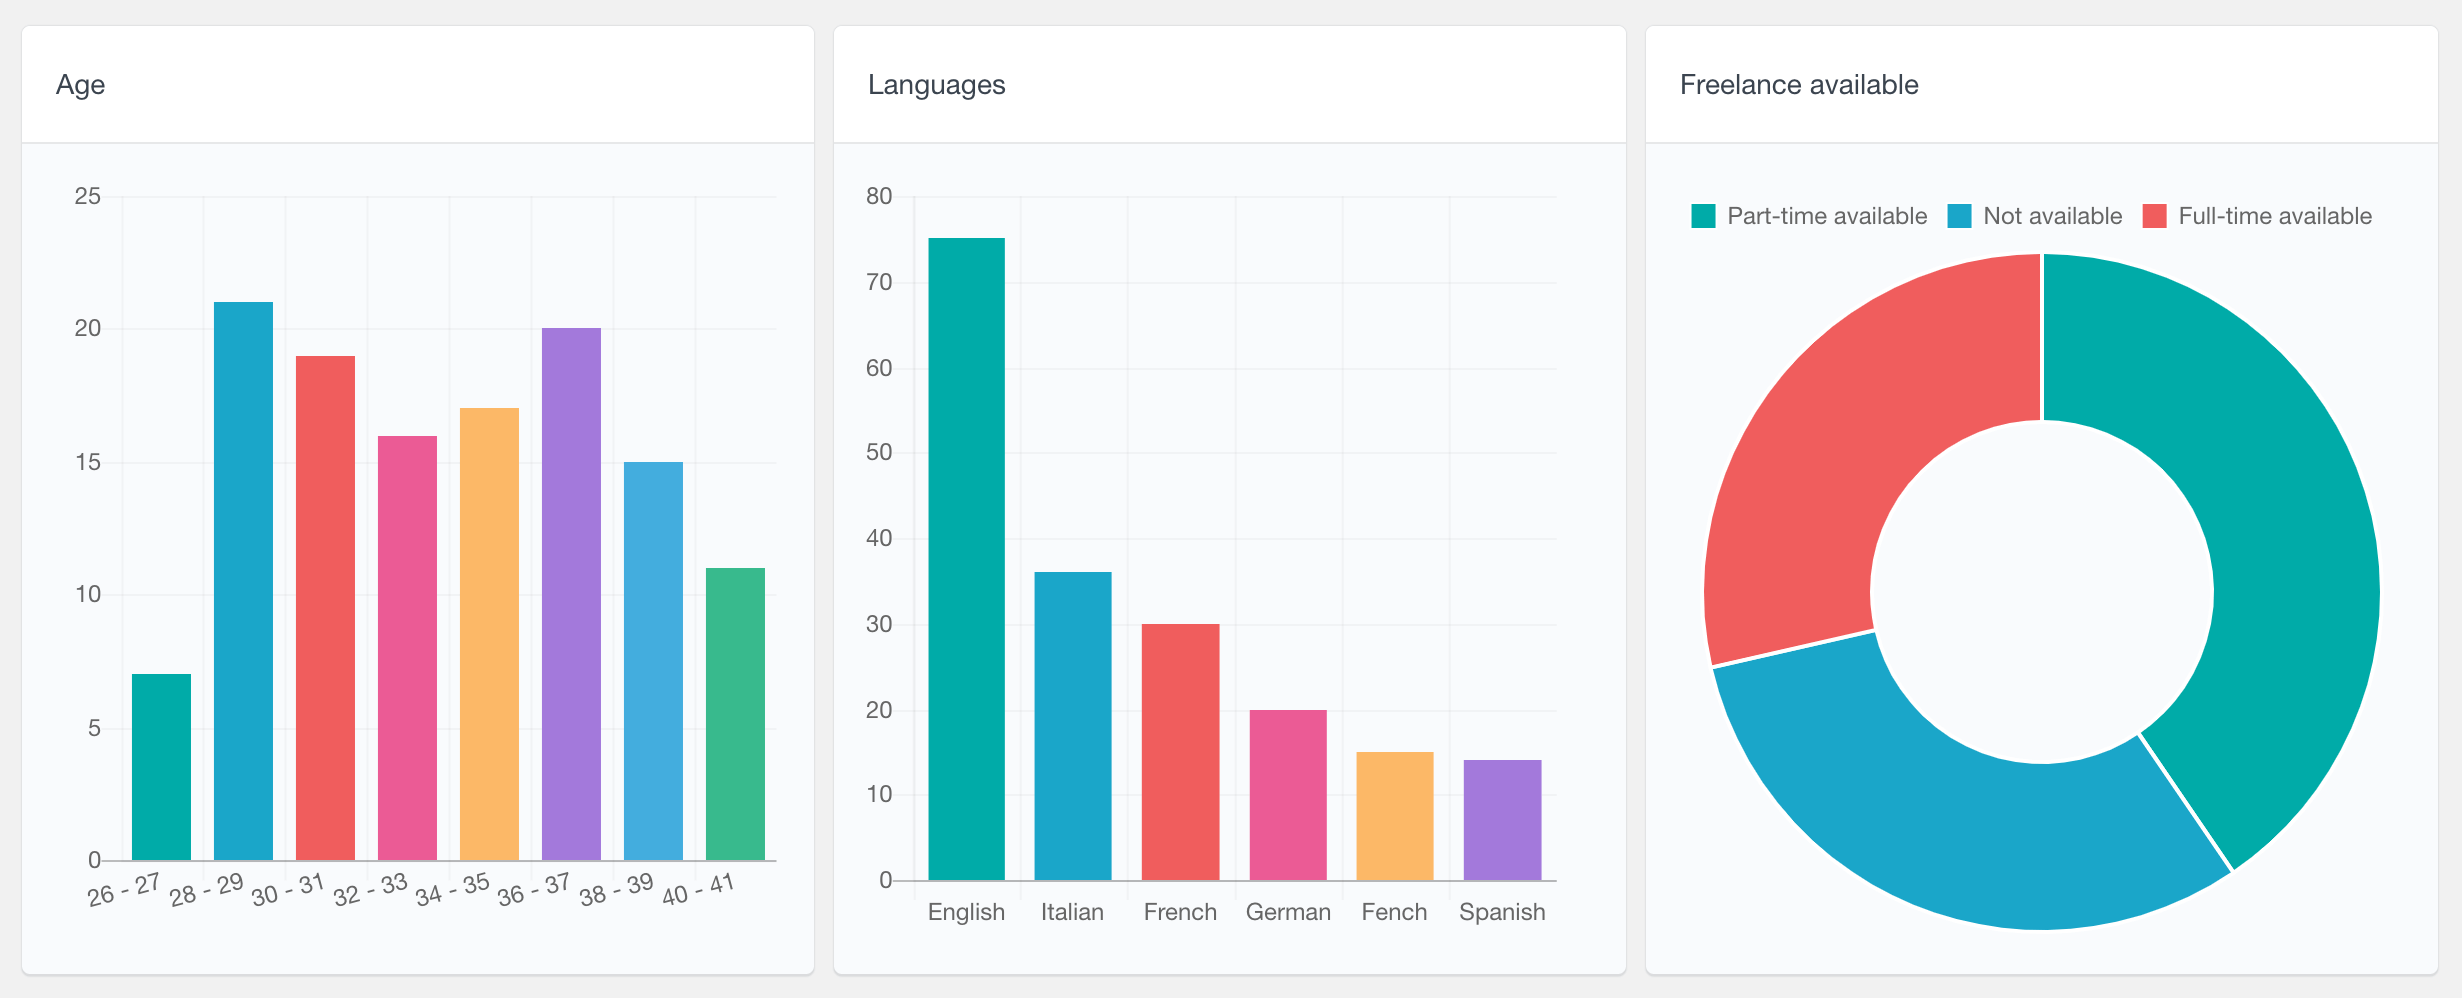
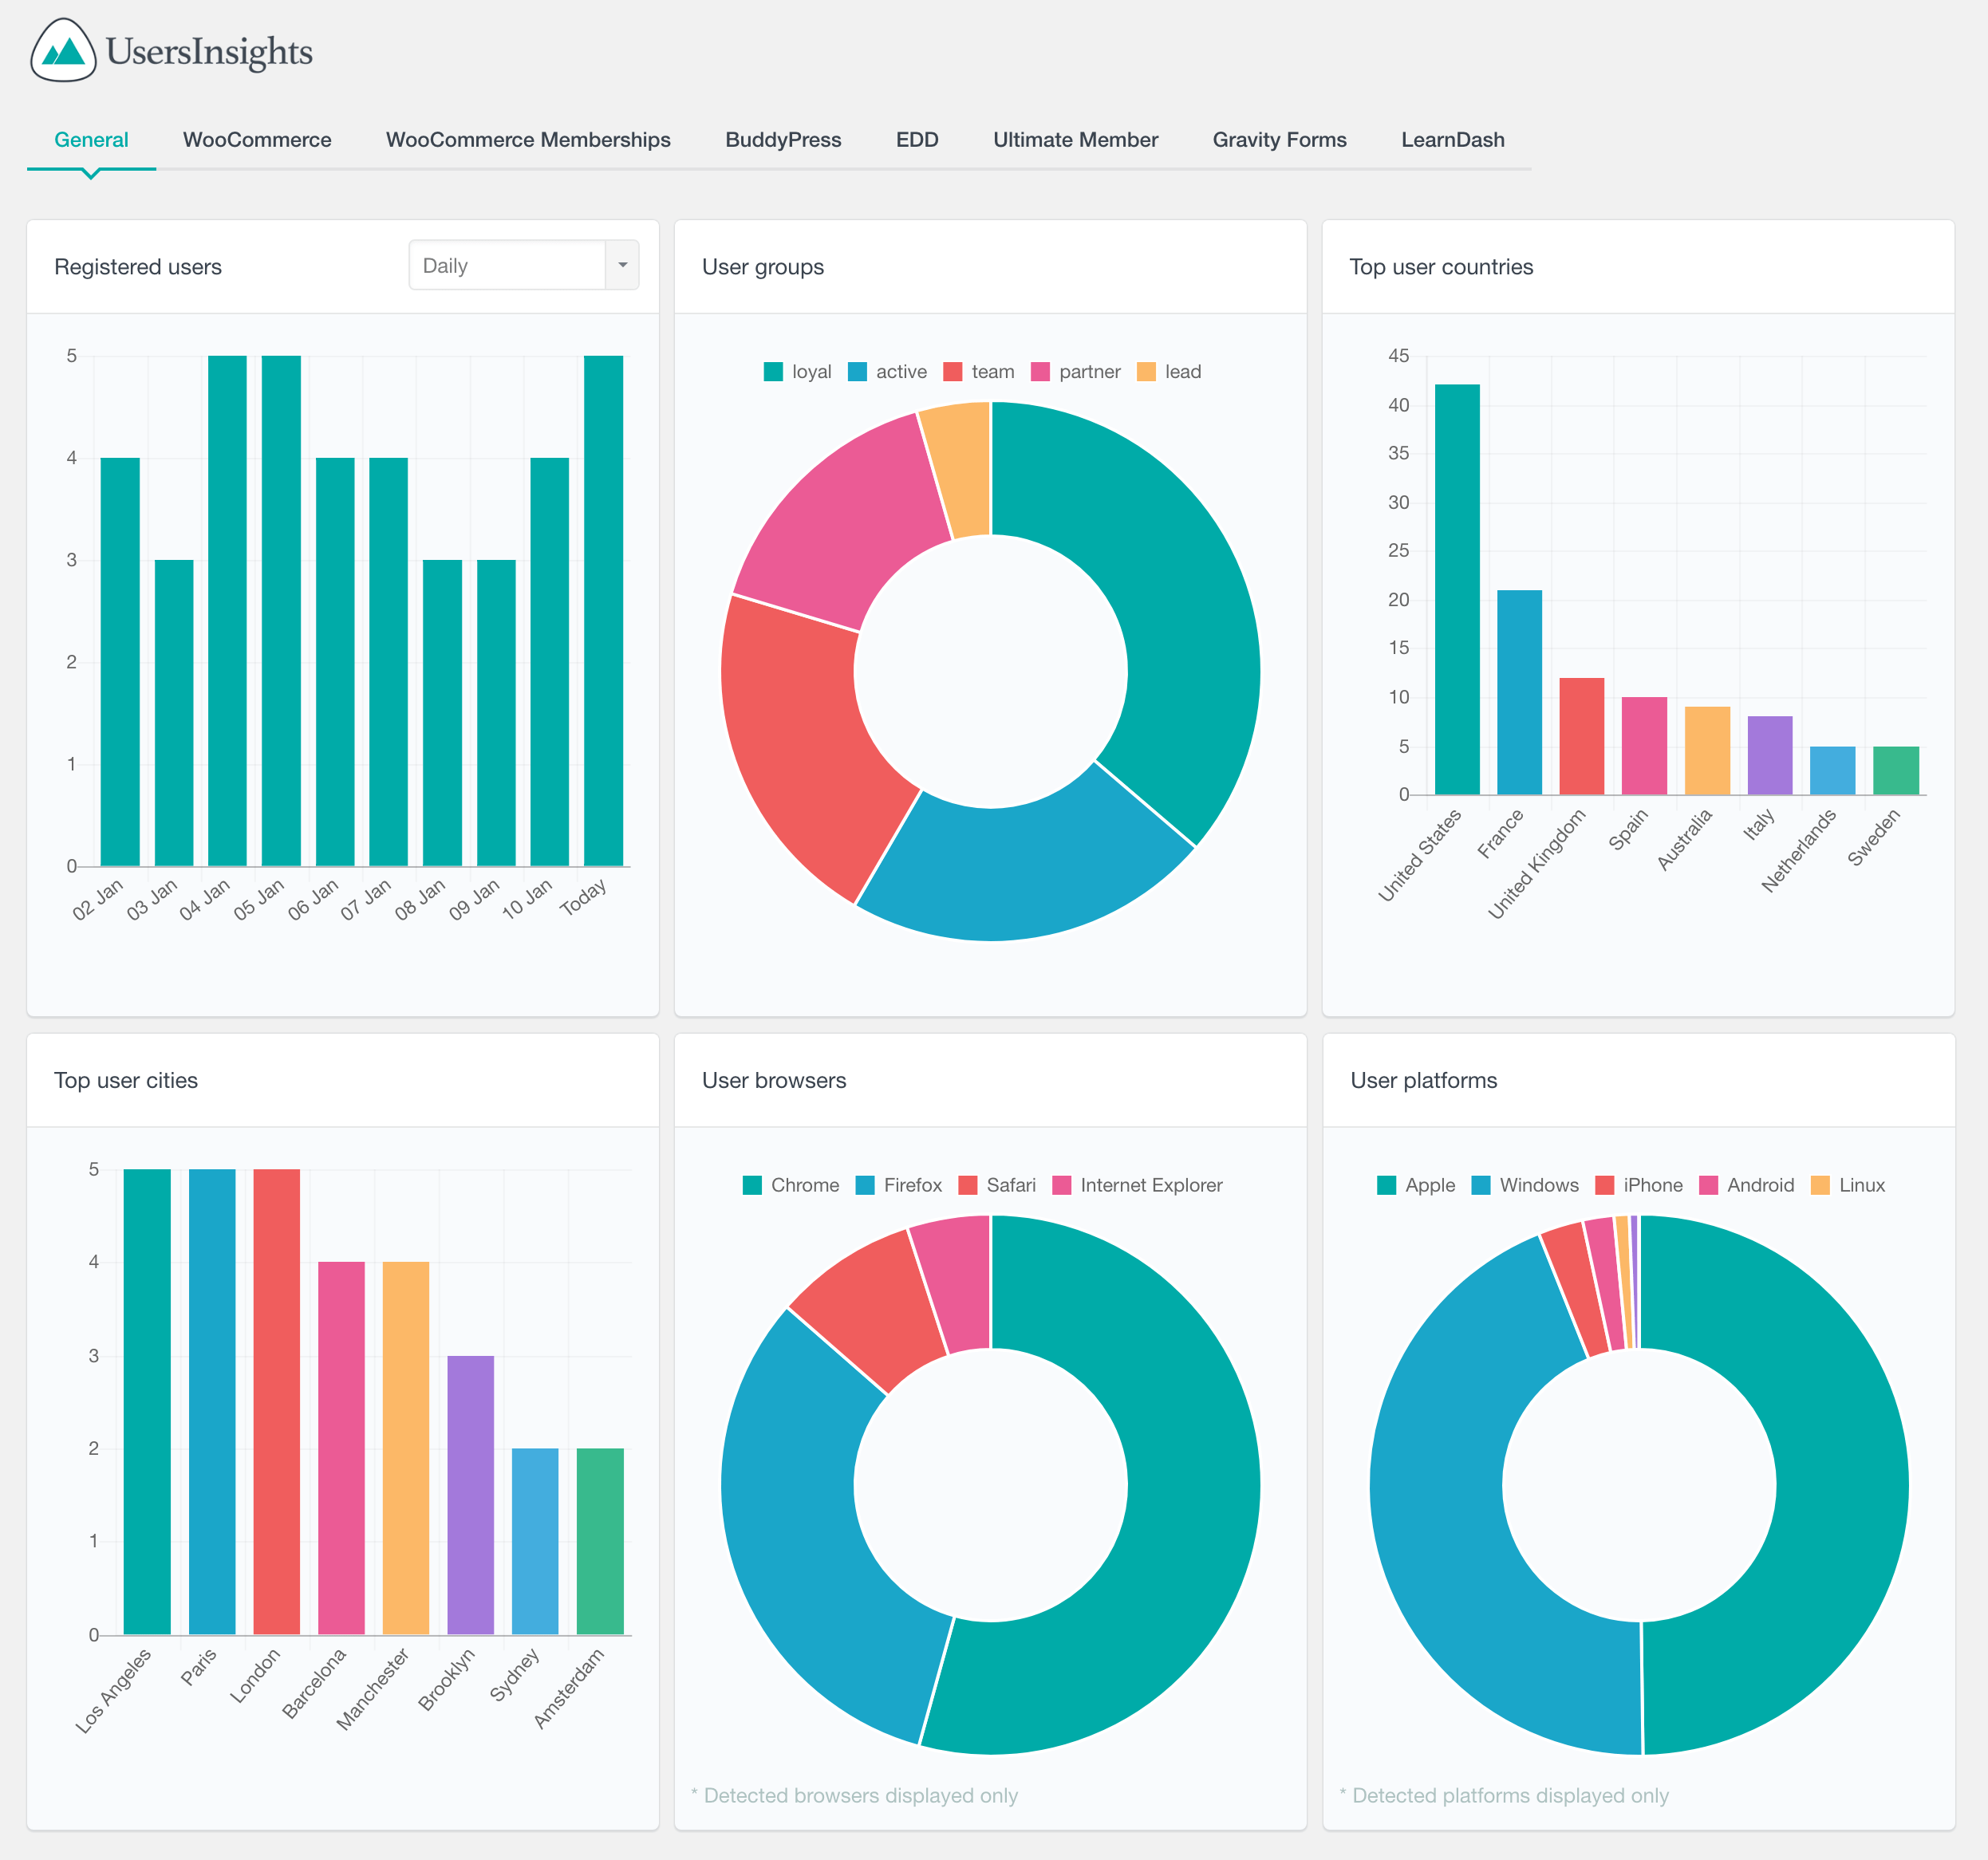
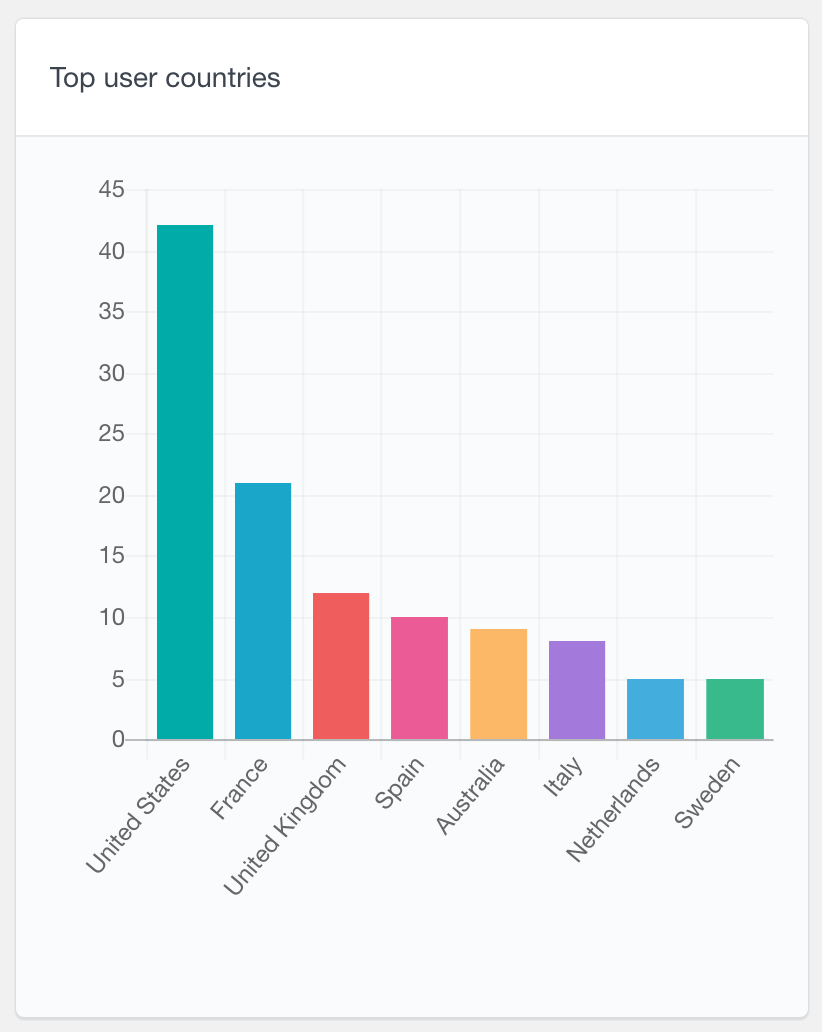
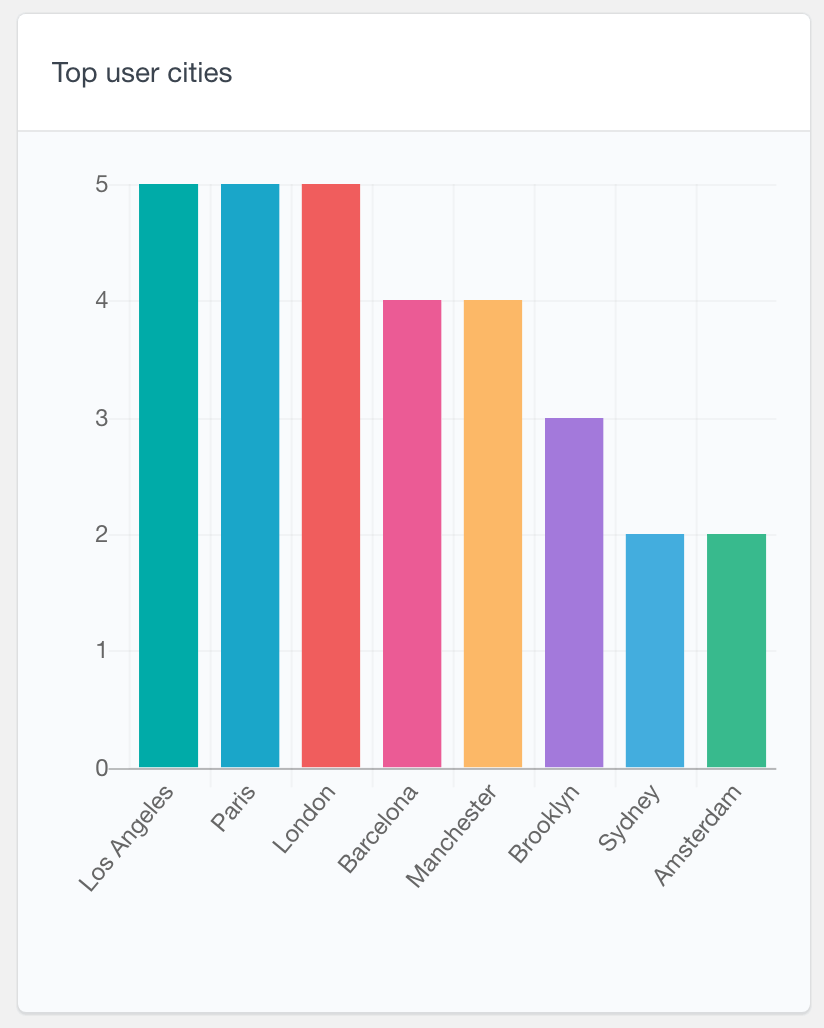
If you have the Geolocation module active, the Geolocation reports will show you all the detected geolocation details of your WordPress users. The geolocation data that Users Insights detects is the user country, region and city. Therefore, the following user geolocation reports are available:
- Top user countries
- Top user regions
- Top user cities
These WordPress reports are available as a bar chart, showing the top several locations that your users come from. The geolocation reports can help you create WordPress clients reports with demographic analysis, which can be used to improve your product or services.
User Browser & Platform Reports
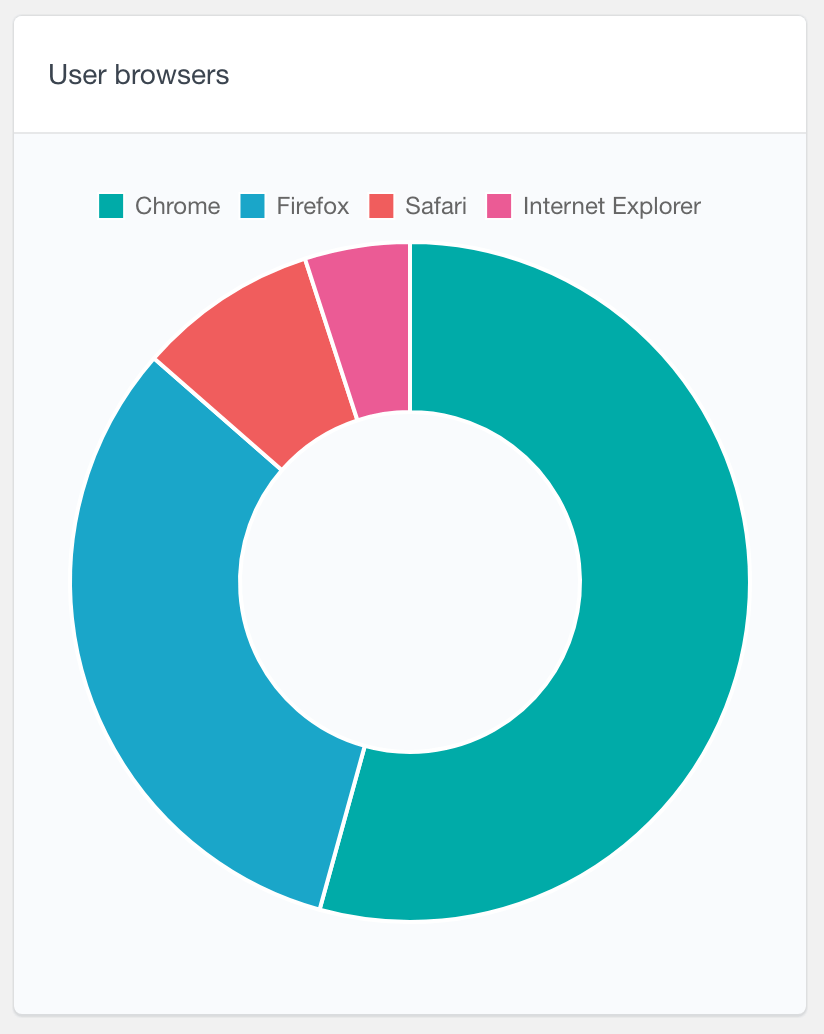
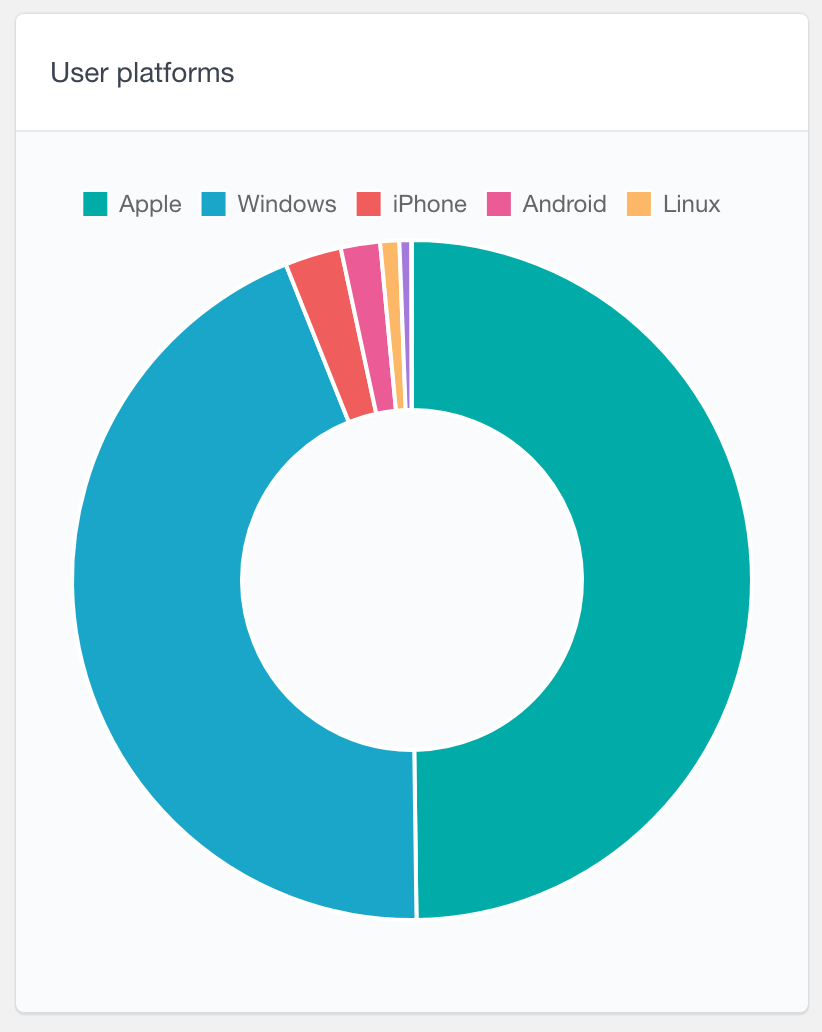
With the Users Insights Device Detection module active, you can see the detected user browser and platform data in the Reports section of your WordPress dashboard. The User Browsers report shows the percentage of each browser, such as Chrome or Firefox, that your users use. Similarly, the User Platforms report shows the platforms usage reports data, such as Apple or Windows, in a pie chart.
Export Reports as PDFs
Users Insights lets you export chart reports as PDF files. The PDFs include both the chart and the data in table format. This makes sharing or saving your reports easy without needing access to your WordPress dashboard.
WooCommerce Reports
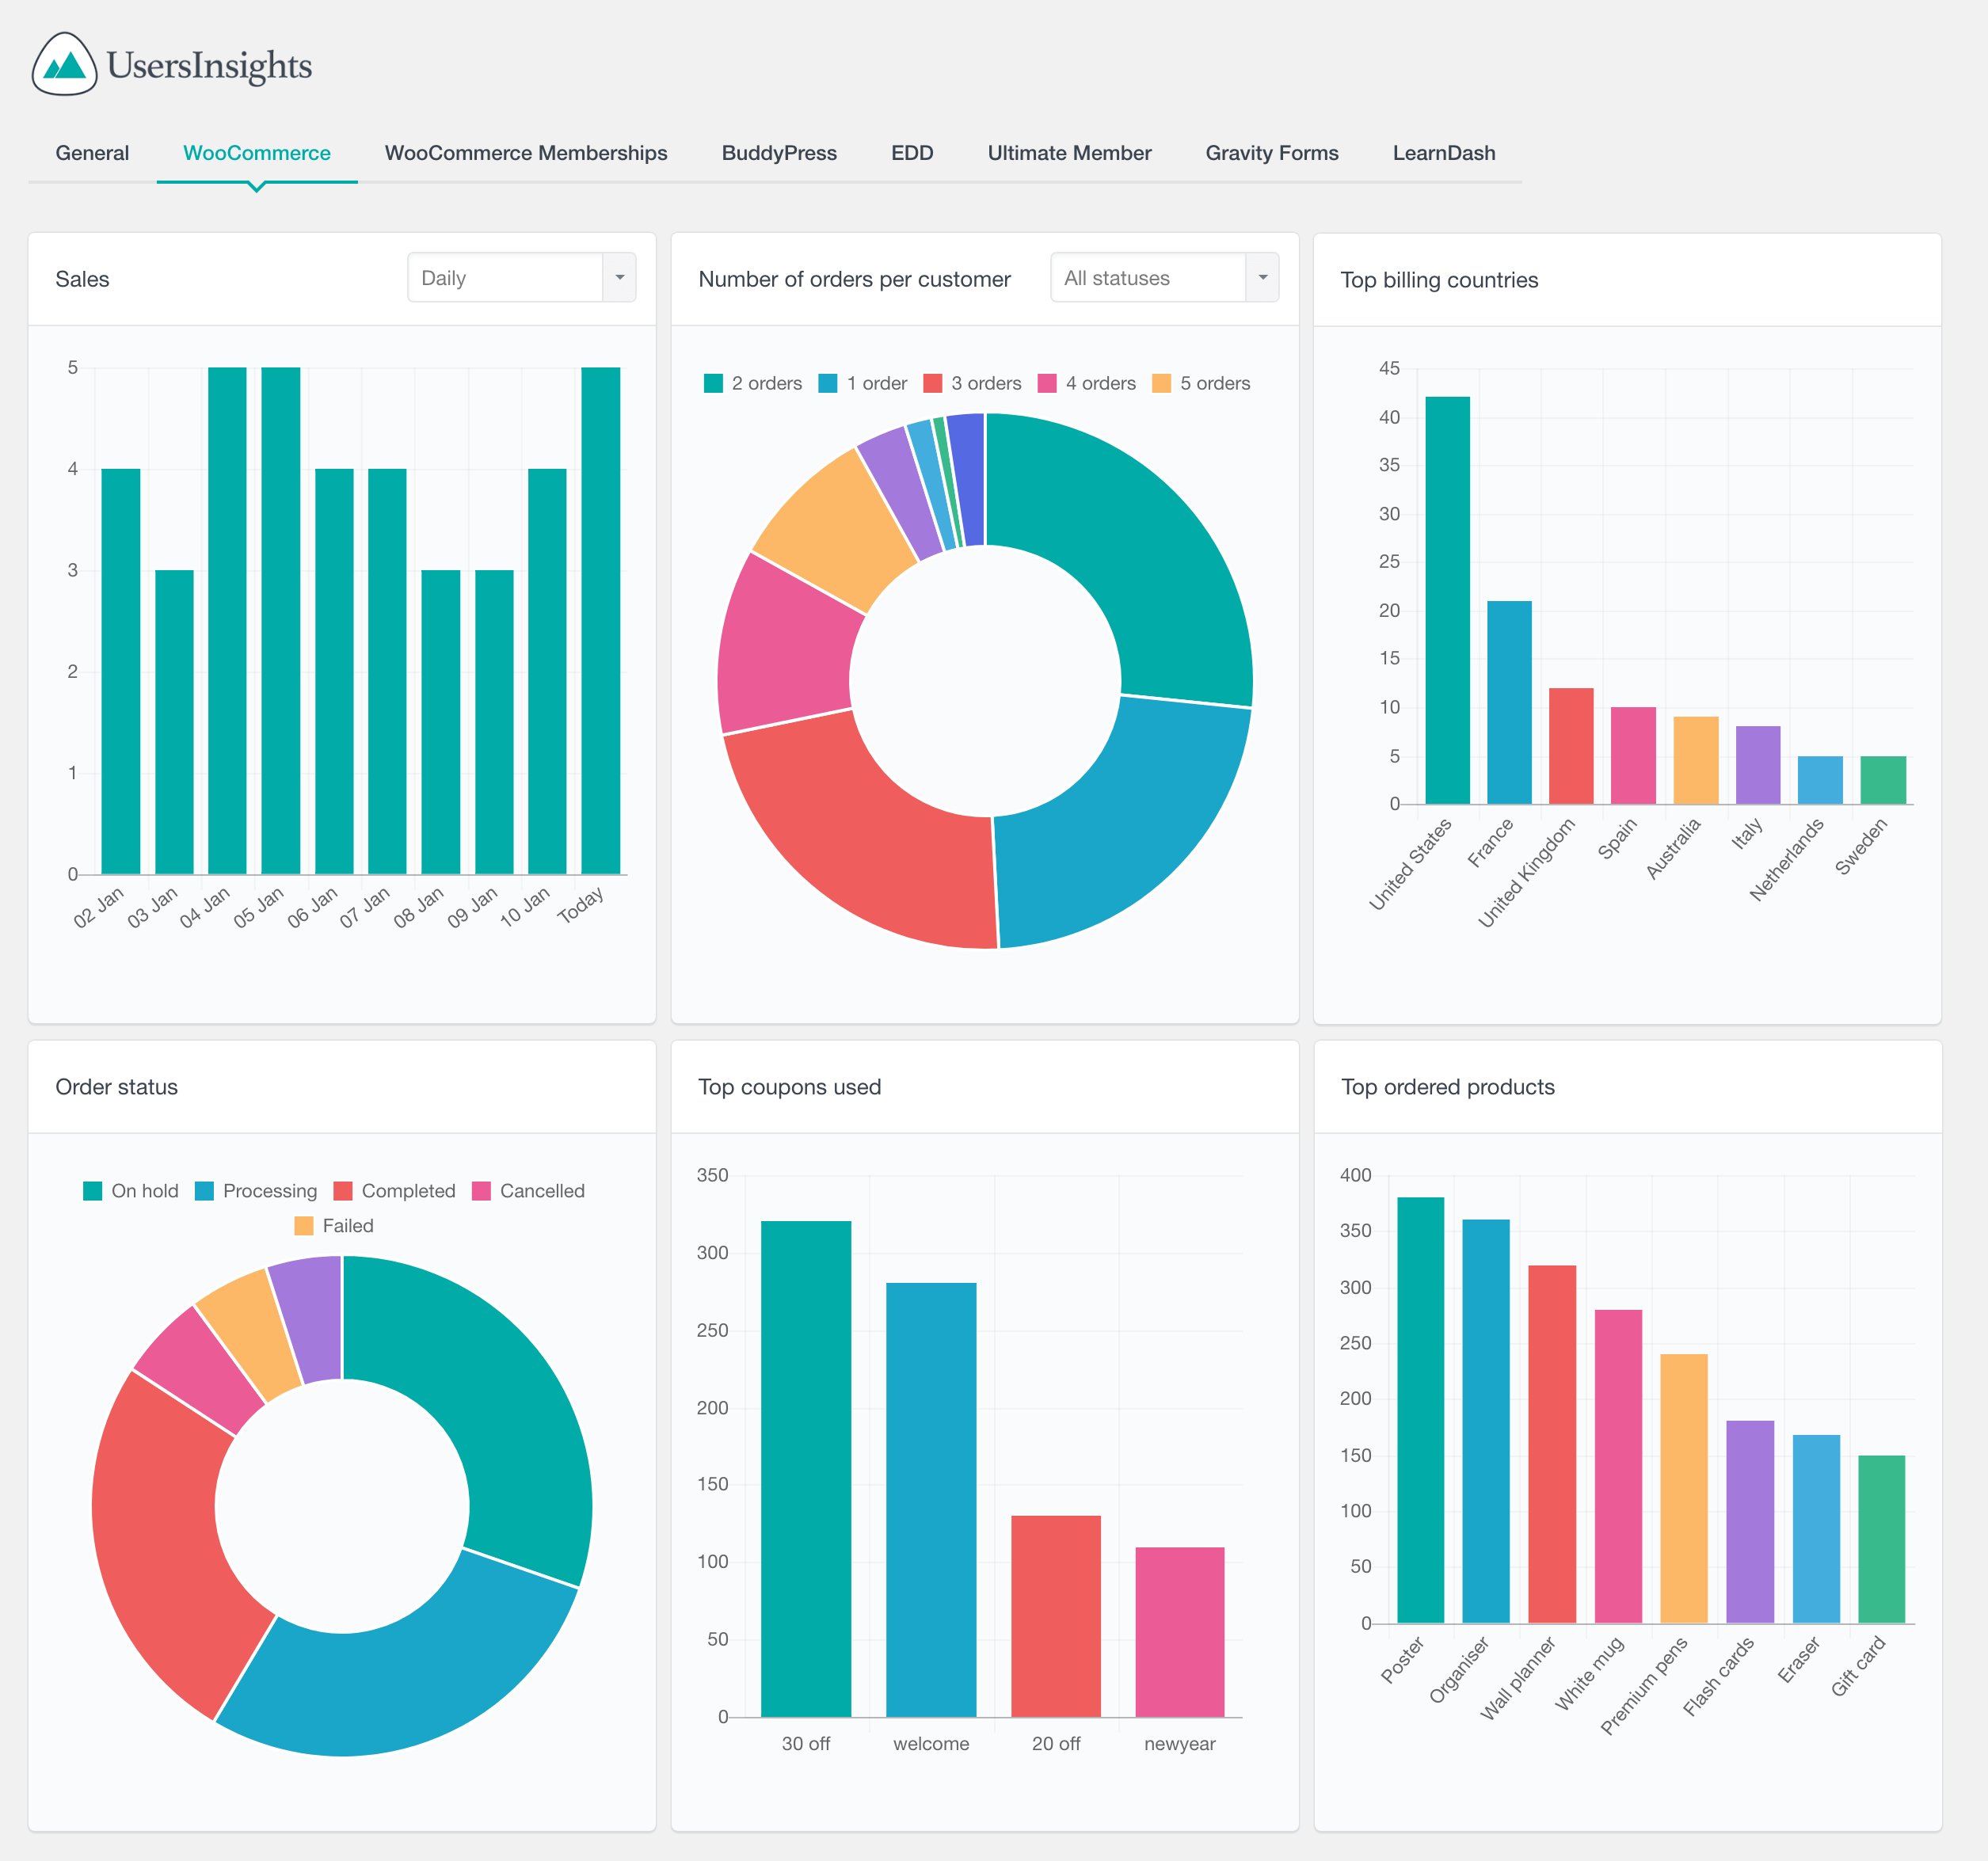
The WooCommerce Reports show various data related with your WooCommerce customer orders. With these reports you can monitor and analyze your shop performance, without having to use complex external tools. The following WooCommerce reports are available:
- Sales reports – showing the number of sales made in daily, weekly, monthly and yearly periods
- Sales total – WordPress sales report that shows the total amount of the sales over time
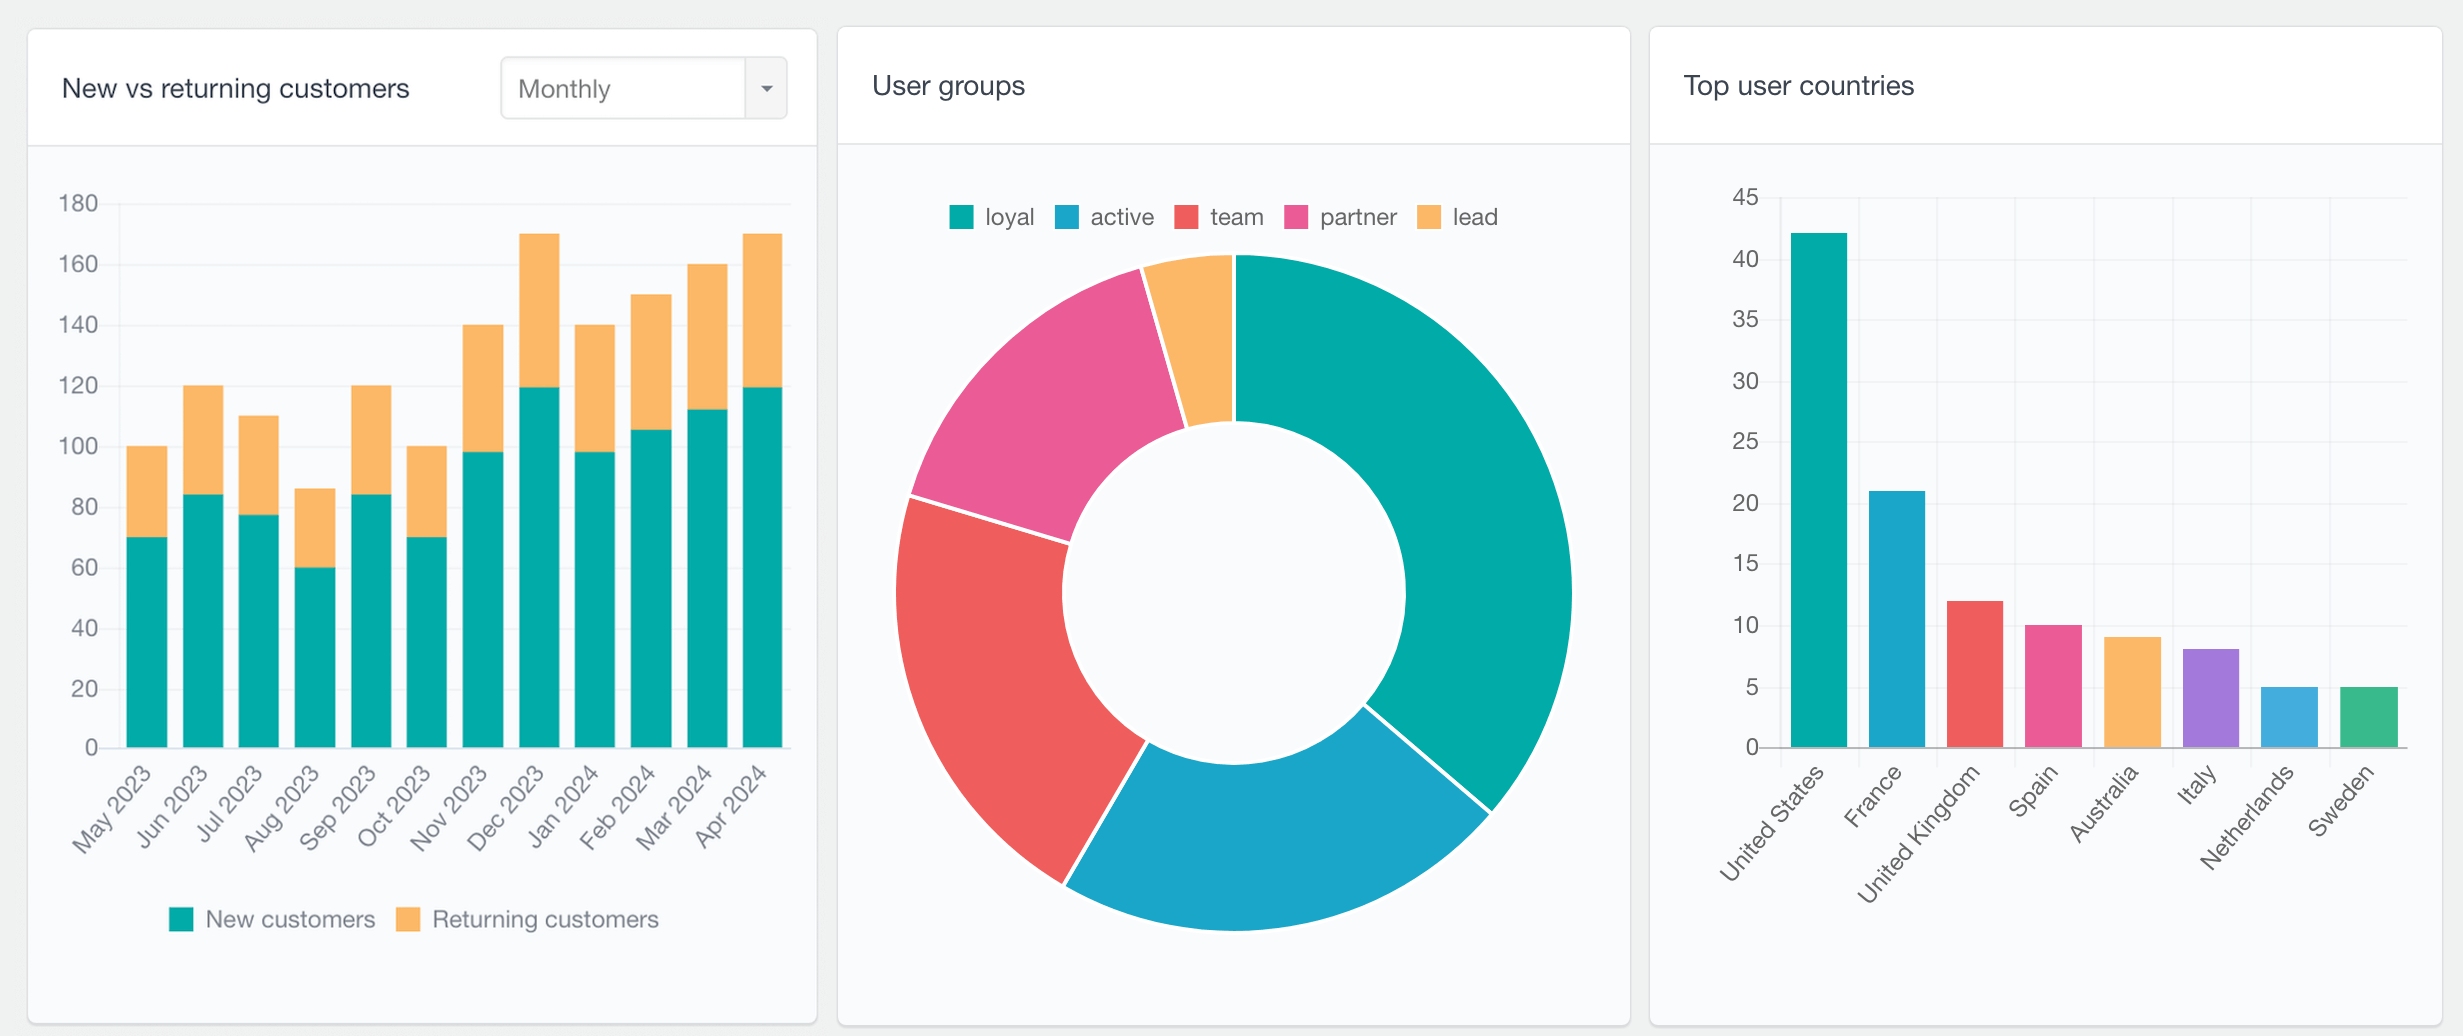
- New vs returning customers – showing the number of new and returning customers in daily, weekly, monthly and yearly periods, with different colors for each type of customer.
- Number of orders per customer – a pie chart showing the percentage of customers that have 1, 2, etc. orders. It can be further filtered by the order status, so for example, you can see only the completed orders.
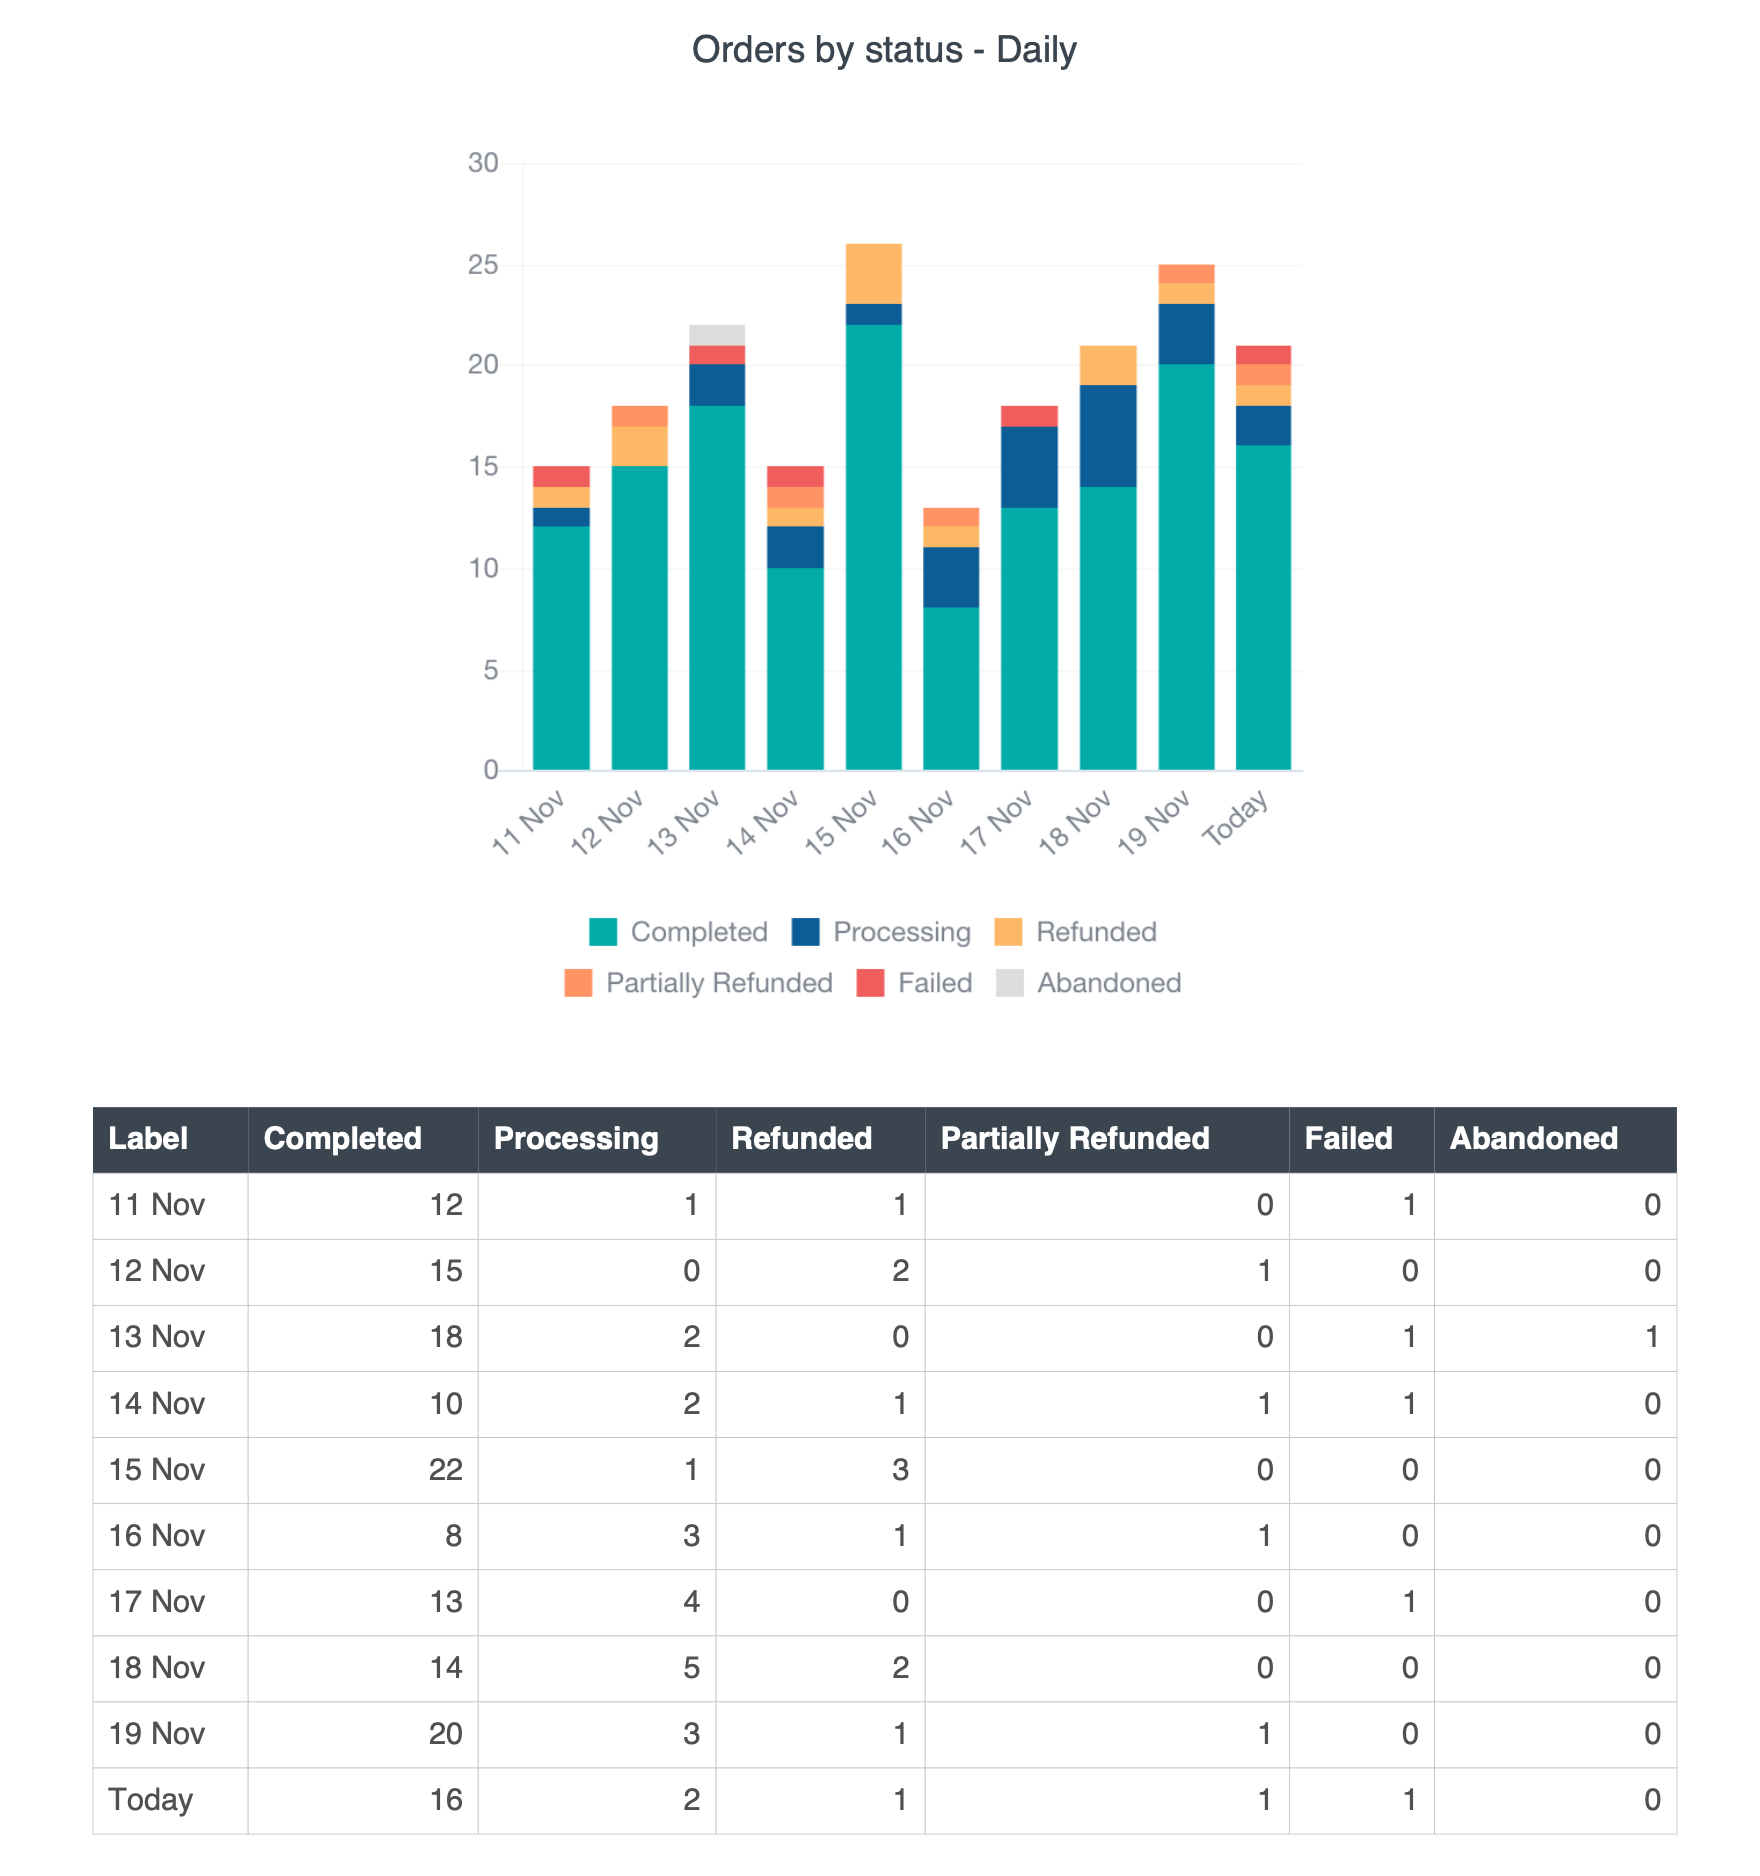
- Orders by status – tracks orders over time with distinct colors for each status
- Performance comparison – comparison of number of orders, sales and refunds vs previous period
- Top billing countries
- Top billing states
- Top billing cities
- Order status – a pie chart showing how many orders there are from each status
- Top ordered products
- Top coupons used
- Payment methods used
To learn more about the available reports, you can visit the WooCommerce Reports page.
WooCommerce Product Sales Reports
Users Insights also includes a dedicated WooCommerce product reports section, allowing you to analyse each product individually. The following reports are available in this section:
- Frequently bought together (top products that are frequently ordered with the selected product)
- Sales – number of orders containing the selected product with status completed, processing and on hold
- Items sold – number of items sold in sale orders
- Items sold total amount – the total value for items in sale orders
- Top ordered variations (for variable products) – showing the names of the top ordered variations
- Top ordered attributes (for variable products) – showing the names of the top ordered attributes
- Orders by status – shows the distribution of orders over time with color-coded statuses
- Performance comparison – analysis of number of order, sales, and refunds compared to the previous period
- Order statuses – showing the statuses of the orders containing the selected product with the option to filter by date
To learn more, visit the WooCommerce Product Sales Reports page.
WooCommerce Product Category Reports
Users Insights also features a dedicated section for WooCommerce product category reports, enabling you to analyze each product individually. Available reports in this section include:
- Sales – number of orders containing a product from the selected category with status completed, processing and on hold
- Items sold
- Items sold total amount
- Orders by statuses – orders over time with color-coded statuses
- Order statuses – showing the statuses of the orders containing a product from the selected category
- Best selling products in category
To learn more, visit the WooCommerce Product Categories Reports page.
WooCommerce Memberships Reports
In addition to the general WooCommerce reports, the Users Insights reporting plugin also generates a set of reports for the WooCommerce Memberships plugin. If you are using the WooCommerce Memberships plugin to manage a membership site, the Users Insights reports will help you analyze your memberships performance. The available reports are:
- New members – showing historical data of the number of new members subscribed in daily, weekly, monthly and yearly periods
- Ended memberships – showing the number of memberships that have expired or have been cancelled over time
- Number of memberships per plan – a pie chart showing how many memberships each plan has. It can be further filtered by the membership status, so for example, you can see only the active memberships
- Membership statuses – showing how many memberships of each status there are. This report can be further filtered by a membership plan, so you can explore the statuses of a selected plan only
To learn more, visit the WooCommerce Memberships Reports page.
Ultimate Member User Reports
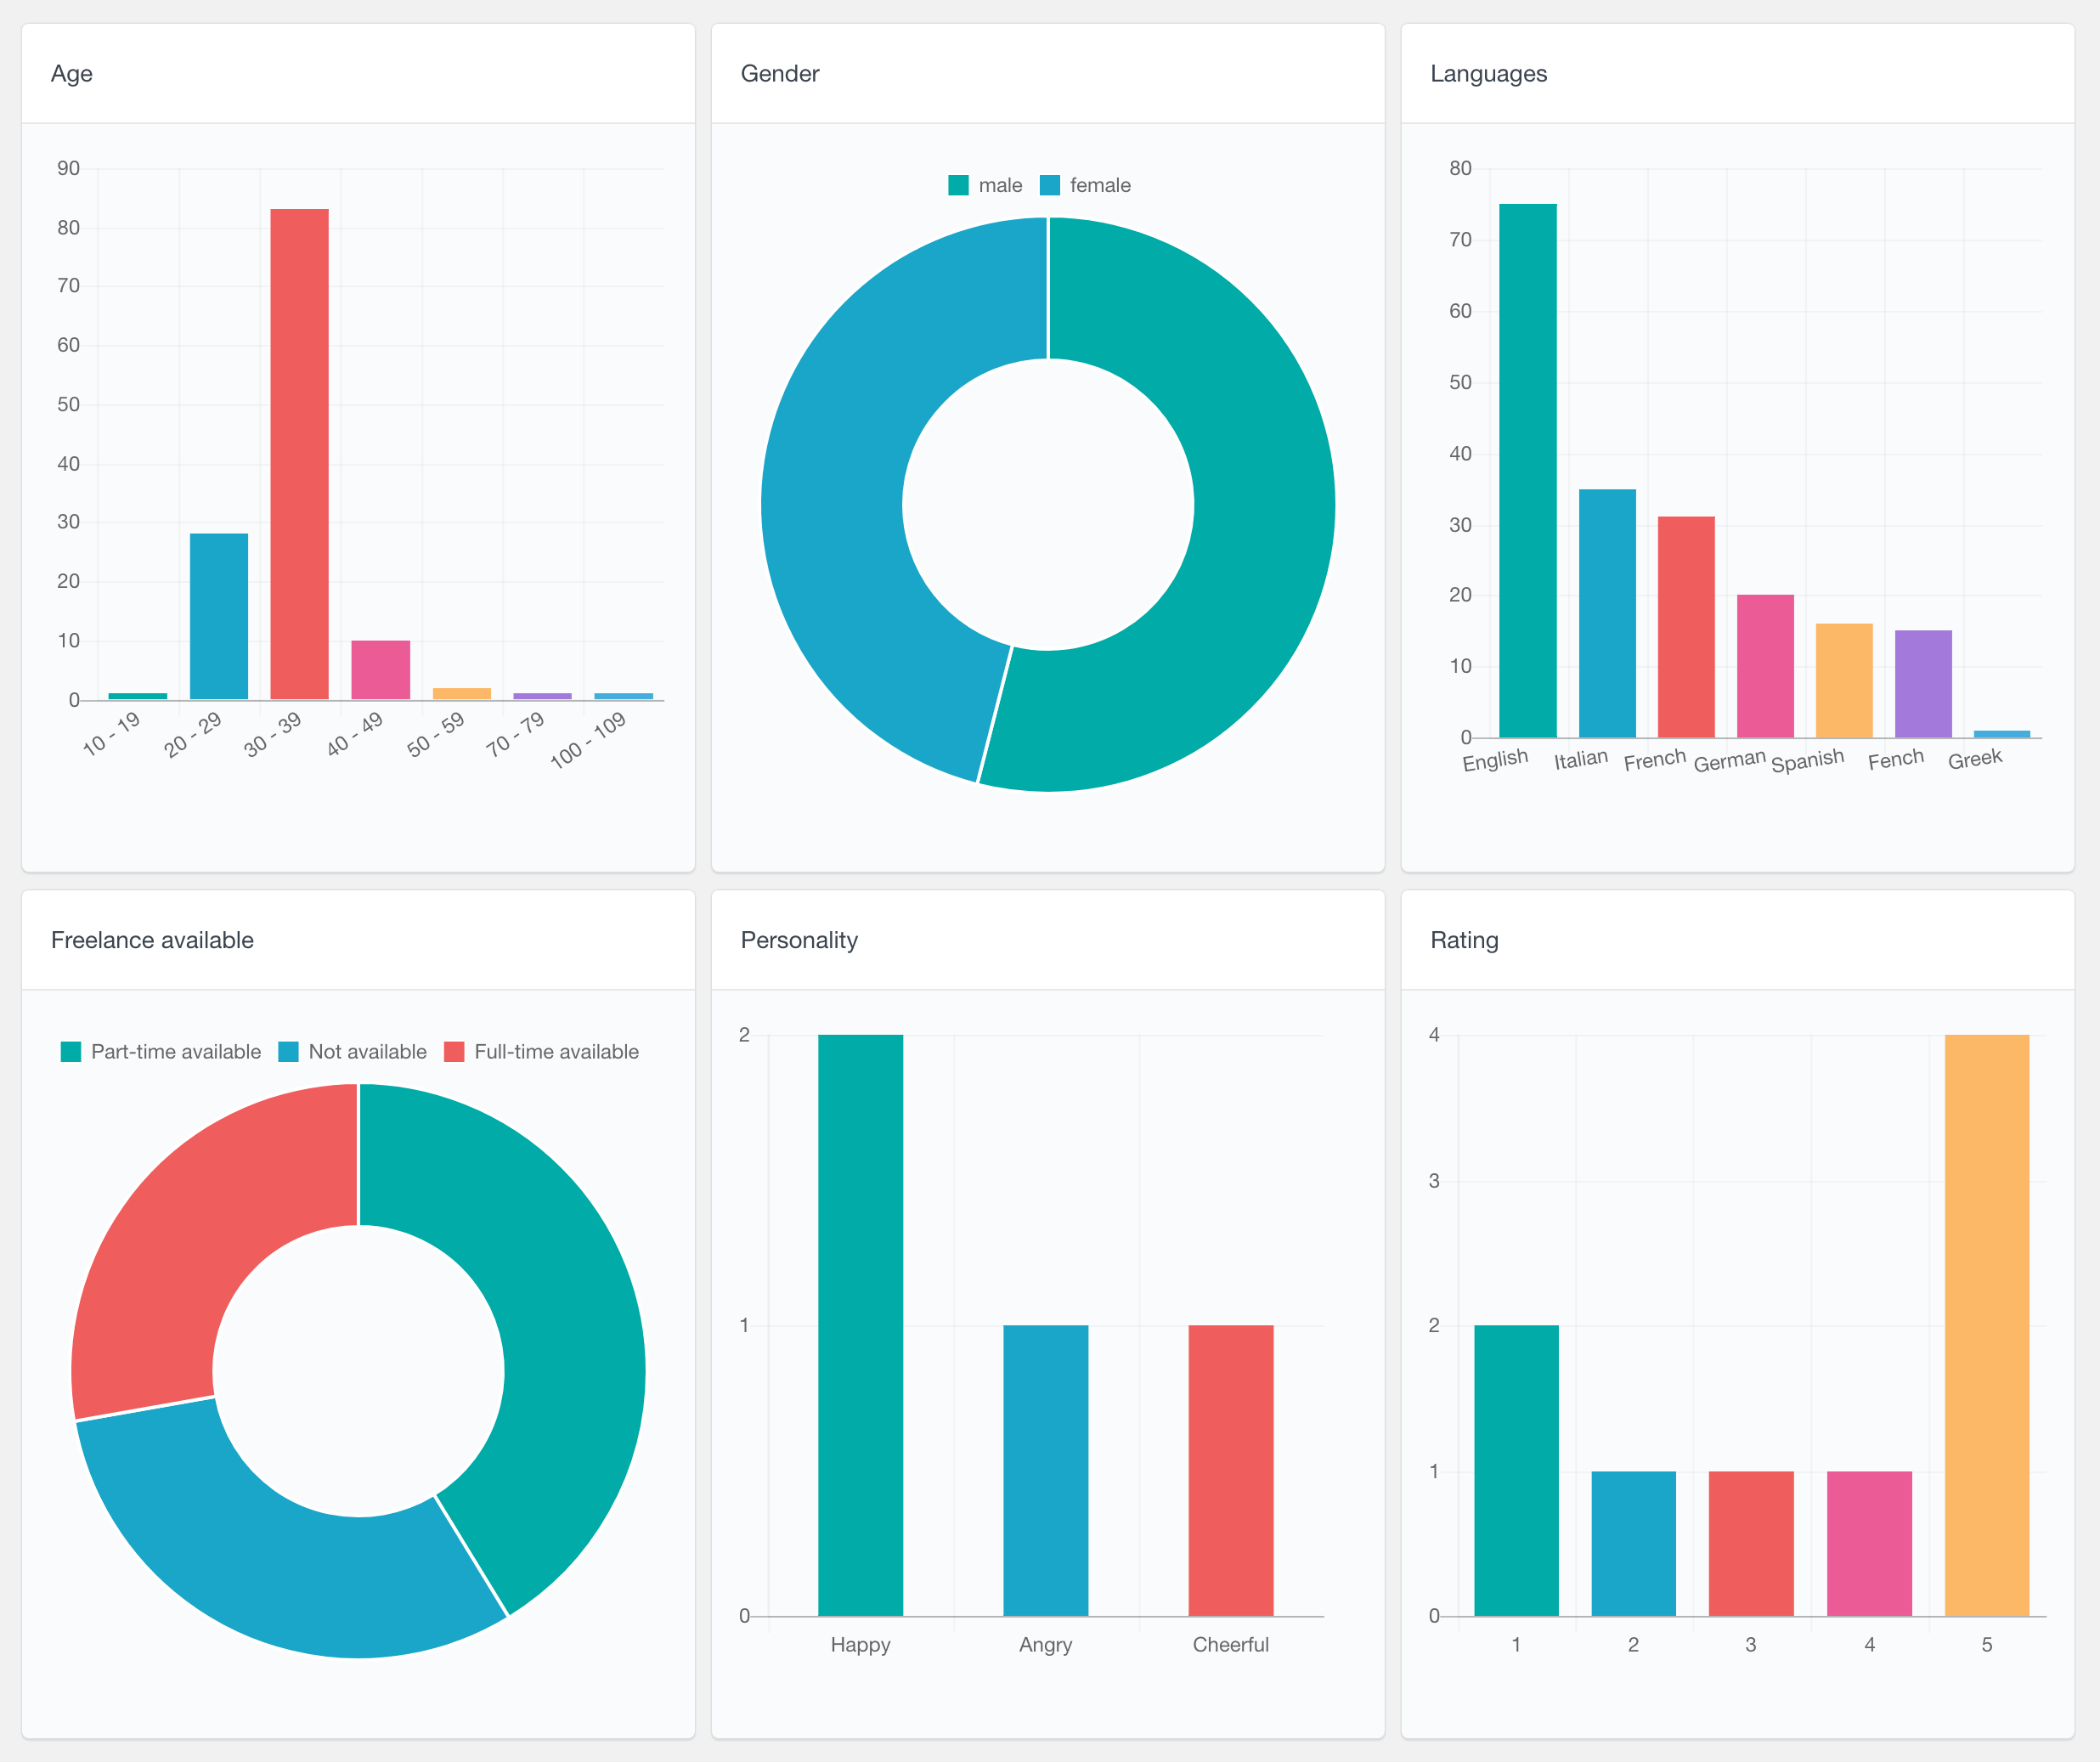
Users Insights also includes a reports module for the Ultimate Member plugin. These reports are dynamically generated based on your form fields settings. Users Insights detects the Ultimate Member forms along with their custom fields and provides data visualization for the data that your users have completed based on the field type. For example, radio field data is visualized in pie charts, based on the options selected. Or numeric field types are displayed in a bar chart, based on the ranges of the data.
For more information you can visit the Ultimate Member Reports page.
Gravity Forms User Reports
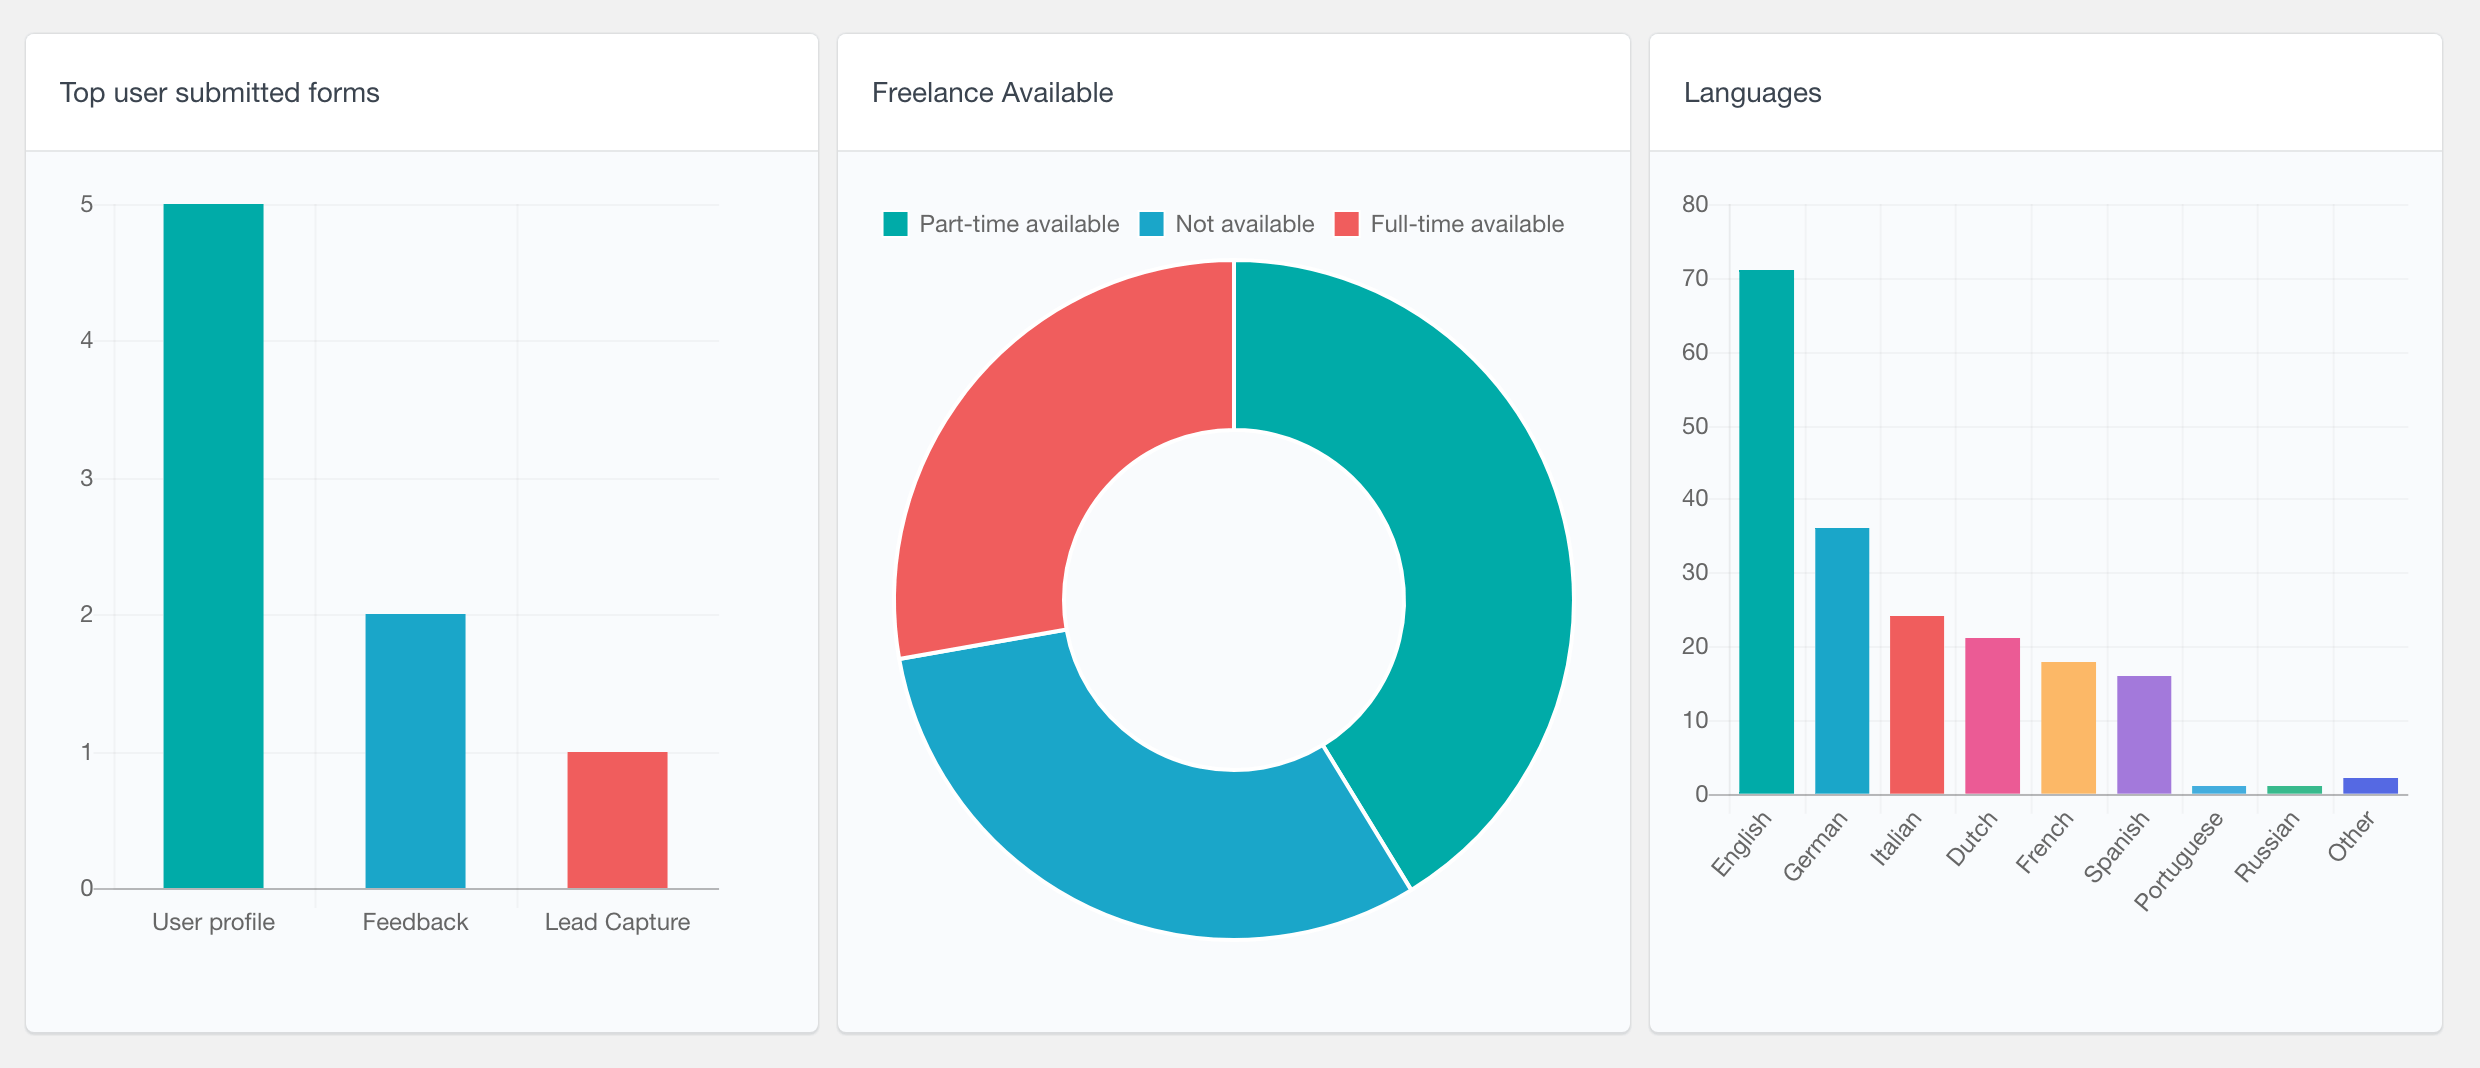
The Gravity Forms Reports of Users Insights consists of two parts. The first part is the Gravity Forms submission data, which is a WordPress form report showing the top user submitted forms. The second part of the form reports is the data submitted when using the User Registration Add-on. The Users Insights reporting tool detects the data submitted via the add-on and dynamically creates different reports based on the type of the form data submitted. For example, pie charts are displayed for single option fields and bar charts are displayed for multiple choice fields. This feature can be used to create your own WordPress survey reports.
Head over to the Gravity Forms Reports page to learn more about the available user reports.
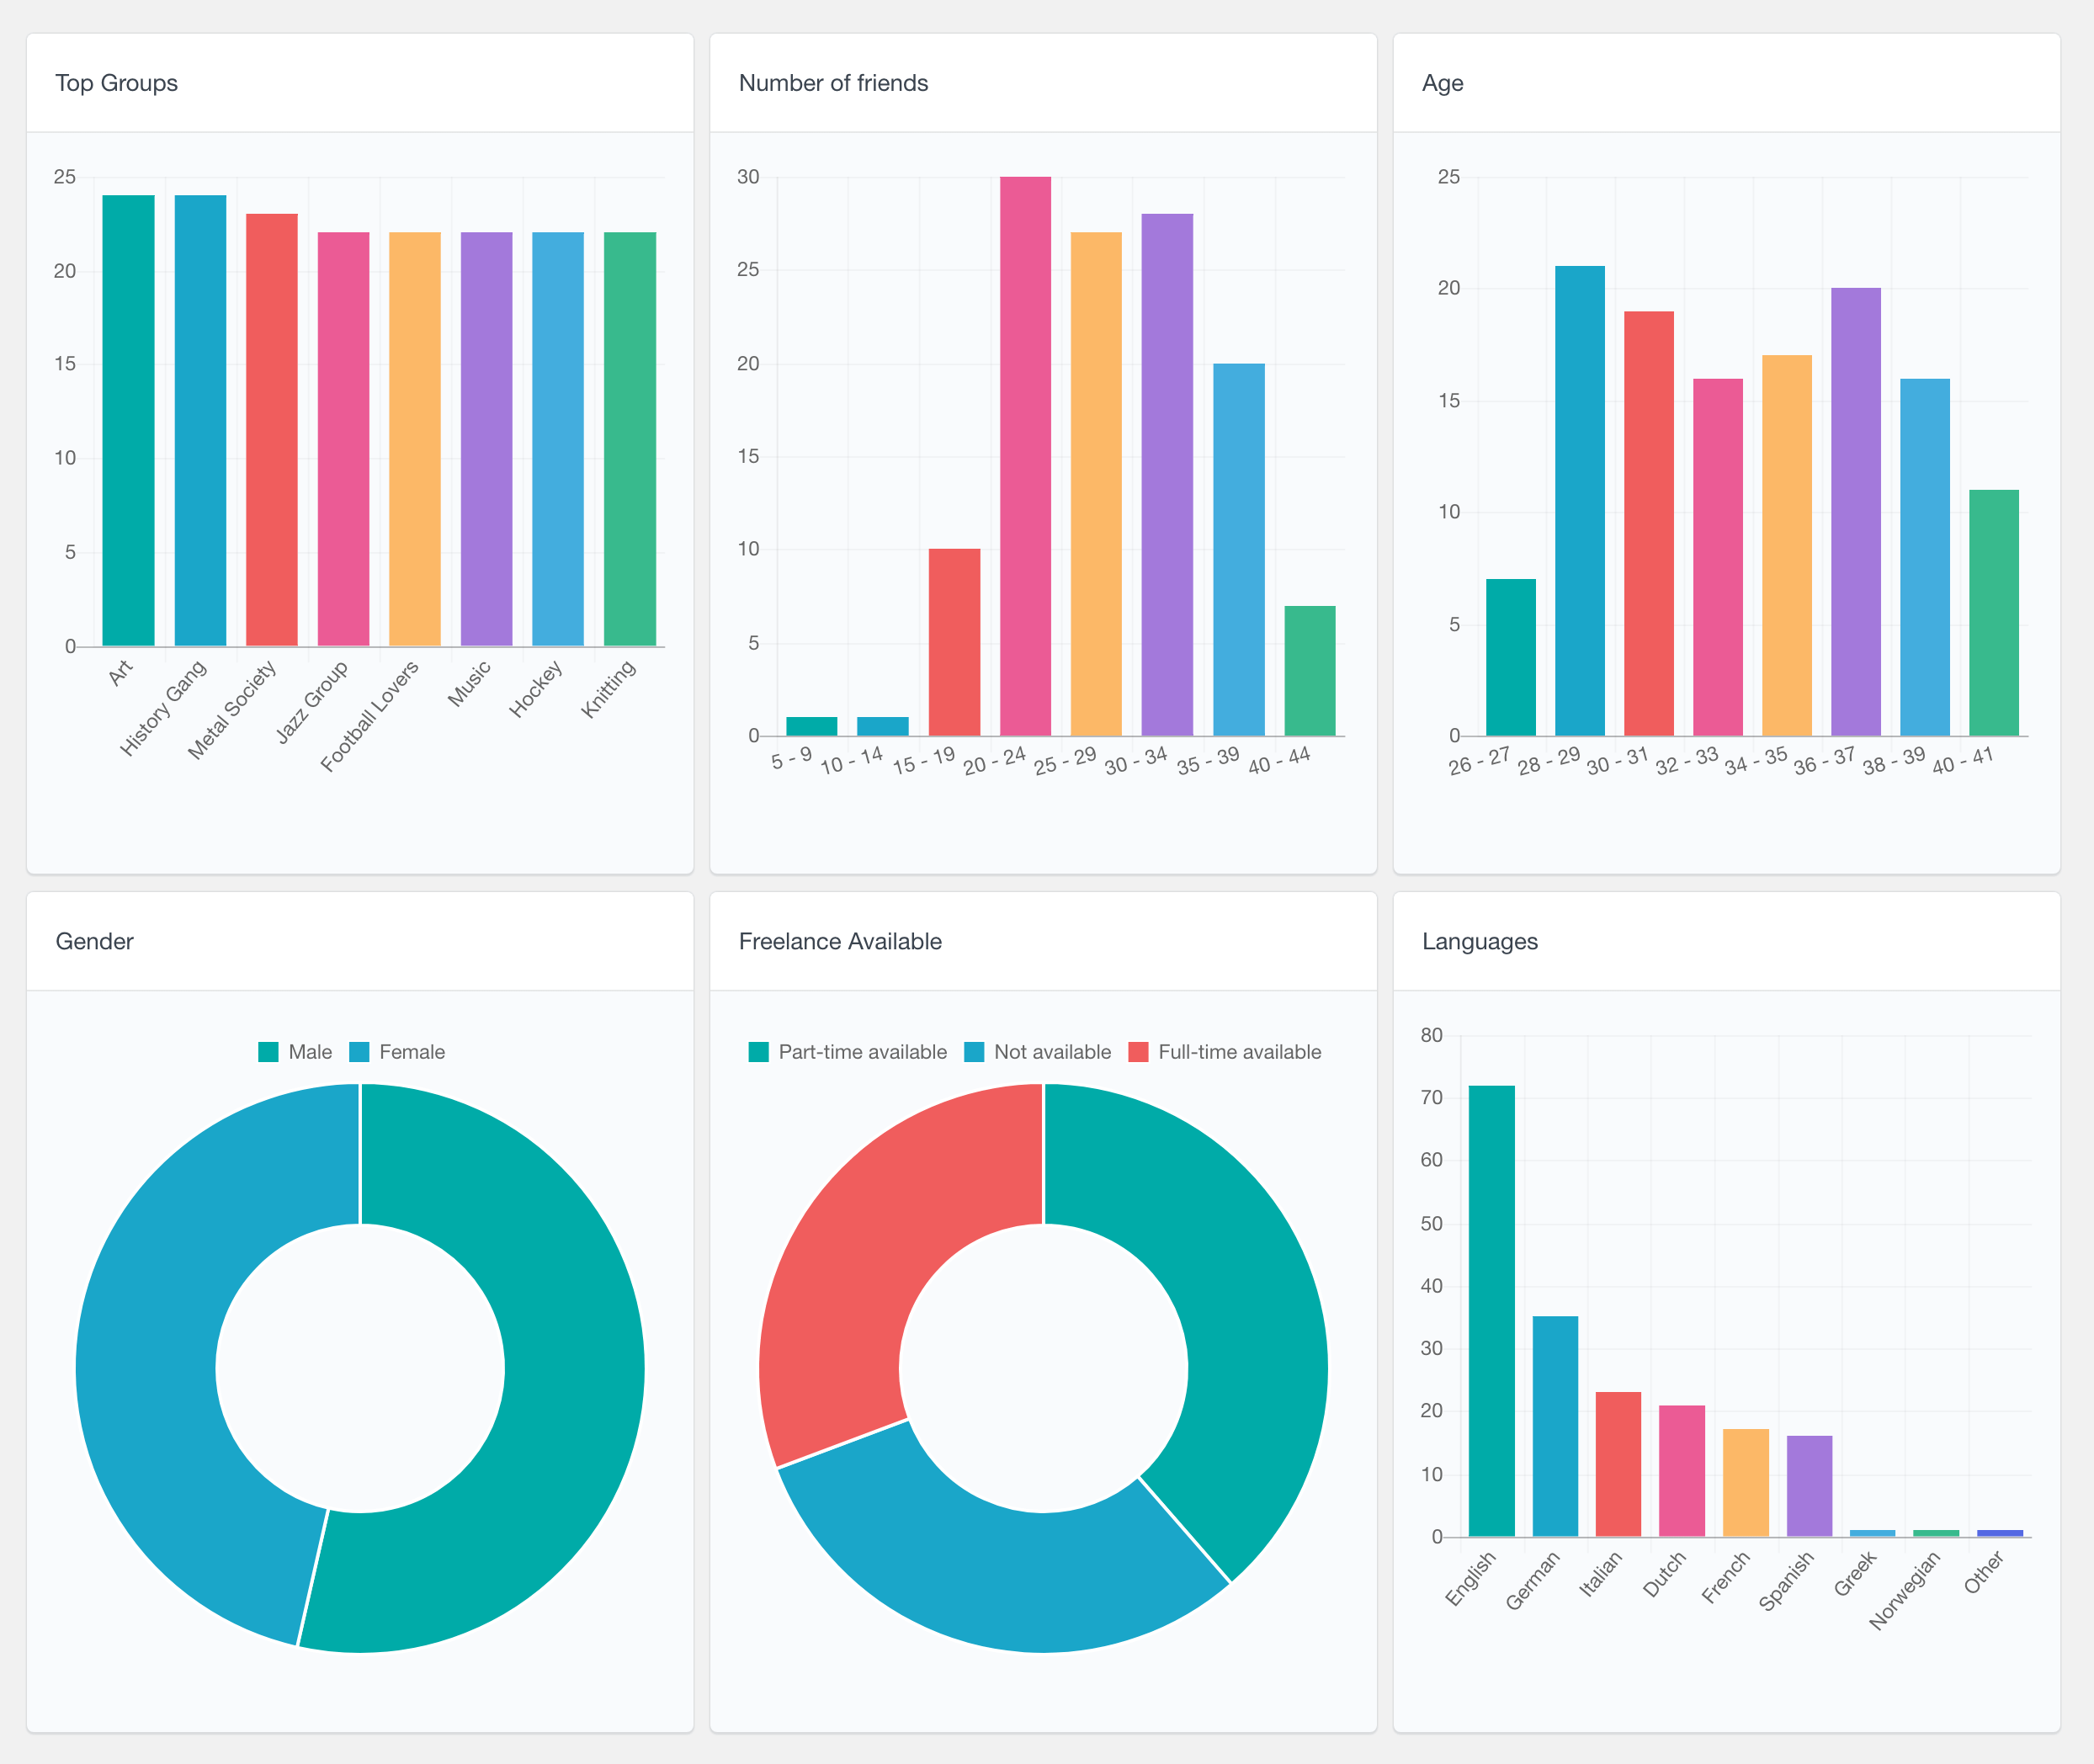
BuddyPress User Reports
As part of its BuddyPress module, Users Insights also provides reports for the BuddyPress plugin user data. These reports can help you analyze your user activity, such as find the most popular groups or see how many friends each user has on average. Additionally, reports of the user profile data are also available. Fields like single/multiple choice fields and numeric fields are automatically detected and presented with various graphs and charts, based on the type of data.
Head over to the BuddyPress Reports page to learn more about all the available reports.
LearnDash User Reports
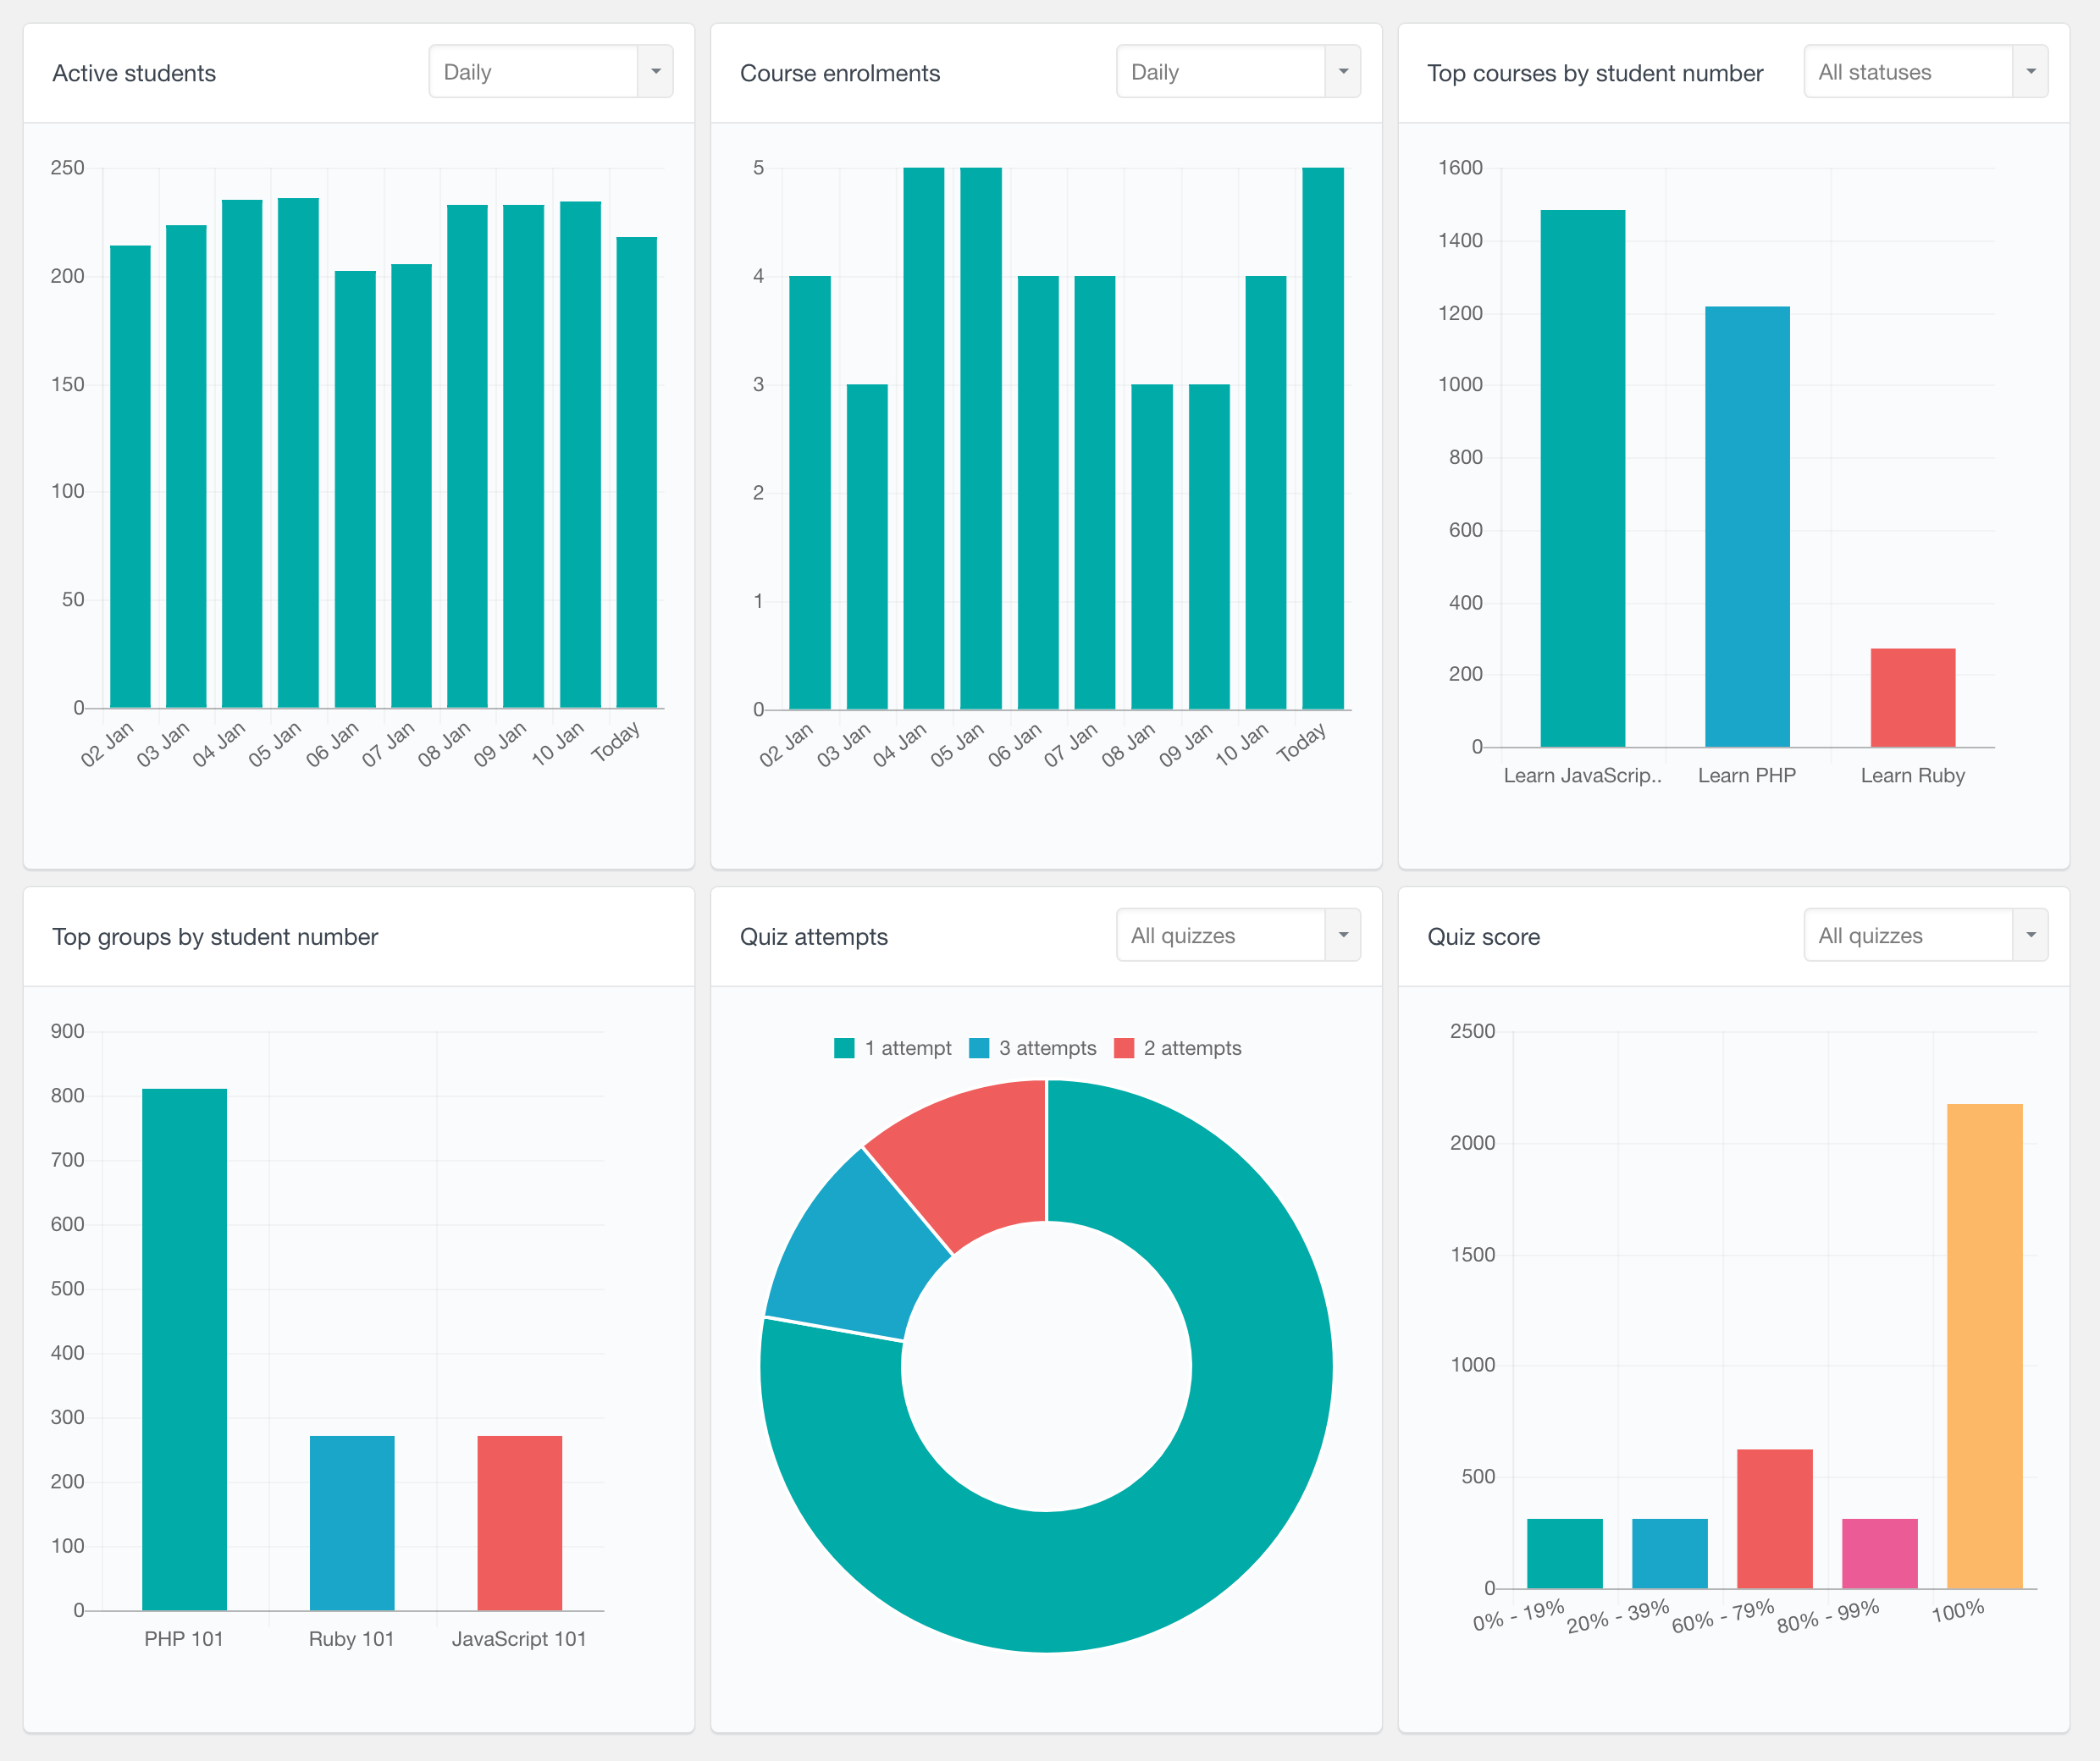
The LearnDash module of Users Insights comes with a set of user reports that can help you analyze your student activity and performance. The currently available LearnDash reports are:
- Active students – Activity report showing the number of active students presented in daily, weekly, monthly and yearly periods
- Course enrolments – number of course enrolments presented in daily, weekly, monthly and yearly periods
- Top courses by number of students – can be further filtered by their status, such as “Completed” and “In Progress”
- Top groups by student number
- Quiz attempts – number of attempts for all quizzes, with colors visualizing passes vs fails (also available for a selected quiz)
- Quiz attempts distribution – a pie chart showing how many attempts users need to pass a quiz. This report can be very useful to assess the quiz difficulty level. It can be filtered to show the attempts for a selected quiz only.
- Quiz score – a bar chart showing how many students pass a quiz for each percentage range. This report can also be used to check how difficult the students find each quiz.
Head over to the LearnDash Reports page to learn more about all the available LMS reports.
LearnDash Quiz Reports
The Users Insights plugin also provides a set of quiz-specific reports, allowing you to analyze the activity and student performance for a selected quiz only. These reports include:
- Number of attempts – attempts over time, visualizing passes vs fails in different colors
- Quiz score – distribution of quiz scores of students
- Most correctly answered questions
- Most incorrectly answered questions
- Time spent on quiz
- Quiz attempts distribution – it can help you understand how many attempts students usually make
To learn more visit the LearnDash Quiz Reports page.
LearnDash Course Reports
Another part of the LearnDash integration is the Course Reports section, which allows you to select a course and explore various reports for this course, including:
- Number of active students over time
- Number of students started course over time
- Number of students completed course over time
- Time to complete course
- Student progress breakdown – in progress vs completed with option to filter by time periods
For more information, head over to the LearnDash Course Reports page.
MemberPress Reports
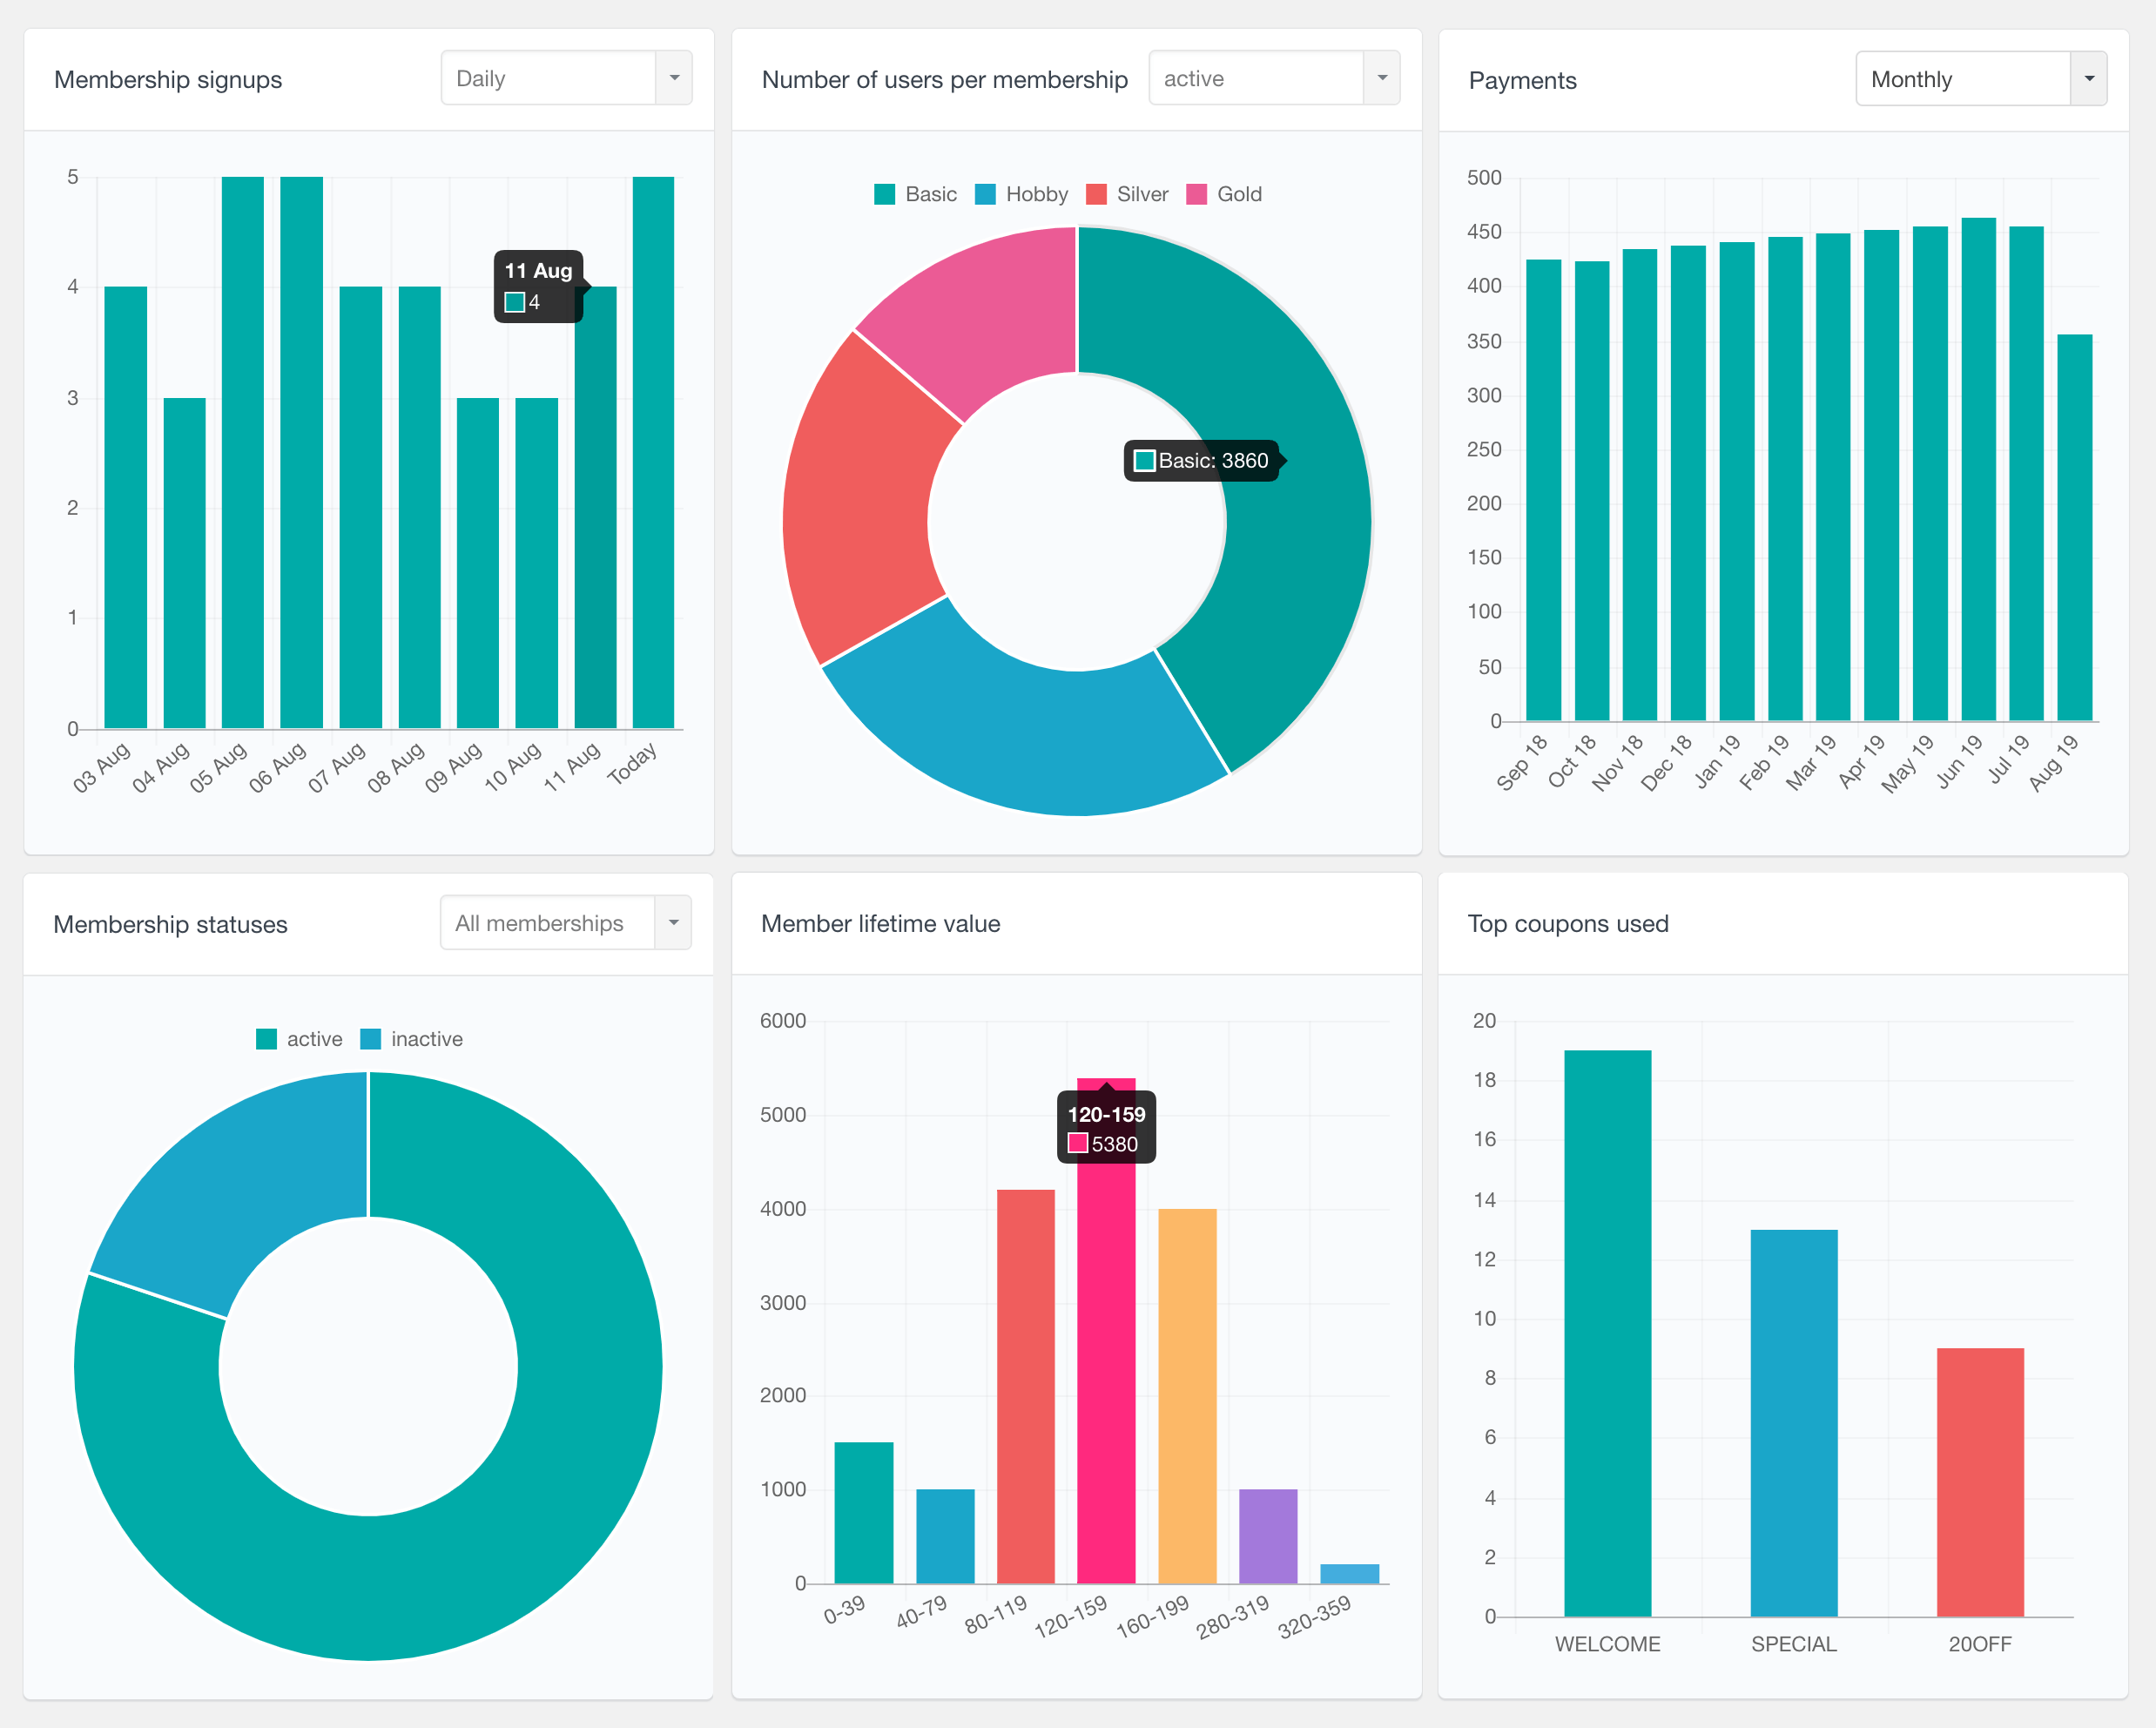
The MemberPress integration provides various reports that can help you analyze your memberships activity. These reports can help you better understand things like how each of your membership products is performing or how many new signups there are every day. Here is a list of all of the available charts:
- Number of new membership signups over time
- Number of payments over time
- Total amount of payments received over time
- Number of ended memberships over time
- Number of users per membership
- Membership statuses
- Member lifetime value
- Top coupons used
All of these reports are described in more detail on the MemberPress Reports page.
Easy Digital Downloads (EDD) Reports
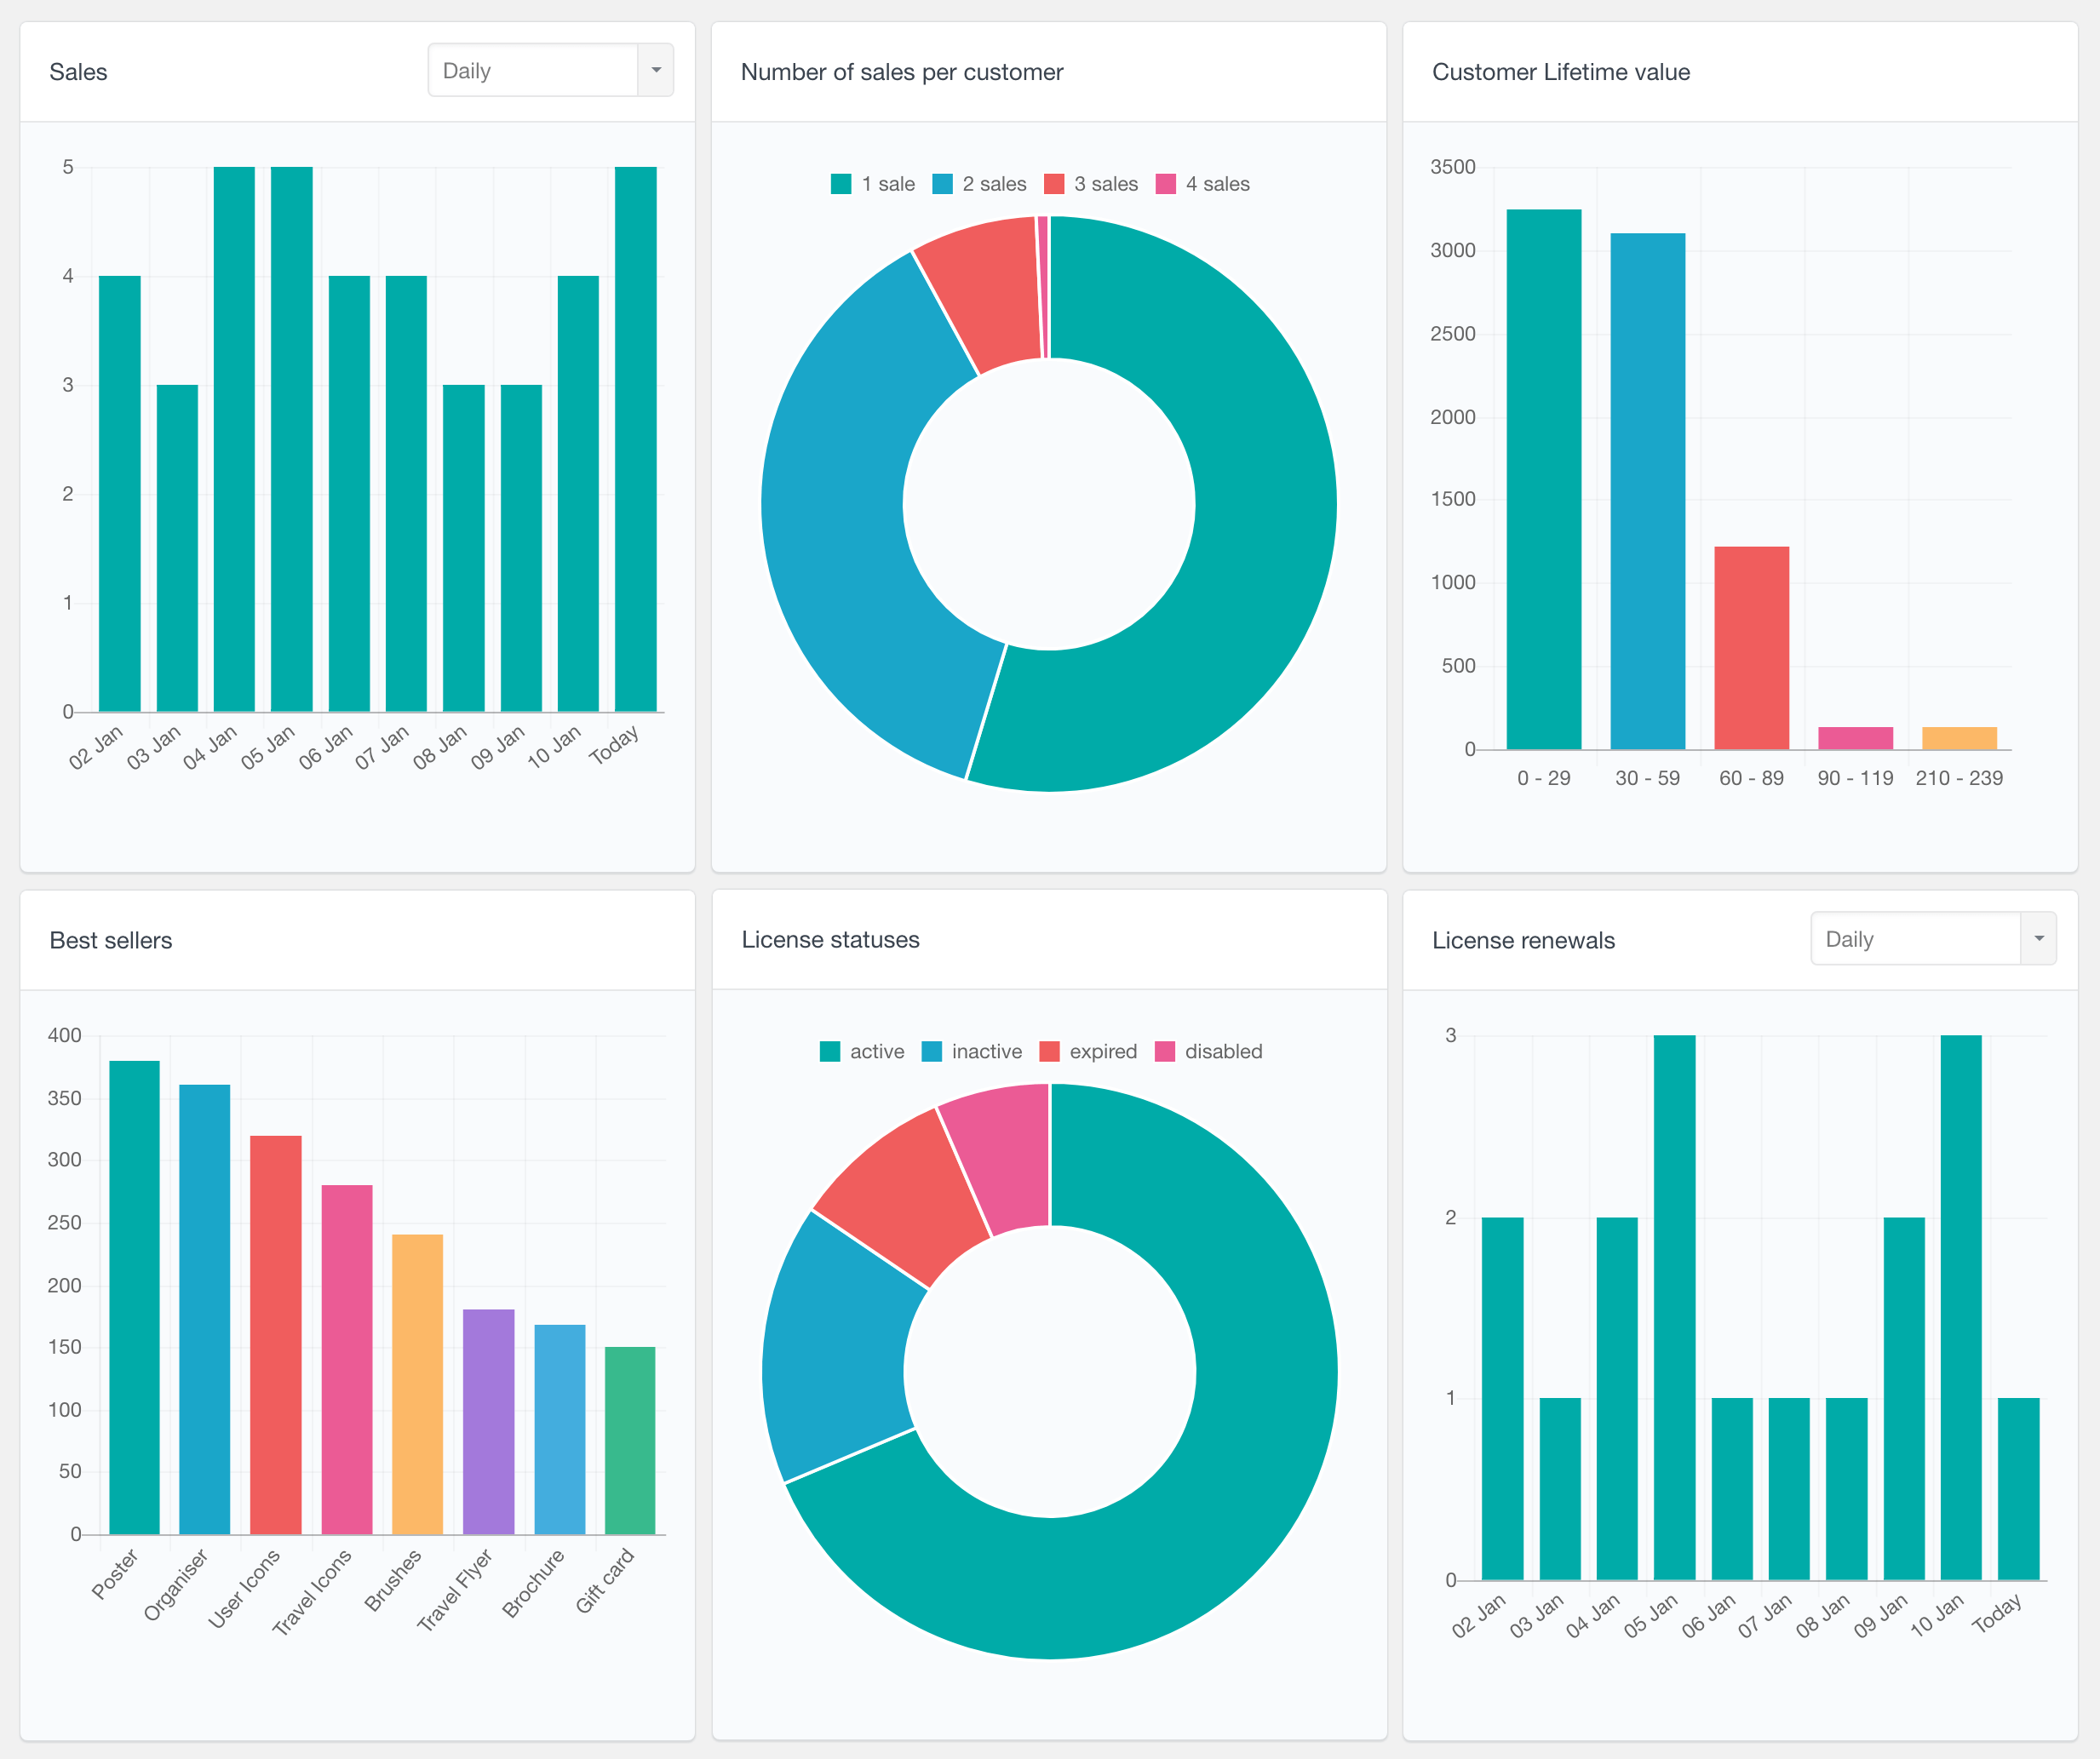
If you use the Easy Digital Downloads plugin for your e-commerce store, the Users Insights EDD reports can give you an insights of your store’s performance. The following reports are available for the EDD plugin:
- Sales – number of sales in daily, weekly, monthly and yearly periods
- New customers – number of new customers in daily, weekly, monthly and yearly periods
- Number of sales per customer – a pie chart showing how many users have made 1, 2 and more sales
- Order statuses pie chart
- Customer lifetime value – a bar chart visualizing the customer lifetime value ranges
- Best sellers
Additionally, if you are using the Software Licensing add-on, the following reports are also available:
- License statuses – a pie chart visualizing the license statuses
- License renewals – a bar graph showing the license renewals over time (daily, weekly, monthly and yearly periods)
To learn more, you can visit the Easy Digital Downloads Reports page.
Paid Memberships Pro Reports
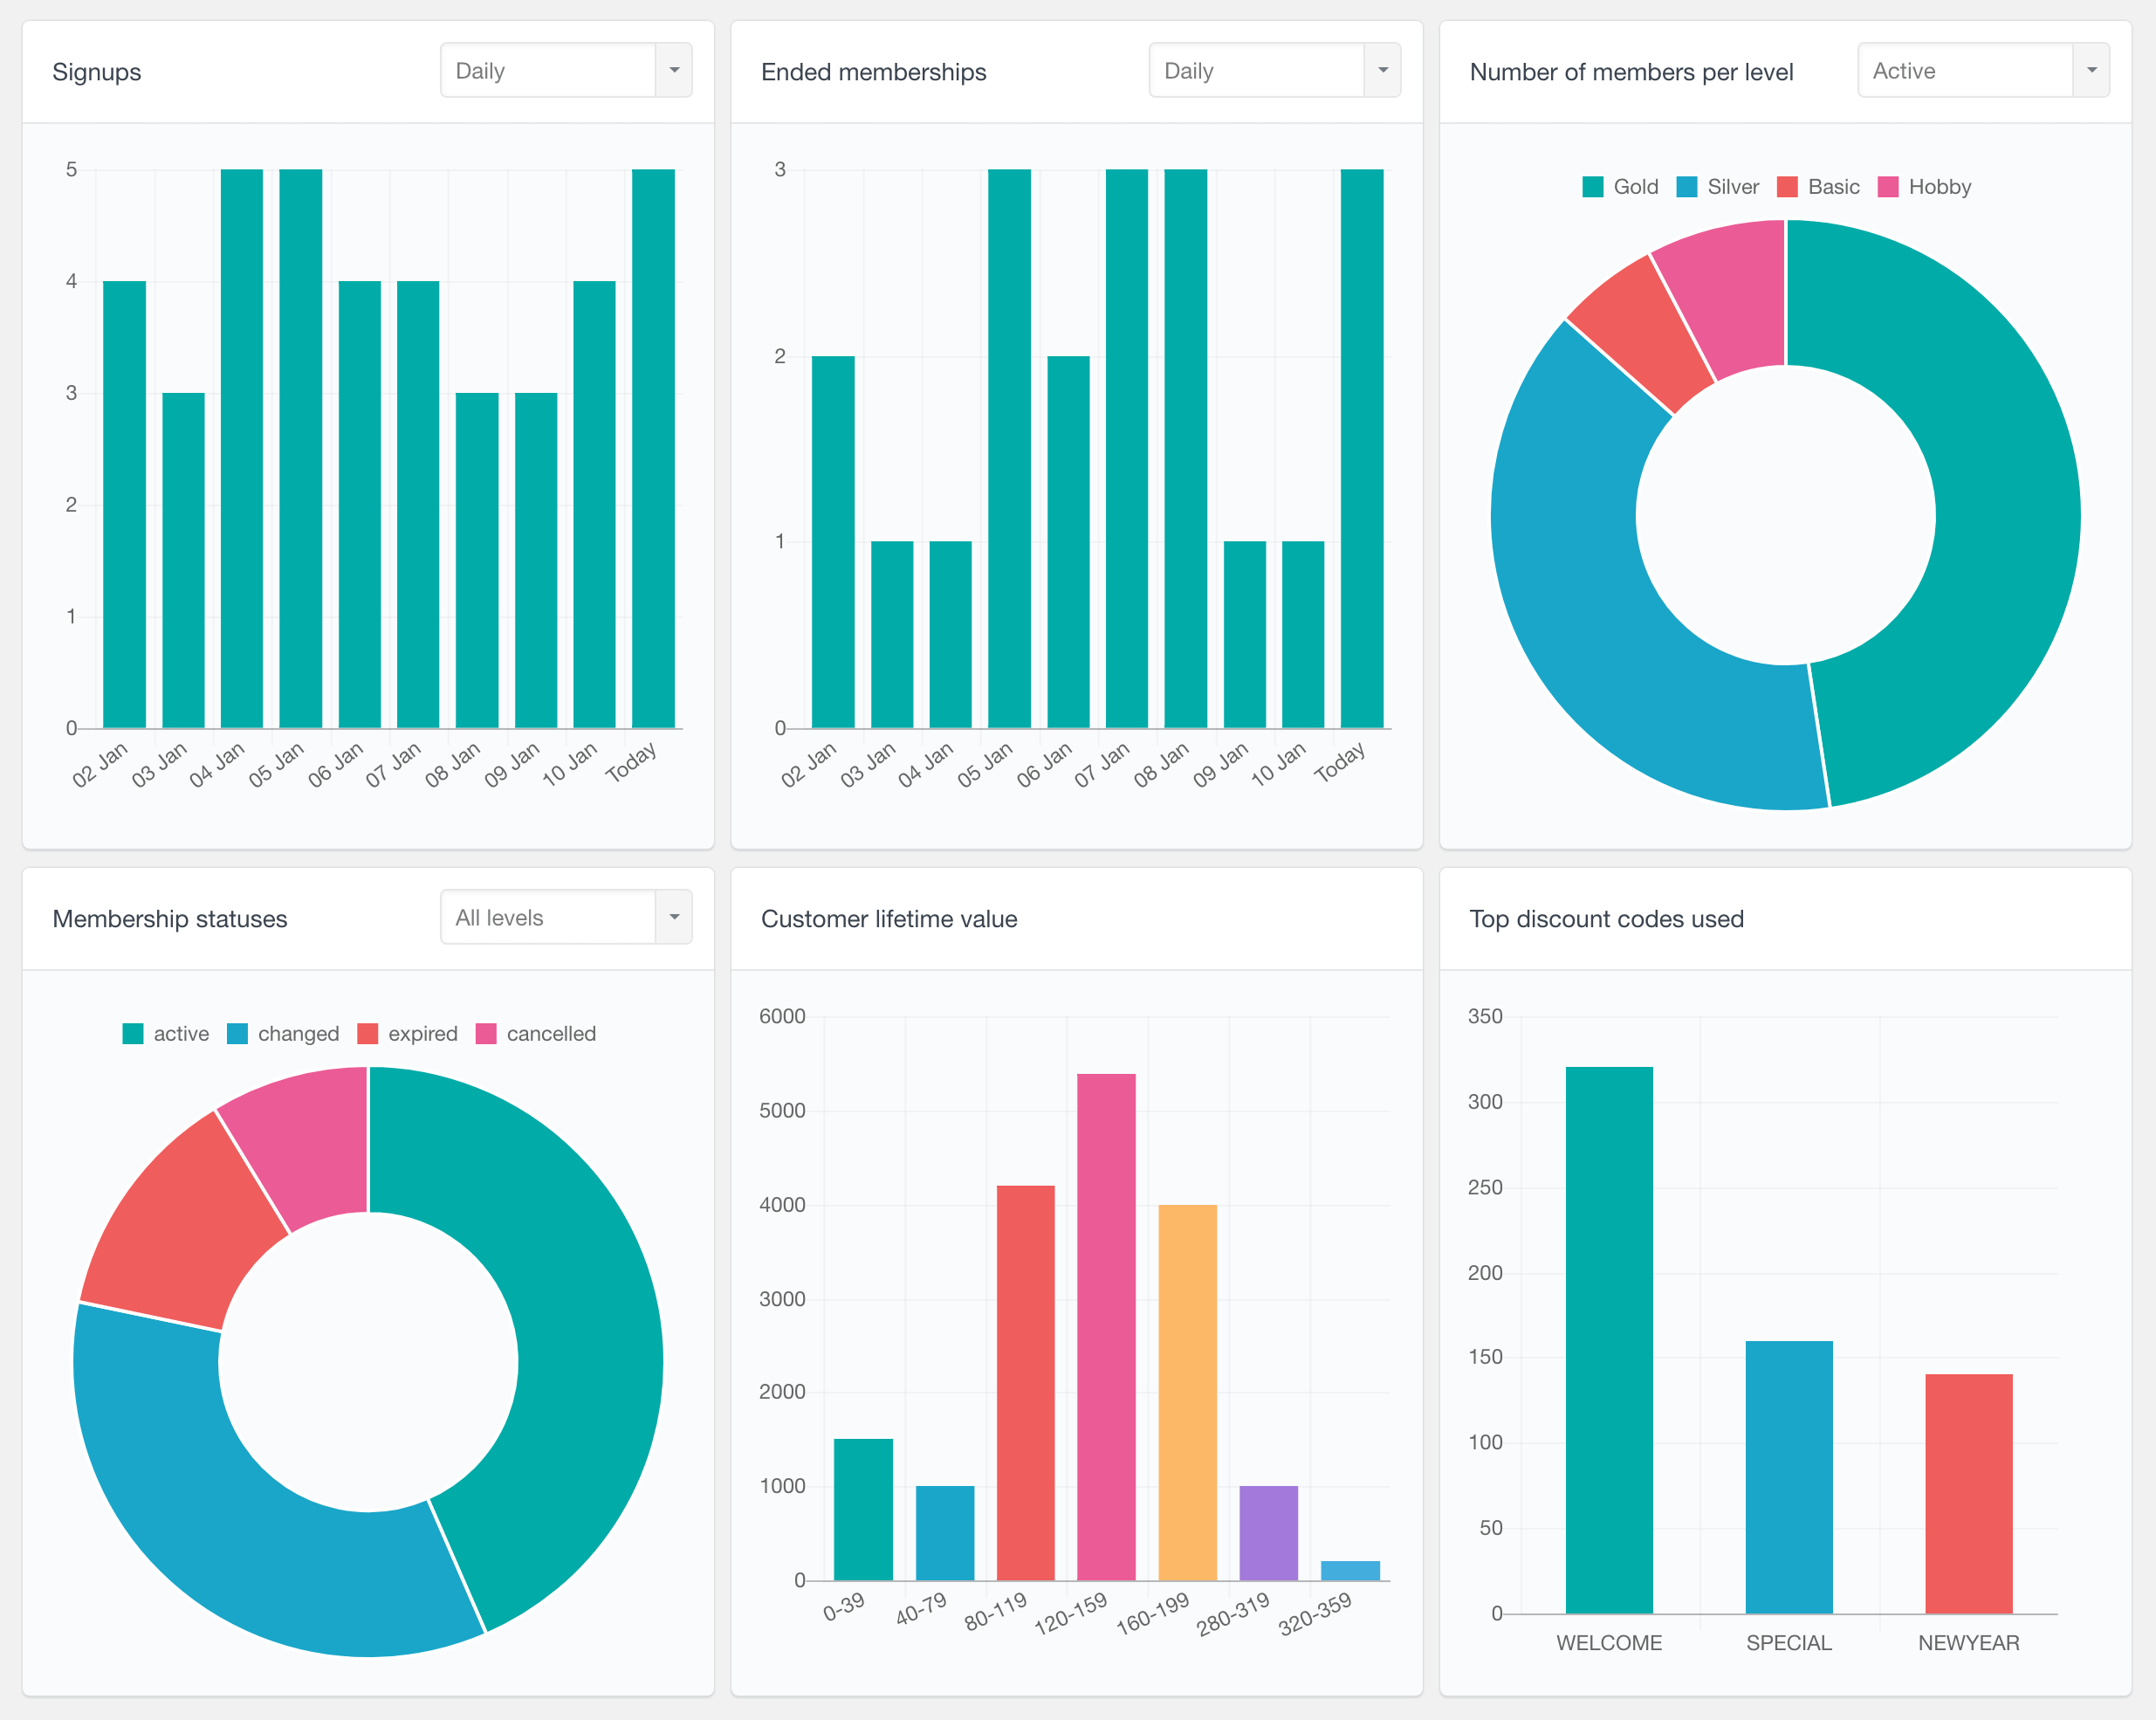
The Paid Memberships Pro integration include various reports that can help you understand your membership website performance. It can help you analyze some of the most important metrics, such as your members growth, plans performance and customer lifetime value. Here is a list of the currently available reports:
- Signups – shows the number of signups for the last several days, weeks, months or years
- Payments and Payments total – time based reports showing the number of payments and the total amount respectively
- Ended memberships – number of cancelled or expired memberships over time
- Number of members per level – can be filtered by the membership status
- Membership statuses – can be filtered by the membership level
- Customer lifetime value
- Top billing countries, states and cities
- Top discount codes used
To learn more, head over to the Paid Memberships Pro Reports page.
Profile Builder Pro Reports
The Profile Builder Pro reports can help you visualize the data that your users submit in their profiles. Users Insights detects the profile fields from that are registered with the WordPress plugin and automatically generates reports for the ones that can be visually presented. For example, radio fields data is displayed with pie charts and number fields data is displayed in ranges on a bar chart. You can learn more on the Profile Builder Pro Reports page.