The LearnDash Quiz Reports feature of Users Insights provides a detailed quiz statistics and activity overview for a selected quiz. It includes various reports that can help you analyze your quiz activity, such as the number of attempts with passes vs. fails, question difficulty, and the average time it takes the students to take the quiz. All of the quiz reports represent registered WordPress user activity.
The Quiz Reports is part of the Users Insights LearnDash tools, which include:
- LearnDash Quiz Reports (covered on this page)
- General LearnDash reports
- LearnDash course reports
- LearnDash user table, filters, and profiles
The LearnDash Quiz Reports section can be accessed from the WordPress Dashboard > Users Insights > Reports > LearnDash Quizzes section.
This page allows you to select one of the available quizzes on your LMS platform:
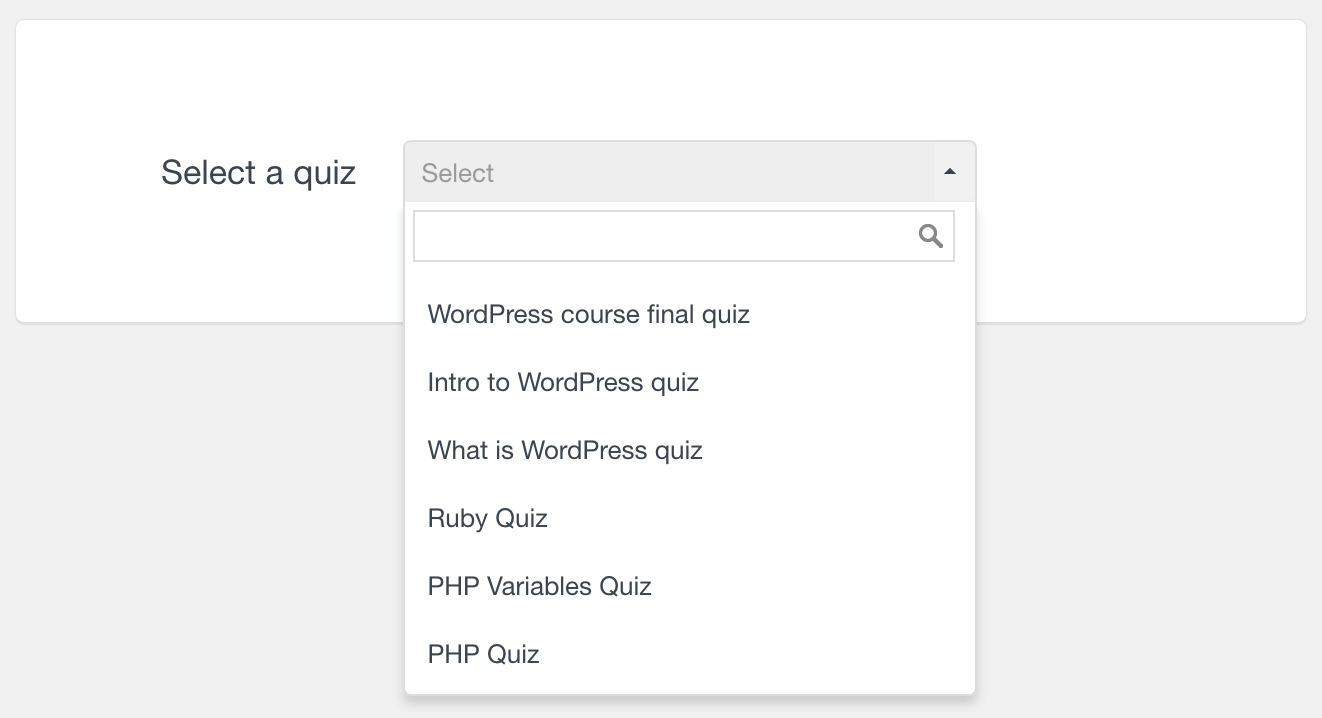
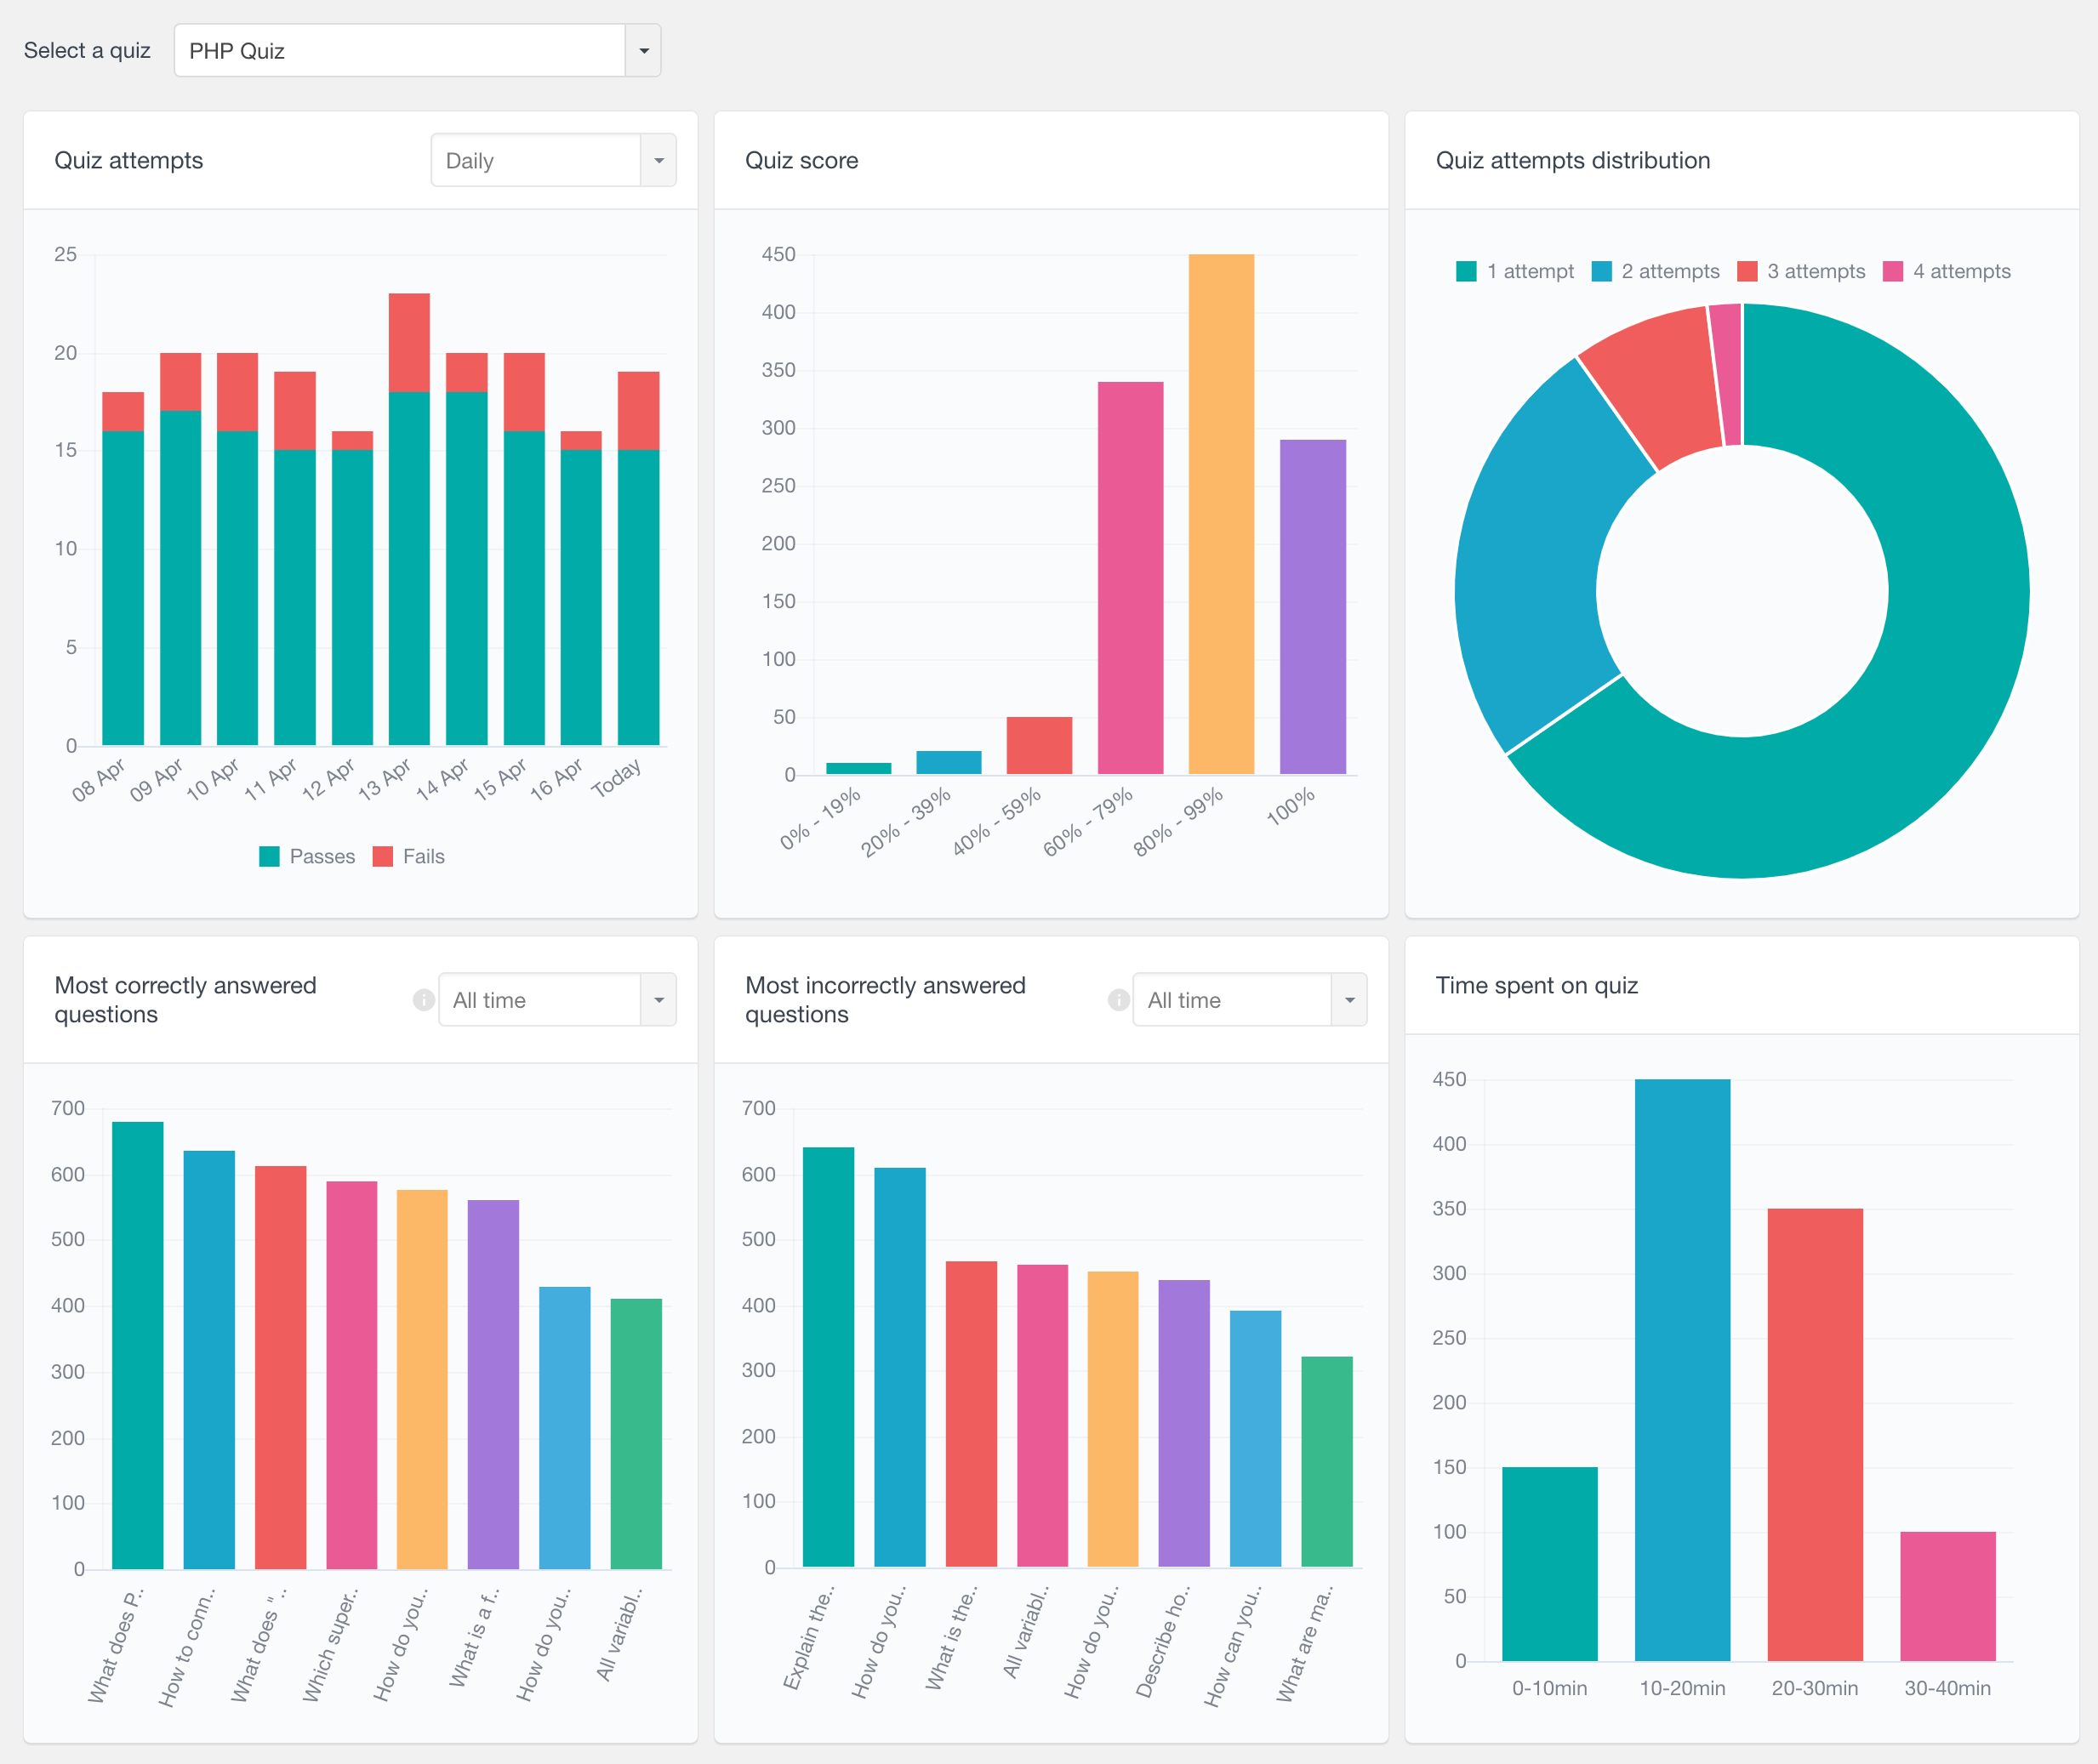
Once you do that, a range of quiz performance reports will be displayed on the page:
LearnDash Quiz Attempts Report
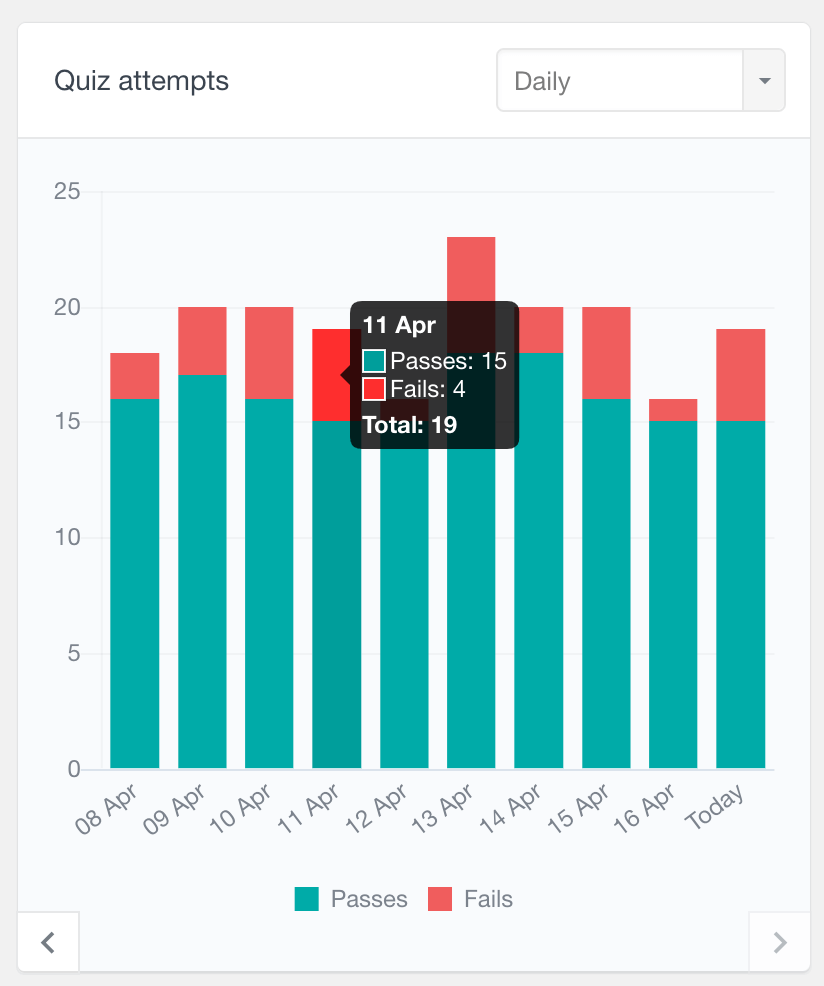
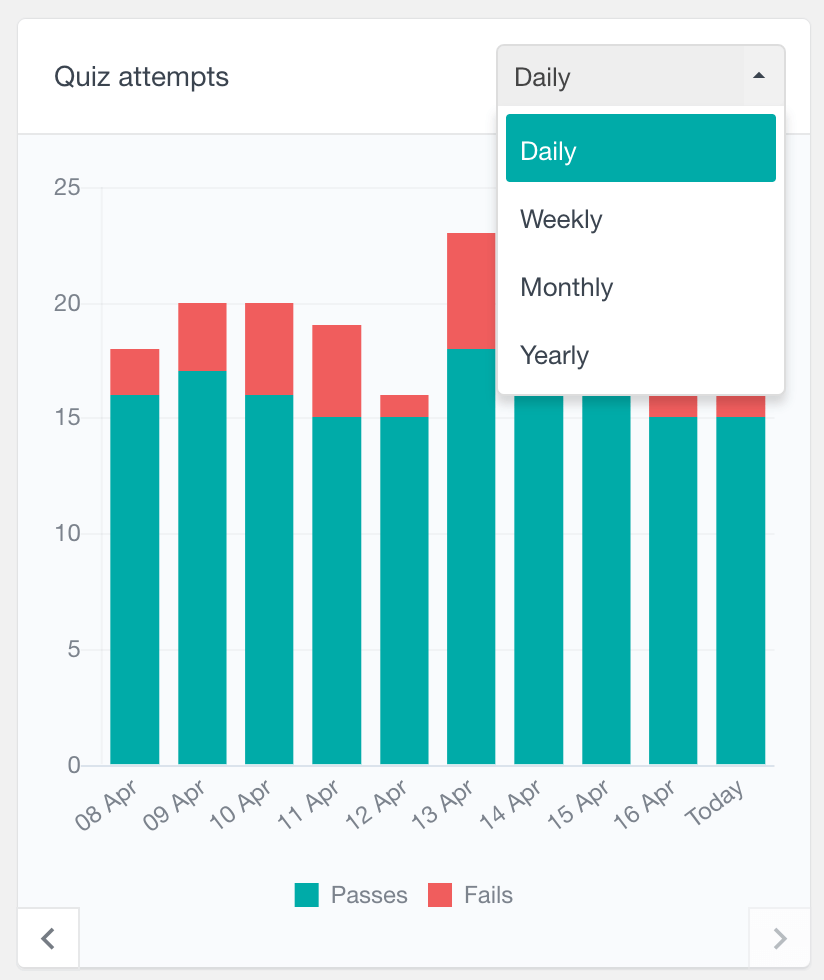
The Quiz Attempts Report for a selected quiz provides an overview of the number of attempts made over time, segmented by color to distinguish between passes (green) and fails (red). This is a periodic report, which means that it is available for daily, weekly, monthly, and yearly periods, and you have the option to scroll back through historical data. The visual distinction between passes and fails can help you quickly identify quiz effectiveness and areas needing improvement.
LearnDash Quiz Attempts Distribution Report
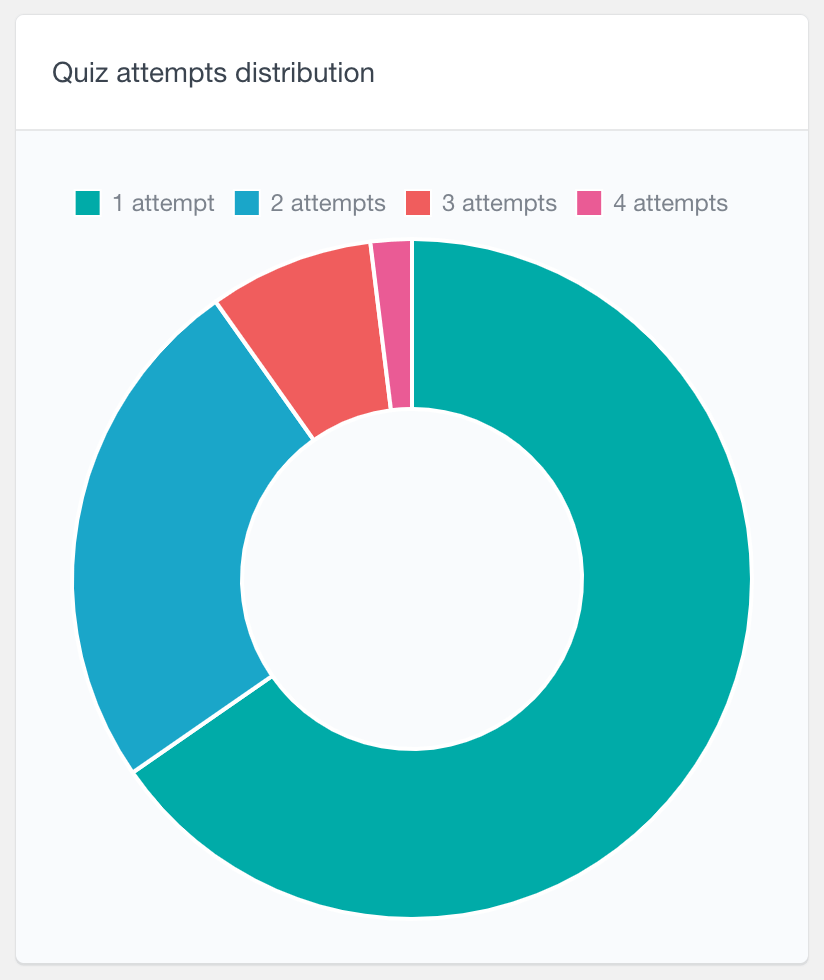
Another report that can help you analyze the LearnDash quiz attempts is the Quiz Attempts Distribution Report. This report features a pie chart that shows the distribution of quiz attempts made by students. Each slice of the chart represents a different number of attempts, with the size of the slice indicating the number of students who made that many attempts. This visual representation can help you understand how many tries students typically need to complete the quiz.
LearnDash Quiz Score Report
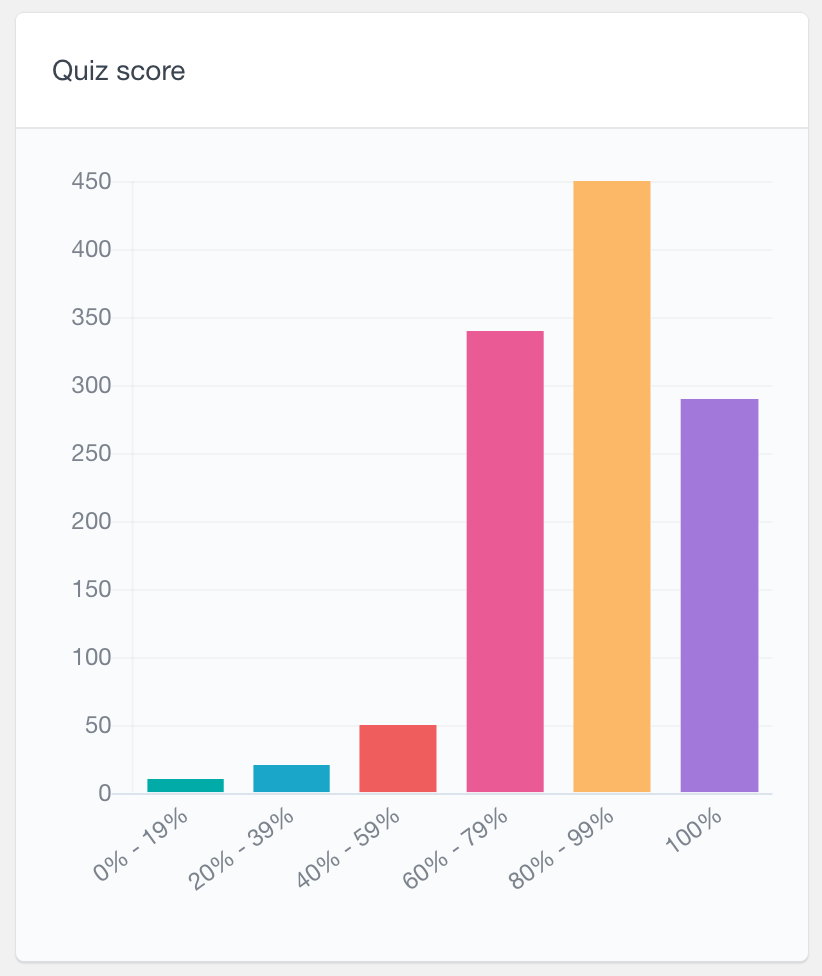
The LearnDash Quiz Score Report is a bar chart that visualizes the distribution of scores across all quiz attempts. Scores are grouped into different ranges, and each bar on the chart represents the number of attempts that fall into these score ranges.
This chart displays data for each individual attempt, including multiple attempts from the same user. For example, if a student initially scores 40% and fails, but scores 80% on a second attempt and passes, both attempts are recorded on the chart. This allows you to view not just the scores of successful attempts, but also those of the failed attempts. This report can be very helpful to understand the overall difficulty of the selected LearnDash quiz.
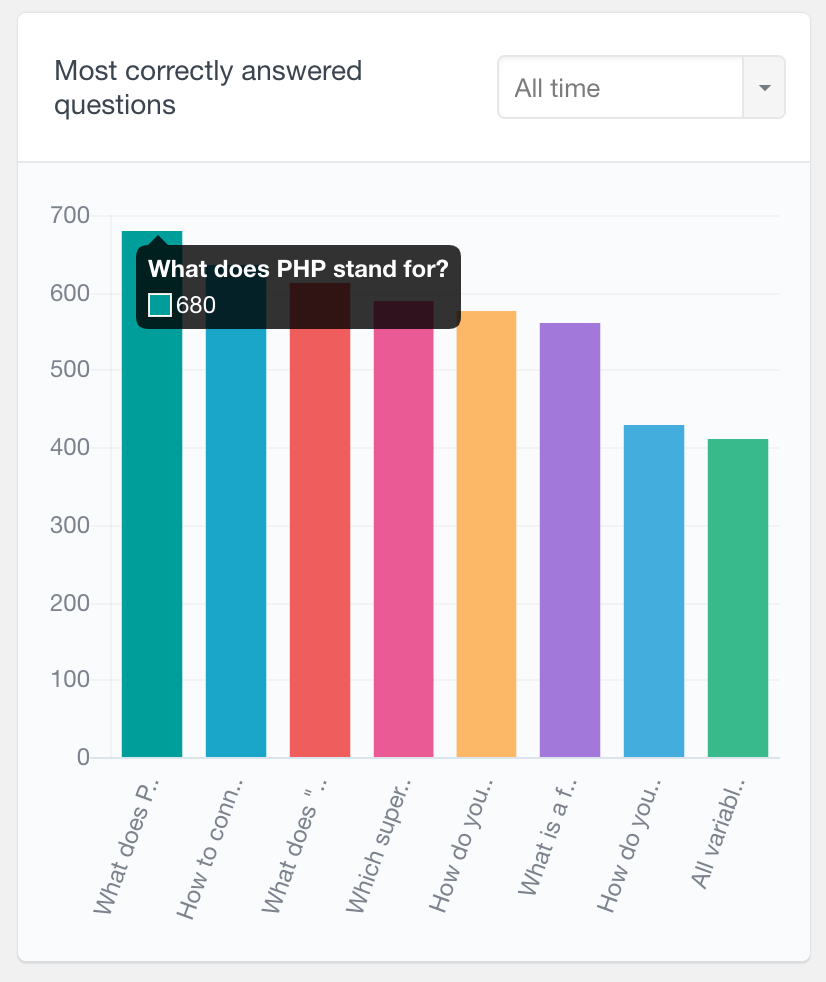
LearnDash Most Correctly Answered Questions Report
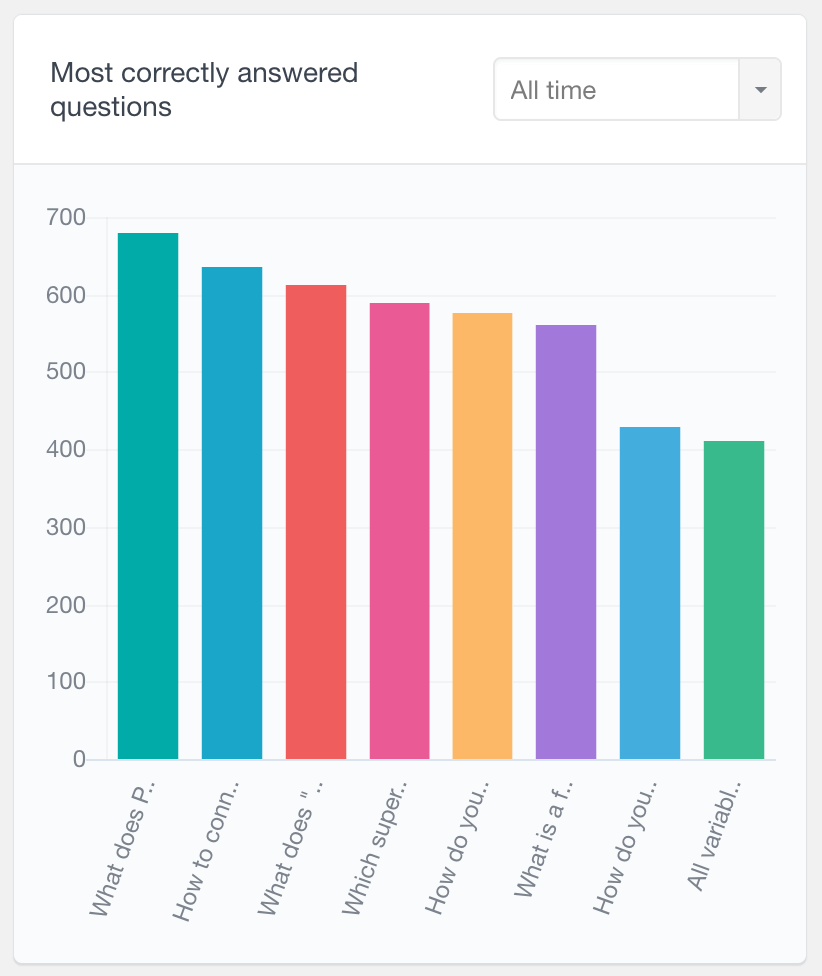
The LearnDash Most Correctly Answered Questions Report highlights the quiz questions that are most frequently answered correctly. It is visualized using a bar chart where each bar represents a question, and the size of the bar indicates the number of times the question has been answered correctly. By default, the report displays data from all time, but you can filter it to show data from more recent periods, such as the last 7 days, last 30 days, or even a custom period.
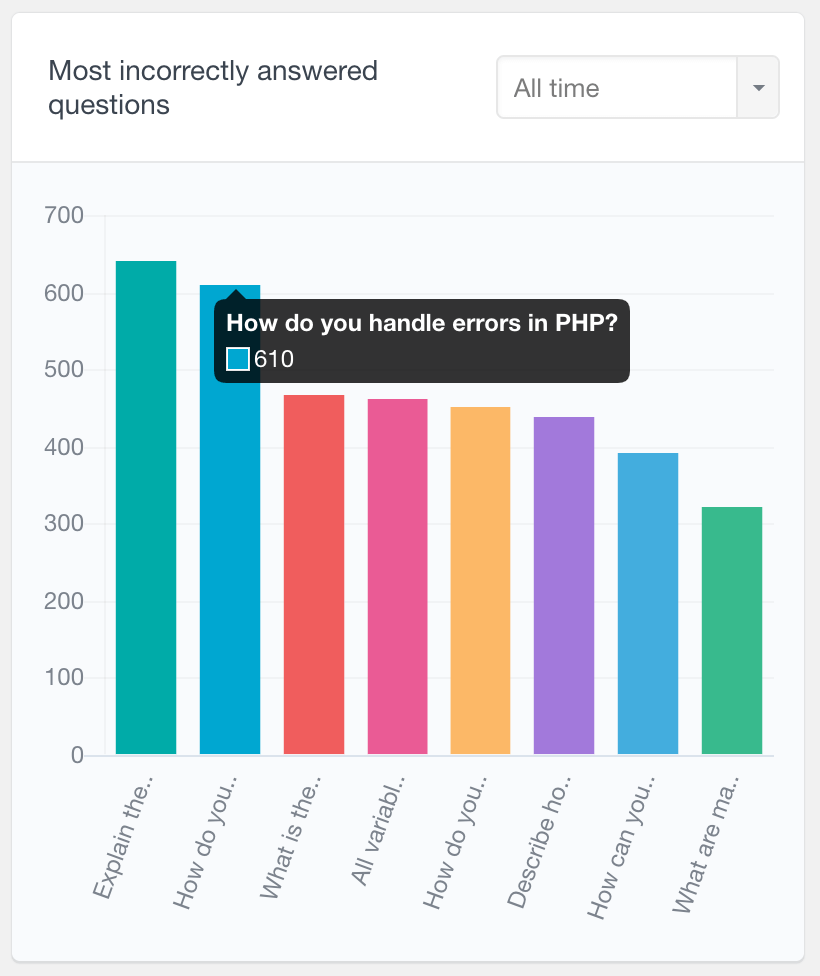
LearnDash Most Incorrectly Answered Questions Report
The LearnDash Most Incorrectly Answered Questions Report identifies the quiz questions that are most frequently answered incorrectly. Similarly, each bar in the chart represents a question and how many times it has been answered incorrectly. By default, this report displays all-time data, but you can also customize it to show data for specific periods. This information is particularly useful for identifying the most challenging questions, allowing you to assess the difficulty level of your material and make necessary adjustments.
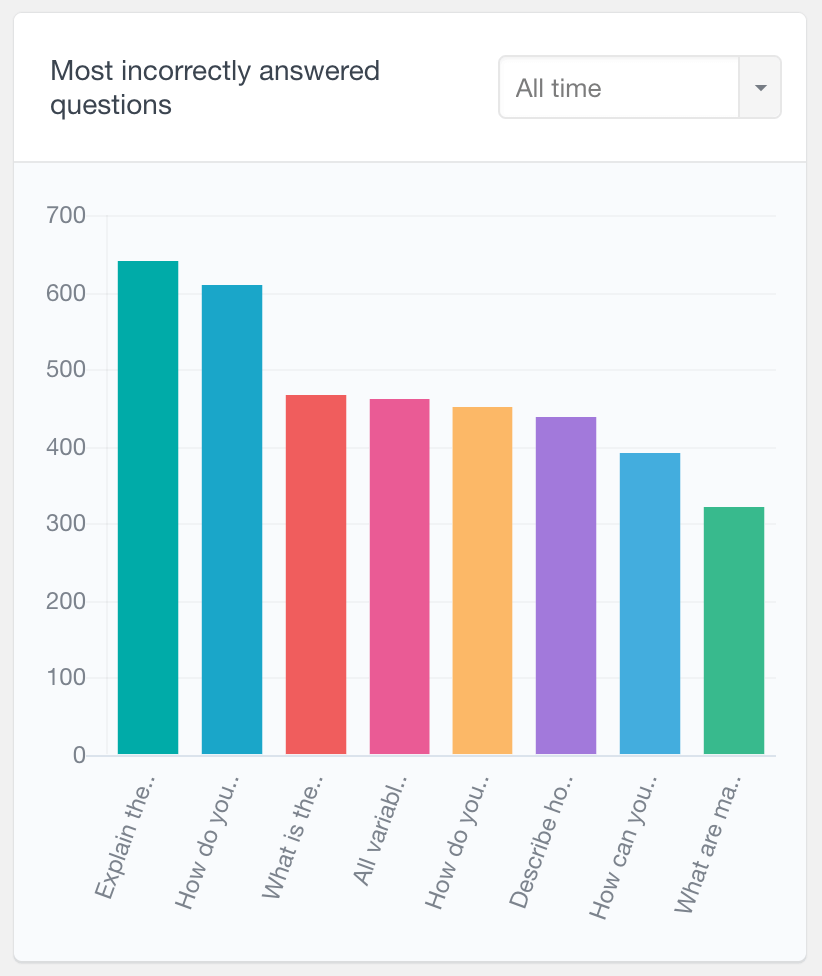
Please note that if you edit quiz questions, LearnDash may reset the statistics for those questions, treating the modified question as a new entry in the most correctly/incorrectly answered questions reports.
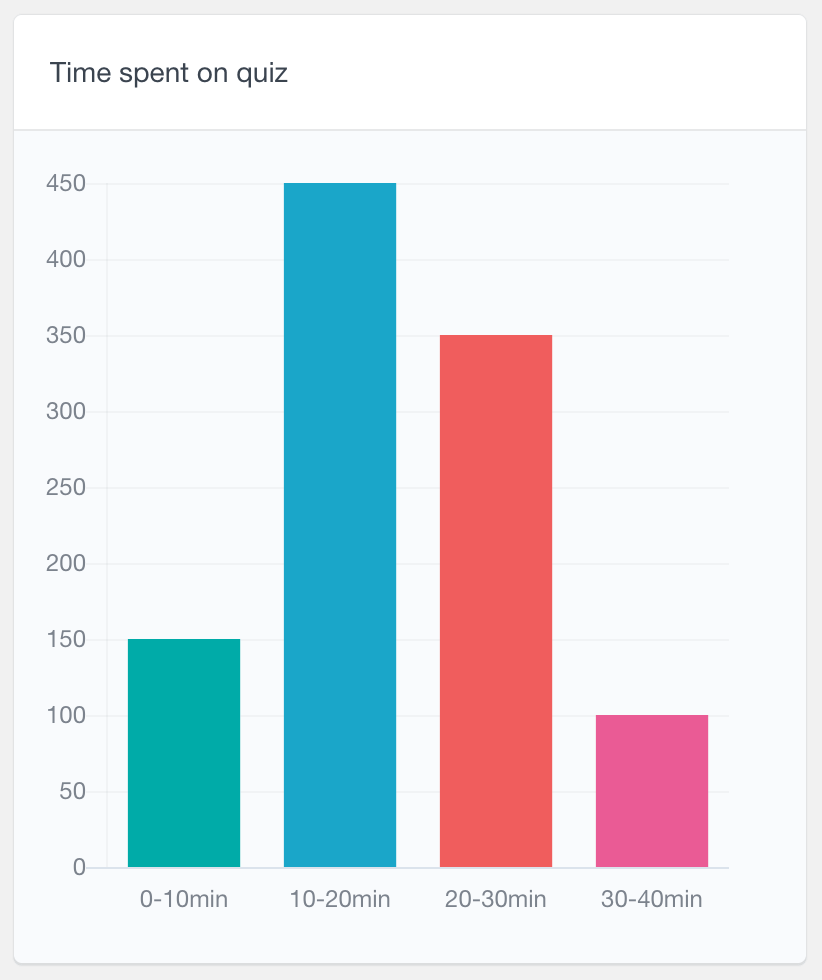
LearnDash Time Spent on Quiz Report
The LearnDash Time Spent on Quiz Report shows the average time students take to complete a quiz, presented as a distribution chart. The data is grouped into ranges, each representing a different interval of minutes. This report is useful for understanding how long students typically spend on quizzes, helping you identify if the quizzes are too lengthy or complex.
More Reports For LearnDash
In addition to the LearnDash quiz reports outlined on this page, the Users Insights plugin also offers a range of other LearnDash reporting tools:
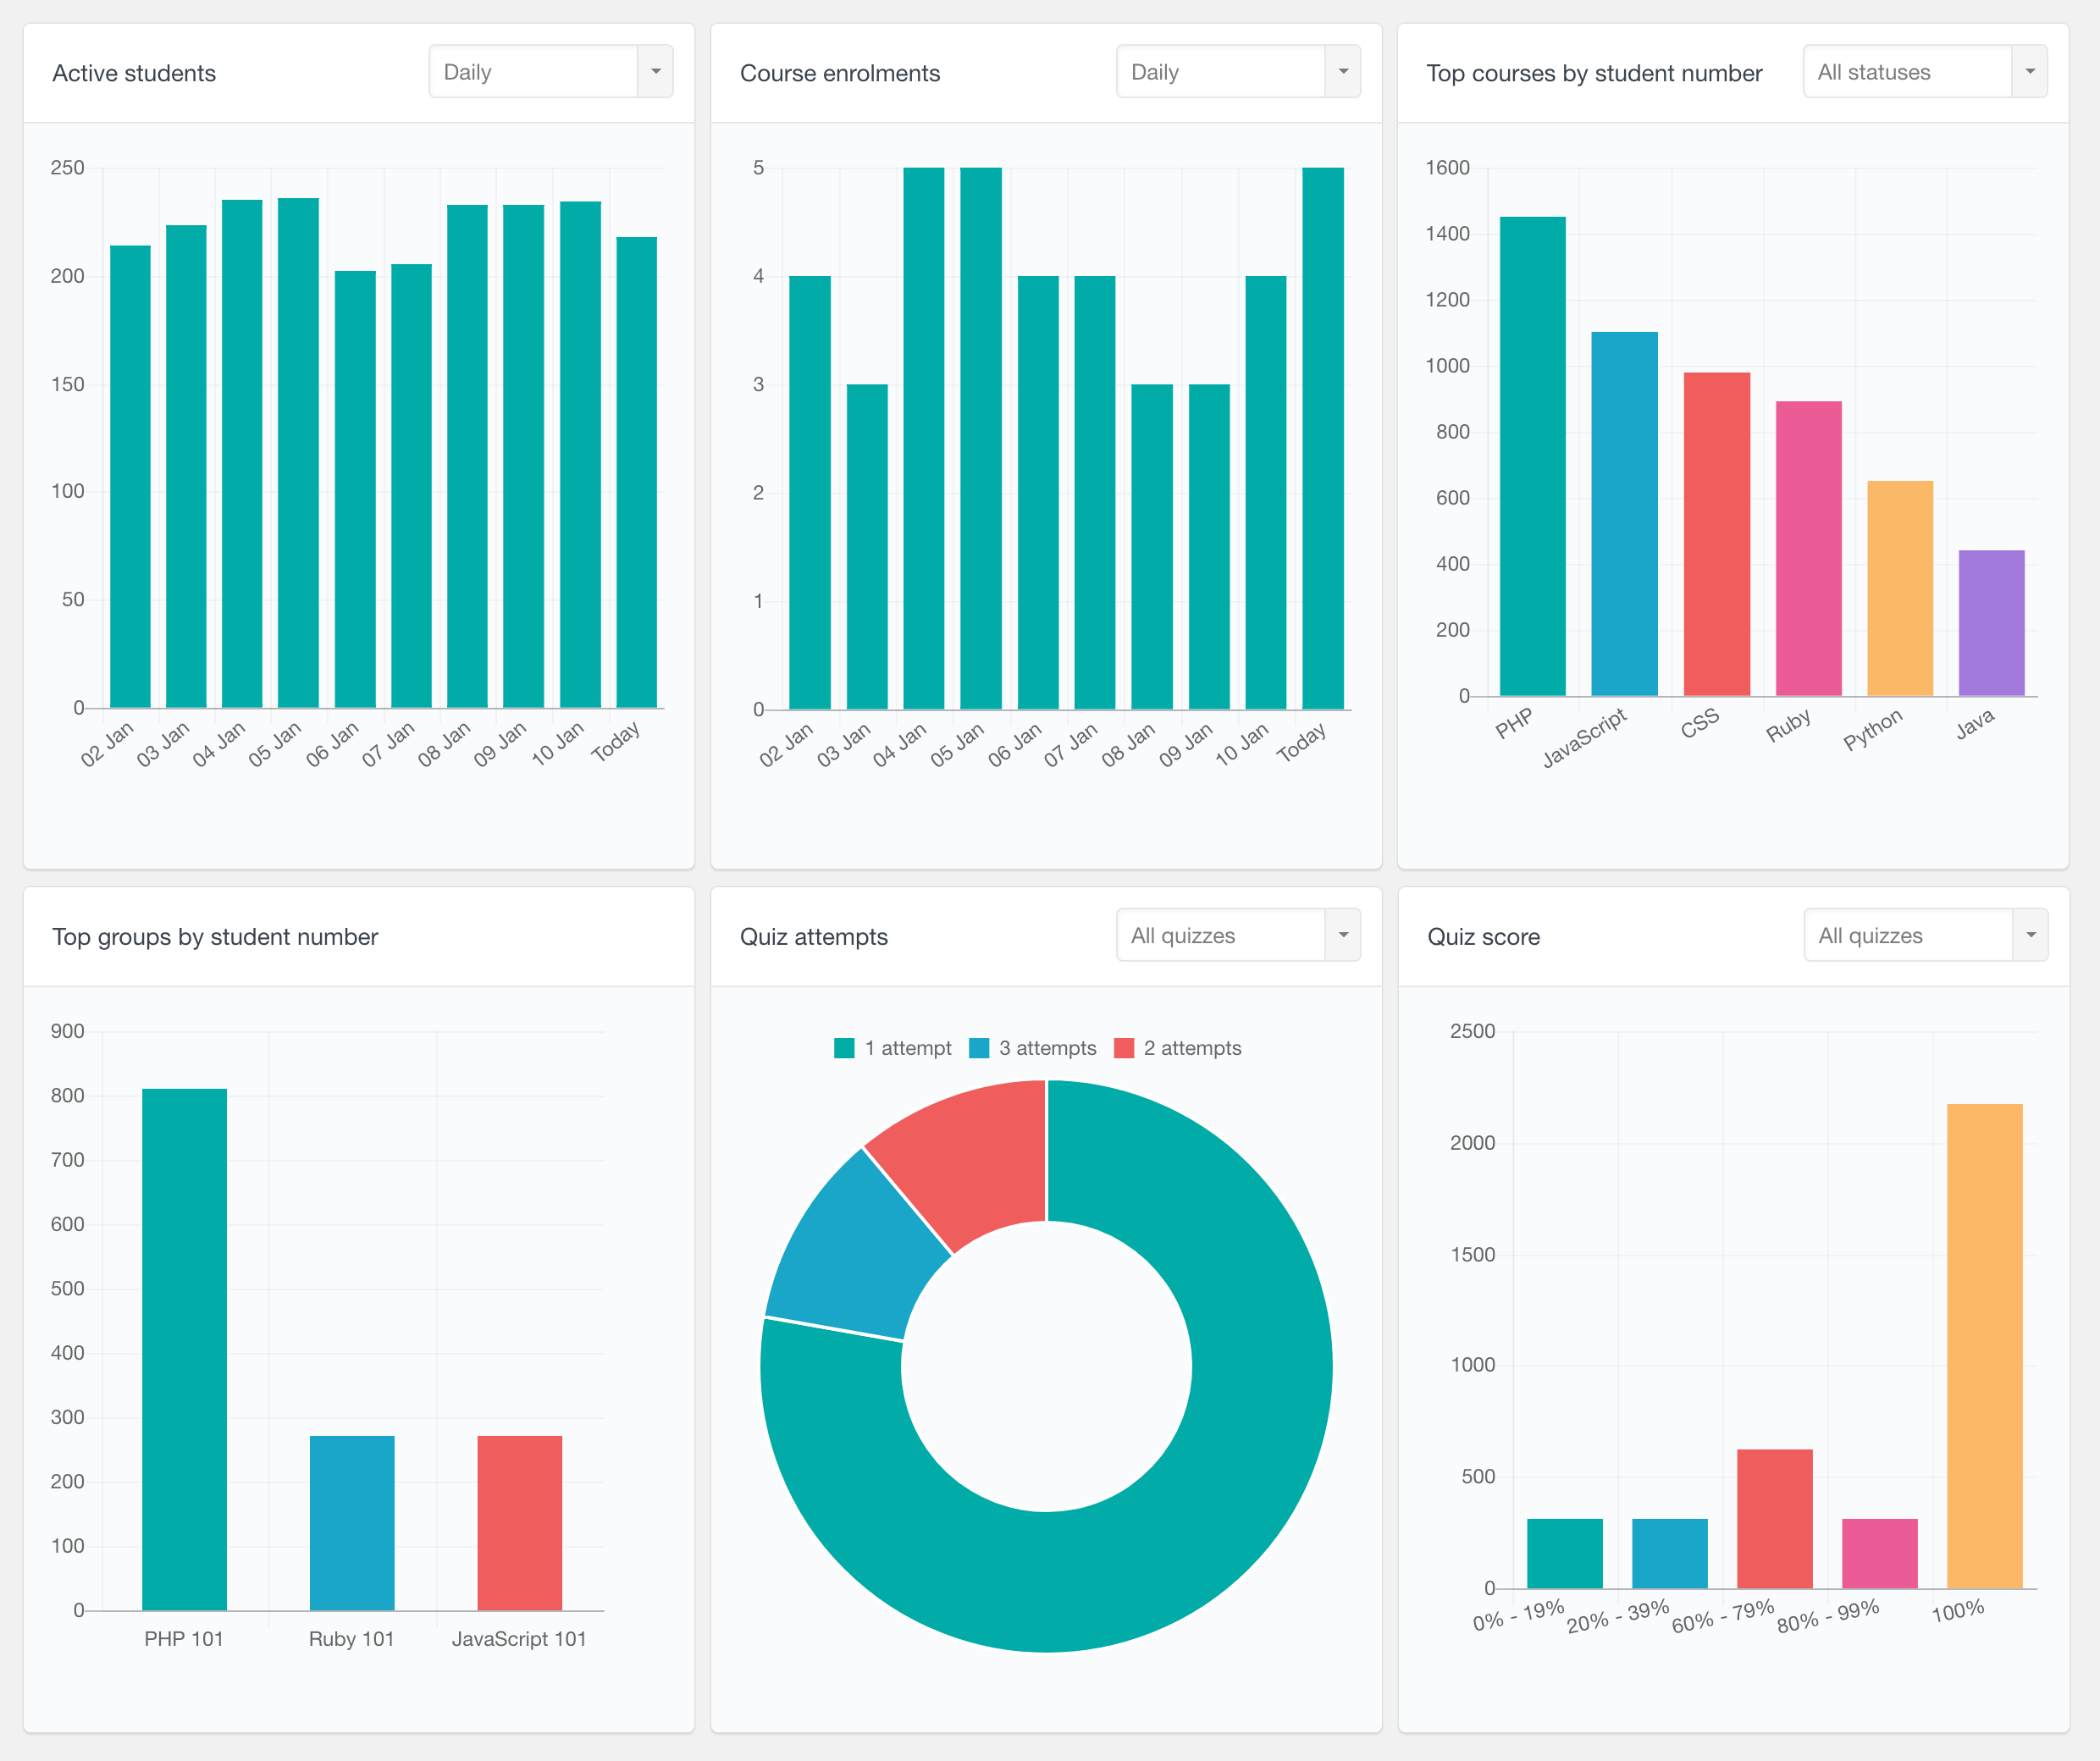
General LearnDash Reports
Includes general student activity reports for LearnDash, highlighting the most popular courses, top groups, and overall activity throughout all courses and quizzes. Read more on the LearnDash reports page.
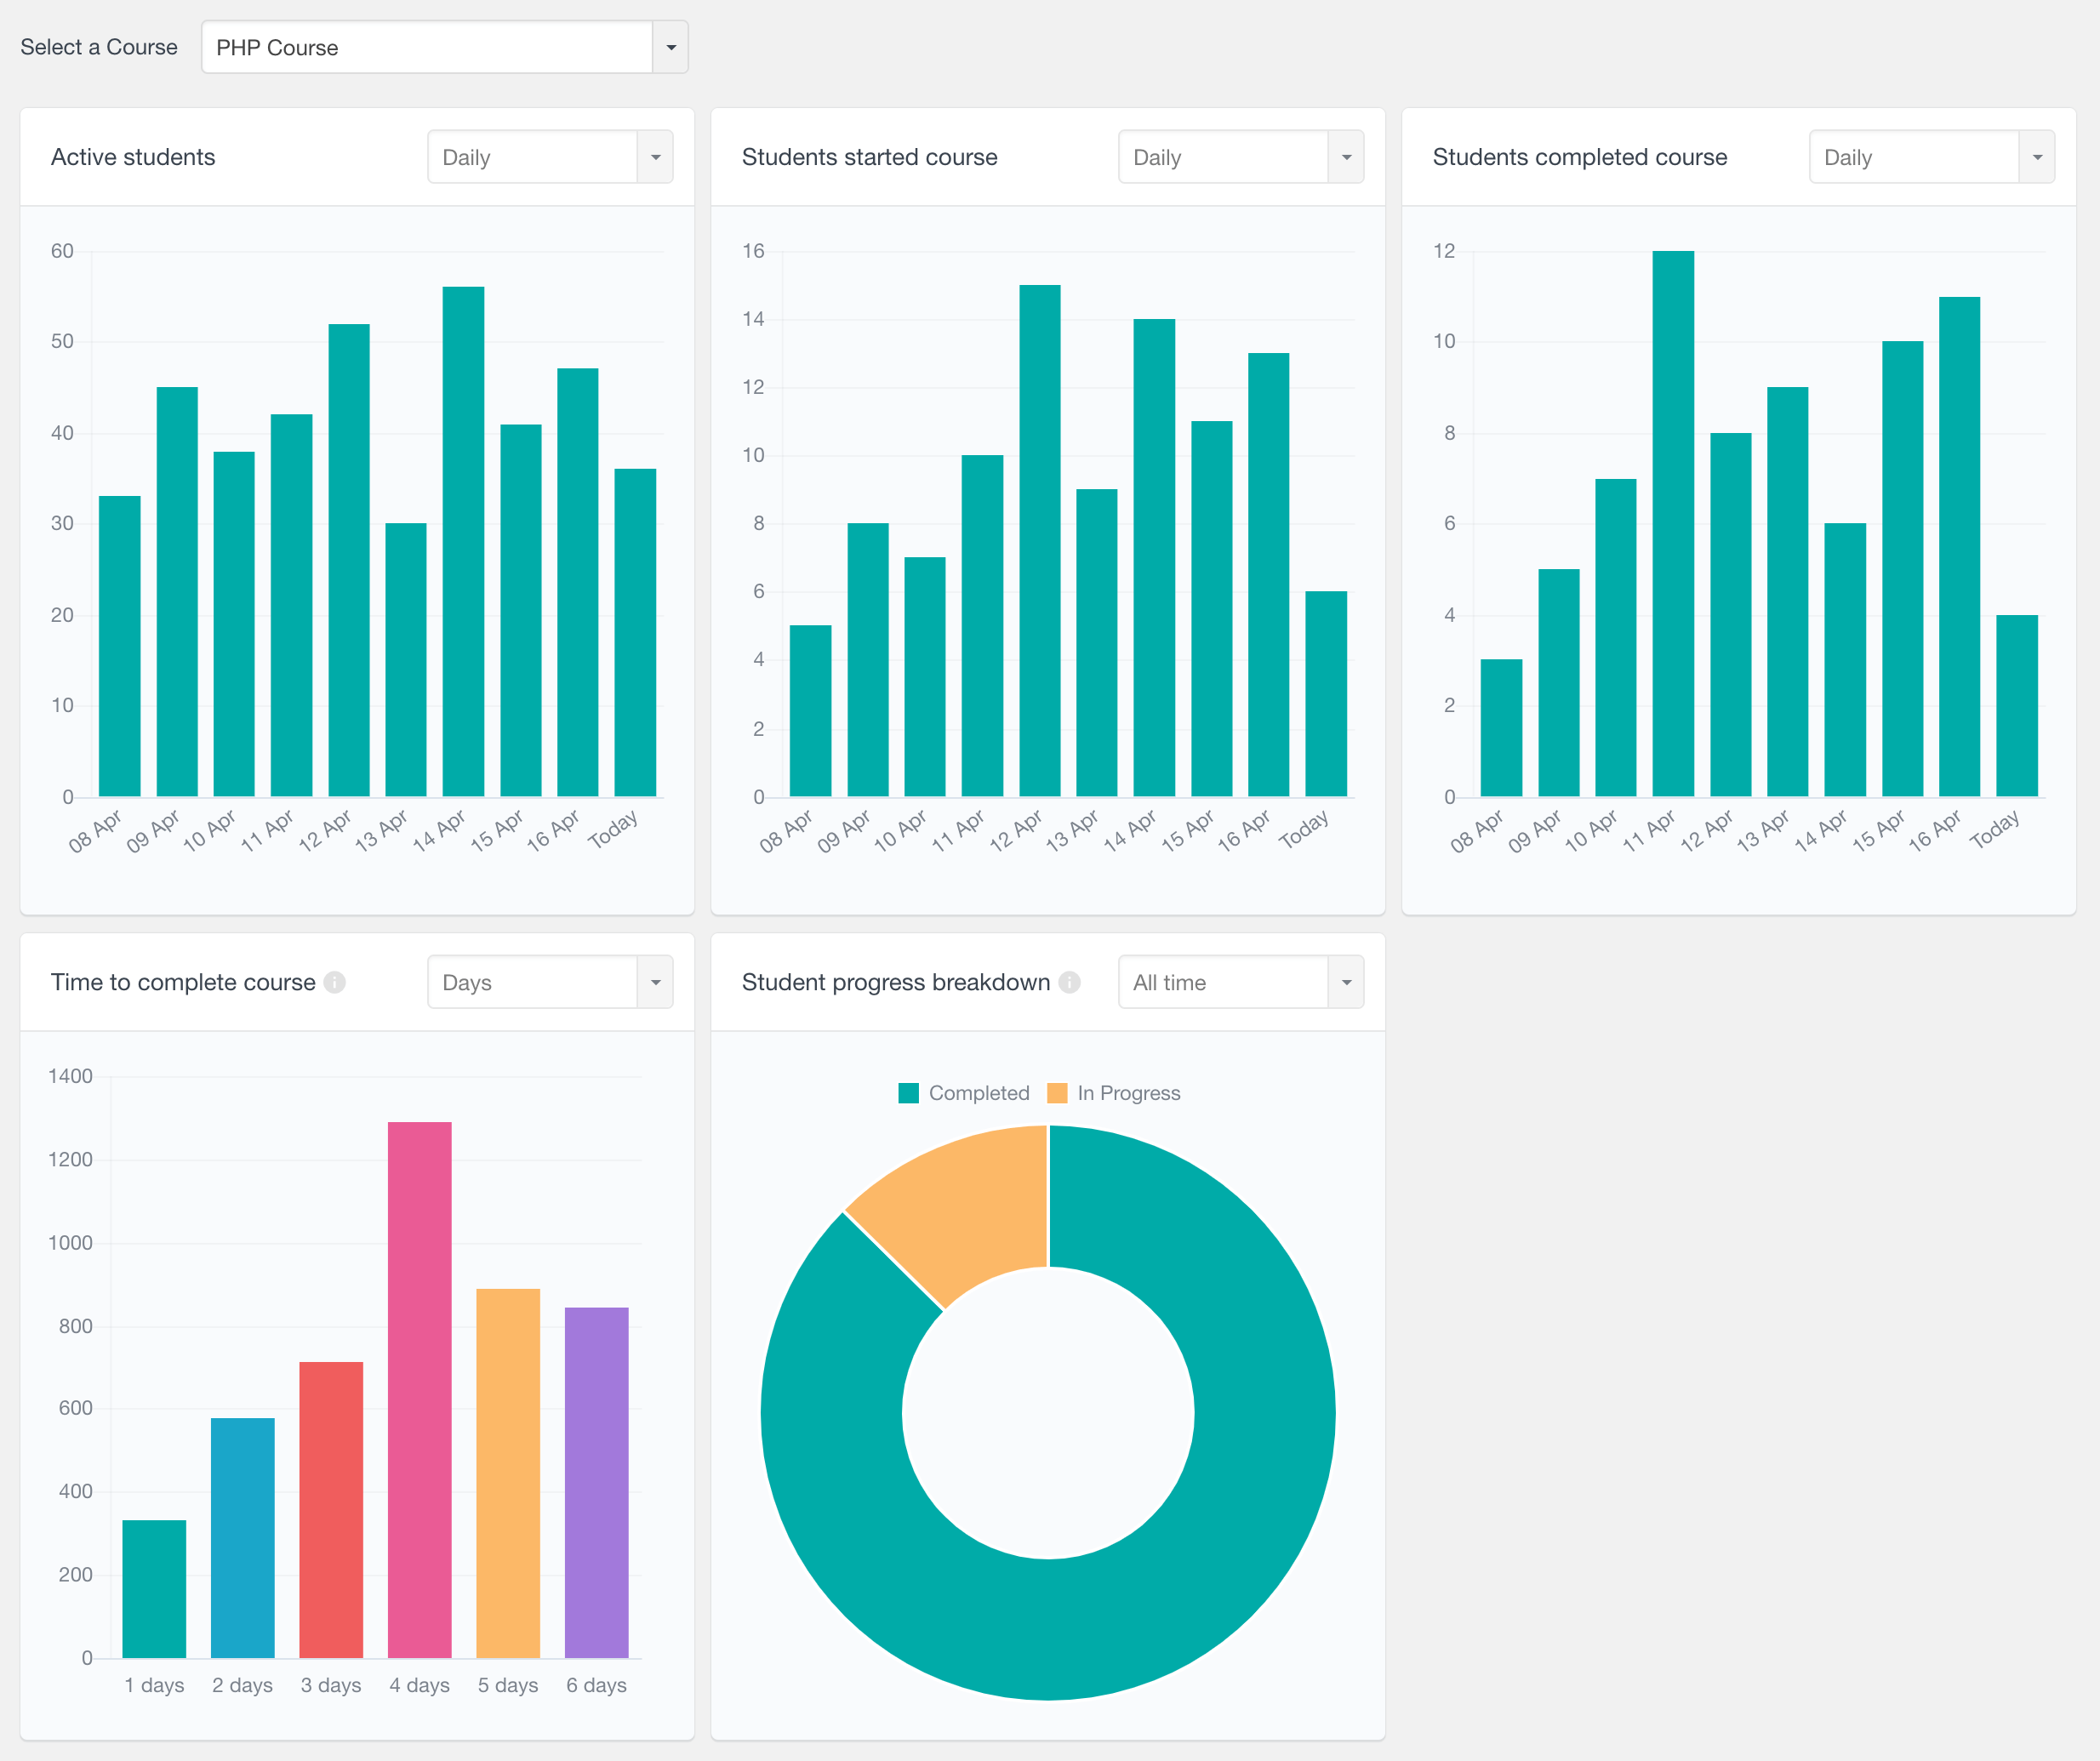
LearnDash Course Reports
Course-specific reports, providing information on student activity, enrolments, completions and course progress. For more information, you can refer to the LearnDash Course Reports page.
LearnDash user table, filters and profiles
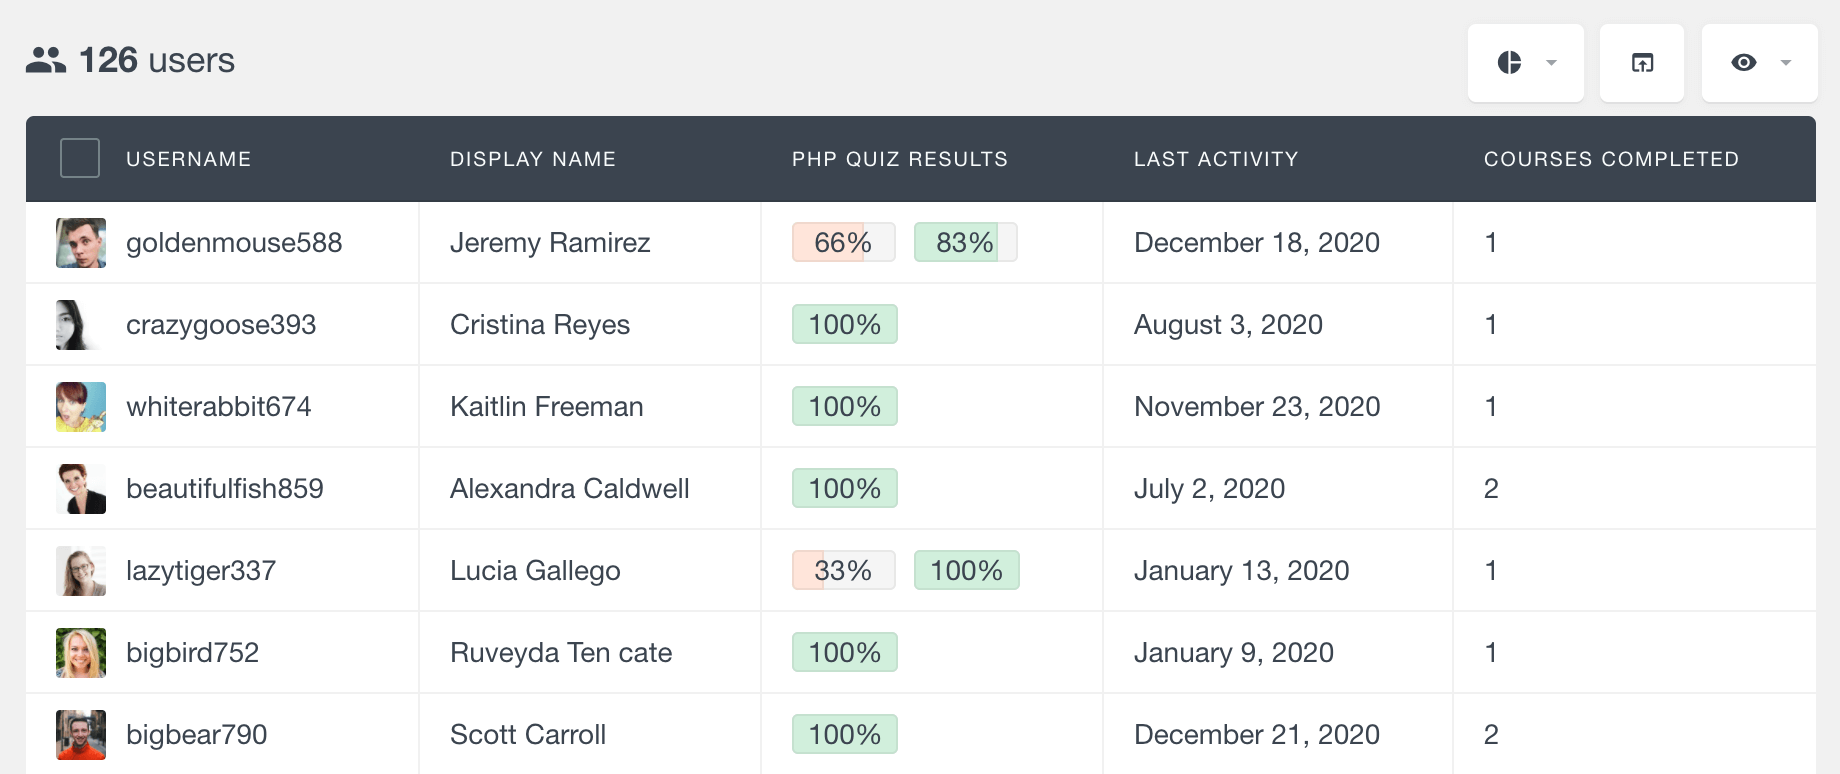
The Users Insights user table can be useful for analyzing individual student details and activities. Here you can find the quiz results for each student, as well as search and filter the users by their quiz and course activity. Additionally, it provides CSV exports, so you can easily export your selected student data from your admin dashboard. For more information, visit the LearnDash user data page.