Reports are a valuable tool to track progress and performance of your students. Tracking learner progress allows you to gain insights into your student development over time and take actions to improve your eLearning success. Being able to analyze the reports on your learning programs is an important feature for every LearnDash administrator.
The LearnDash module of Users Insights plugin comes with a LearnDash Reports features that can help you analyze your LMS’ course and students performance:
- General LearnDash reports (on this page)
- LearnDash Quiz reports
- LearnDash Course reports
- LearnDash user table, filters, and profiles
While the Users Insights user table and filters can help you search your students based on different criteria, the reports feature can give you a more global overview on your eLearning platform. With the Users Insights LMS reporting and analytics tools you can now explore metrics, such as how your student base is growing over time, how active they are and how they perform on the quizzes.
Let’s see all of the available LearnDash reports.
LearnDash Key Metrics Reports
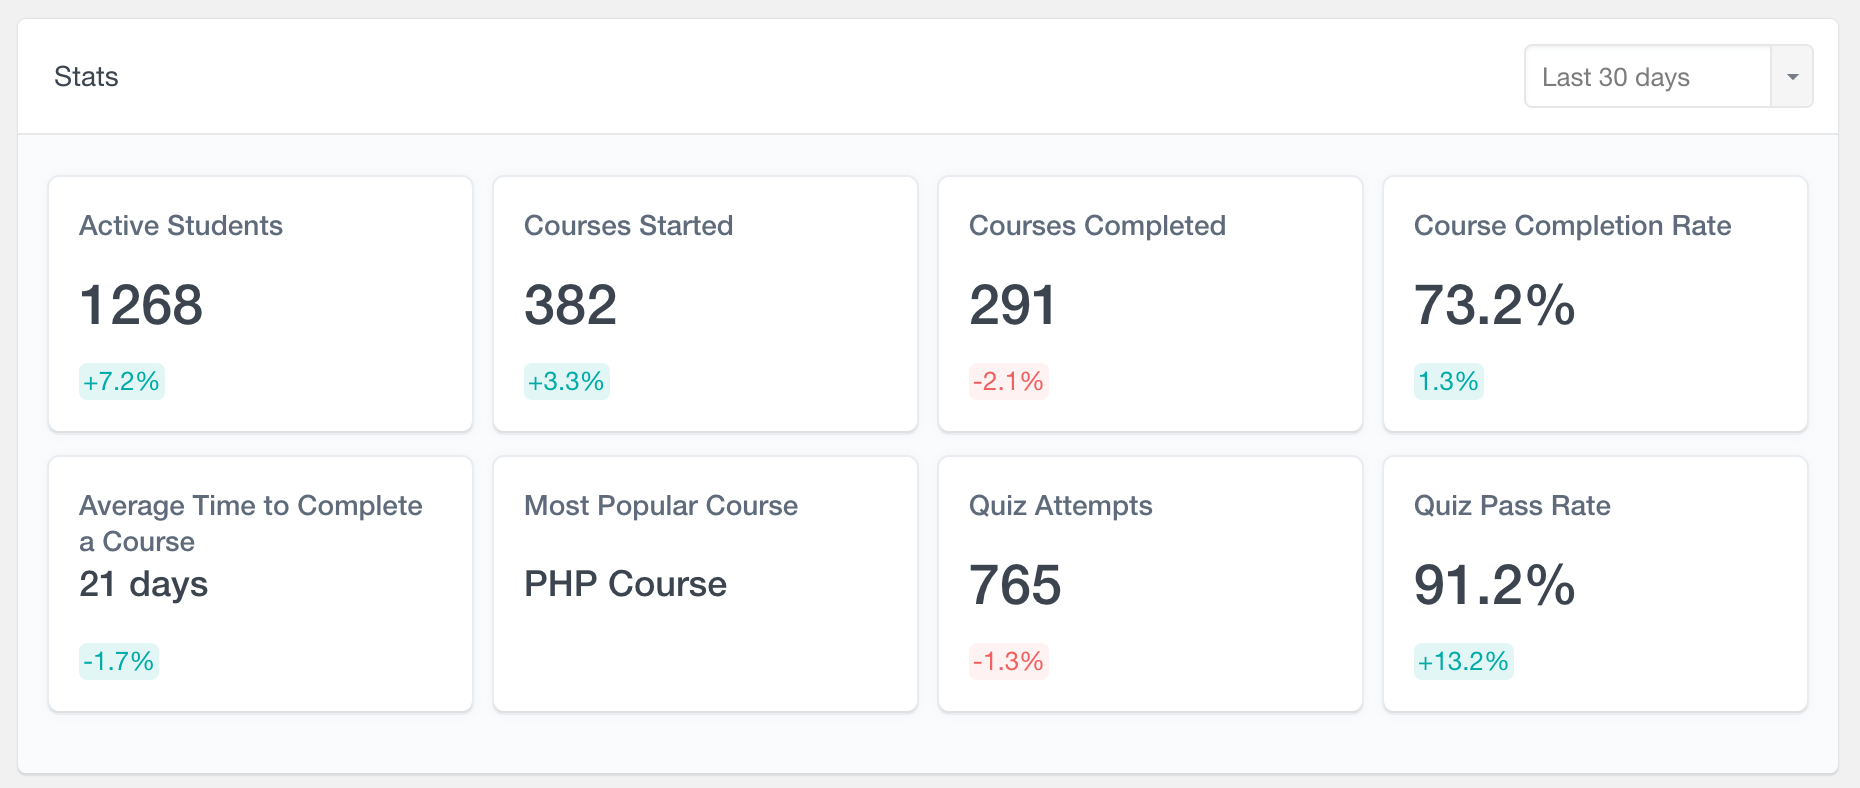
The key metrics reports provide a quick overview of the learning activity, giving a snapshot of how students are engaging with your courses over a selected time period. Each stat shows the current value – such as active students, courses started, or quiz pass rate, along with the percentage change compared to a previous period. You can choose from predefined ranges like “Last 30 days” or “Last 12 months”, or select a custom date range. The available metrics are:
- Active Students – number of active students for the selected period
- Courses Started
- Courses Completed
- Course Completion Rate – percentage of the courses that were started in the selected period and completed in the same period
- Average Time To Complete a Course – calculated based on courses completed in the selected period
- Most Popular Course – the course with most activity for the selected period
- Quiz Attempts
- Quiz Pass Rate
LearnDash active students report
The active students report shows how many students have been active over time. The student activity is charted on a time scale, so you can explore the student activity for the last several days, weeks, months and years. Students are considered as active when they start or finish a course, topic, lesson or a quiz. For example, if a user signs in and completes a lesson, this student will be counted as active for the day. However, if the student only signs in and does nothing, this won’t be considered as activity. This report can be a good way to find how engaged your users are with the content of your learning management system.
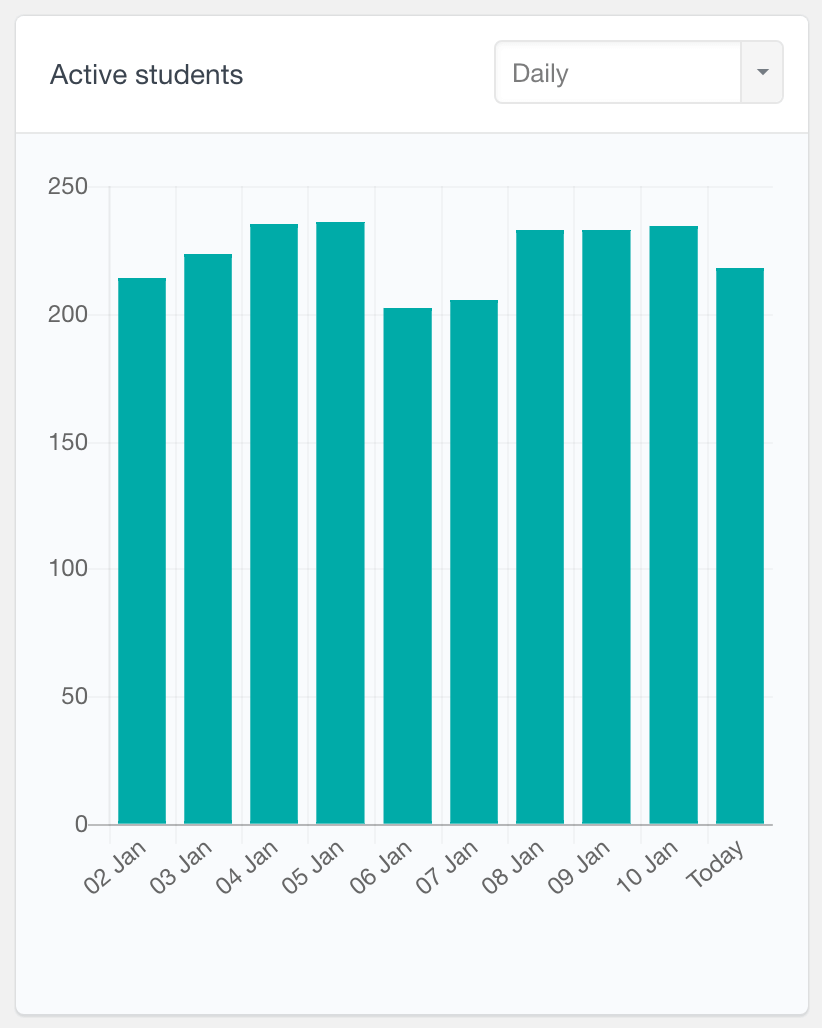
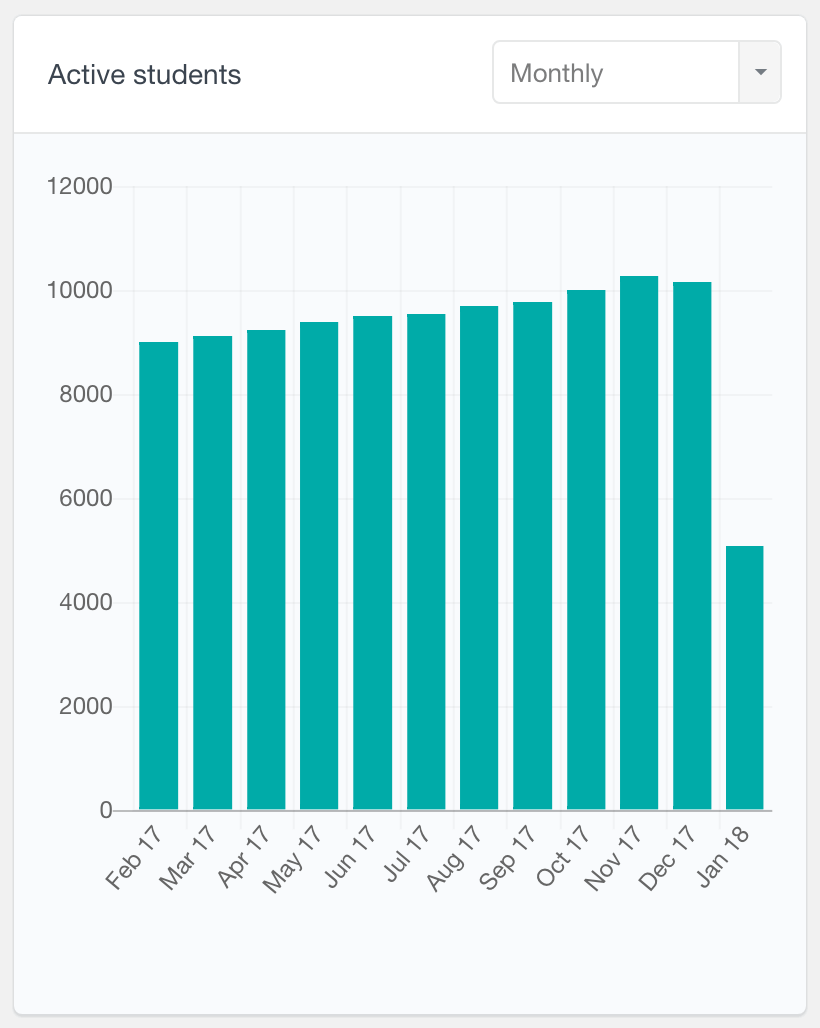
This report is also available per-course in the LearnDash Course Reports section.
LearnDash courses started and courses completed reports
With these two reports you can see how many courses have been started and completed by the students over time. The “Courses started” report especially can be used as an indication of how your LearnDash student base is growing over time. And the “Courses completed” report can be used as an indication of how engaging your courses are, just by exploring how many students have actually completed these courses.
Similarly to the active students report, you can explore the course activity for the last several days, weeks, months or years.
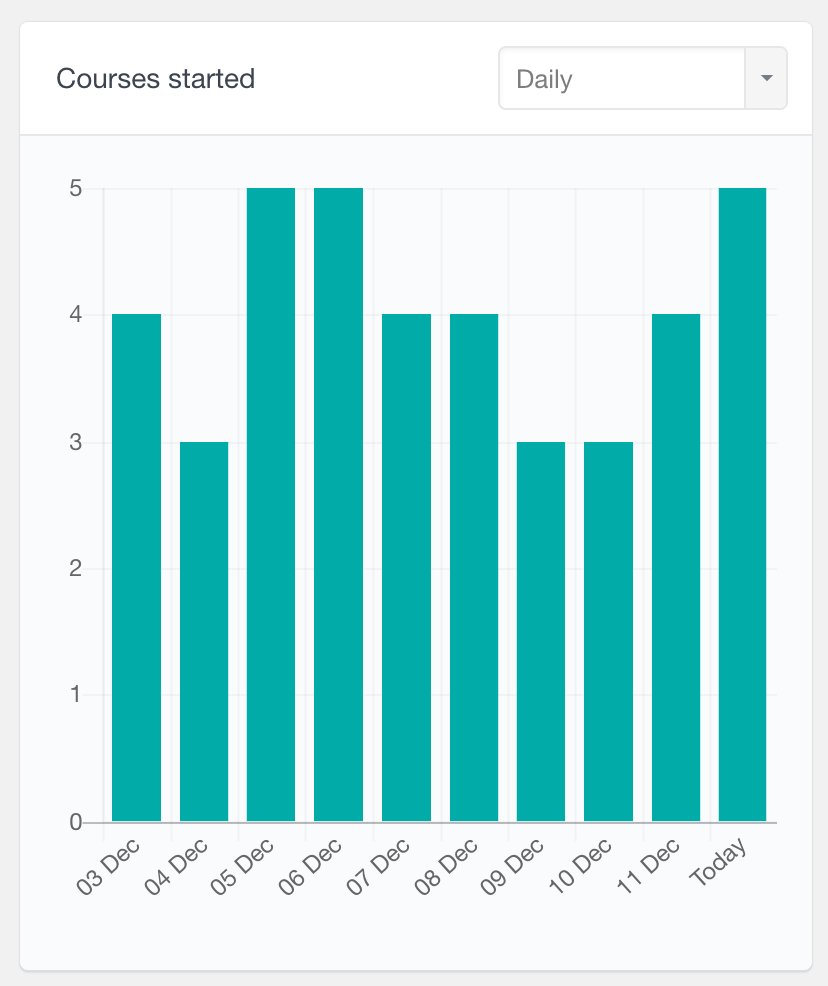
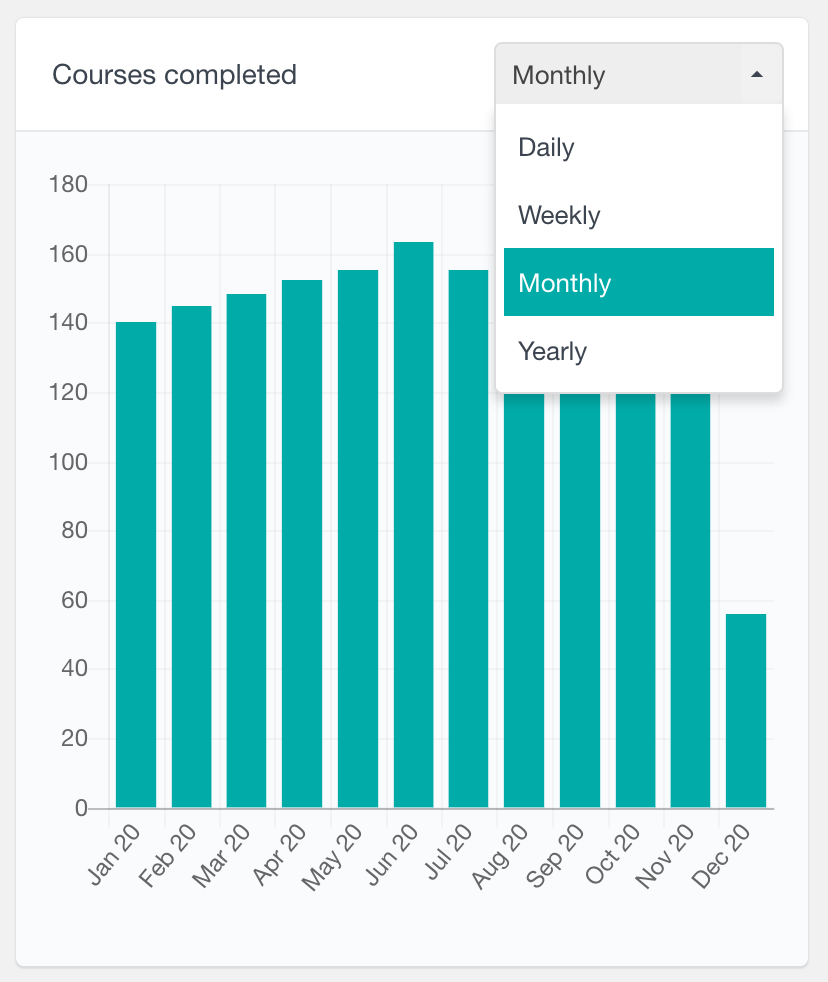
These two reports are also available on per-course basis, so you can easily explore enrolments and completions for a selected course over time. The course specific reports can be accessed from the LearnDash Courses reports section.
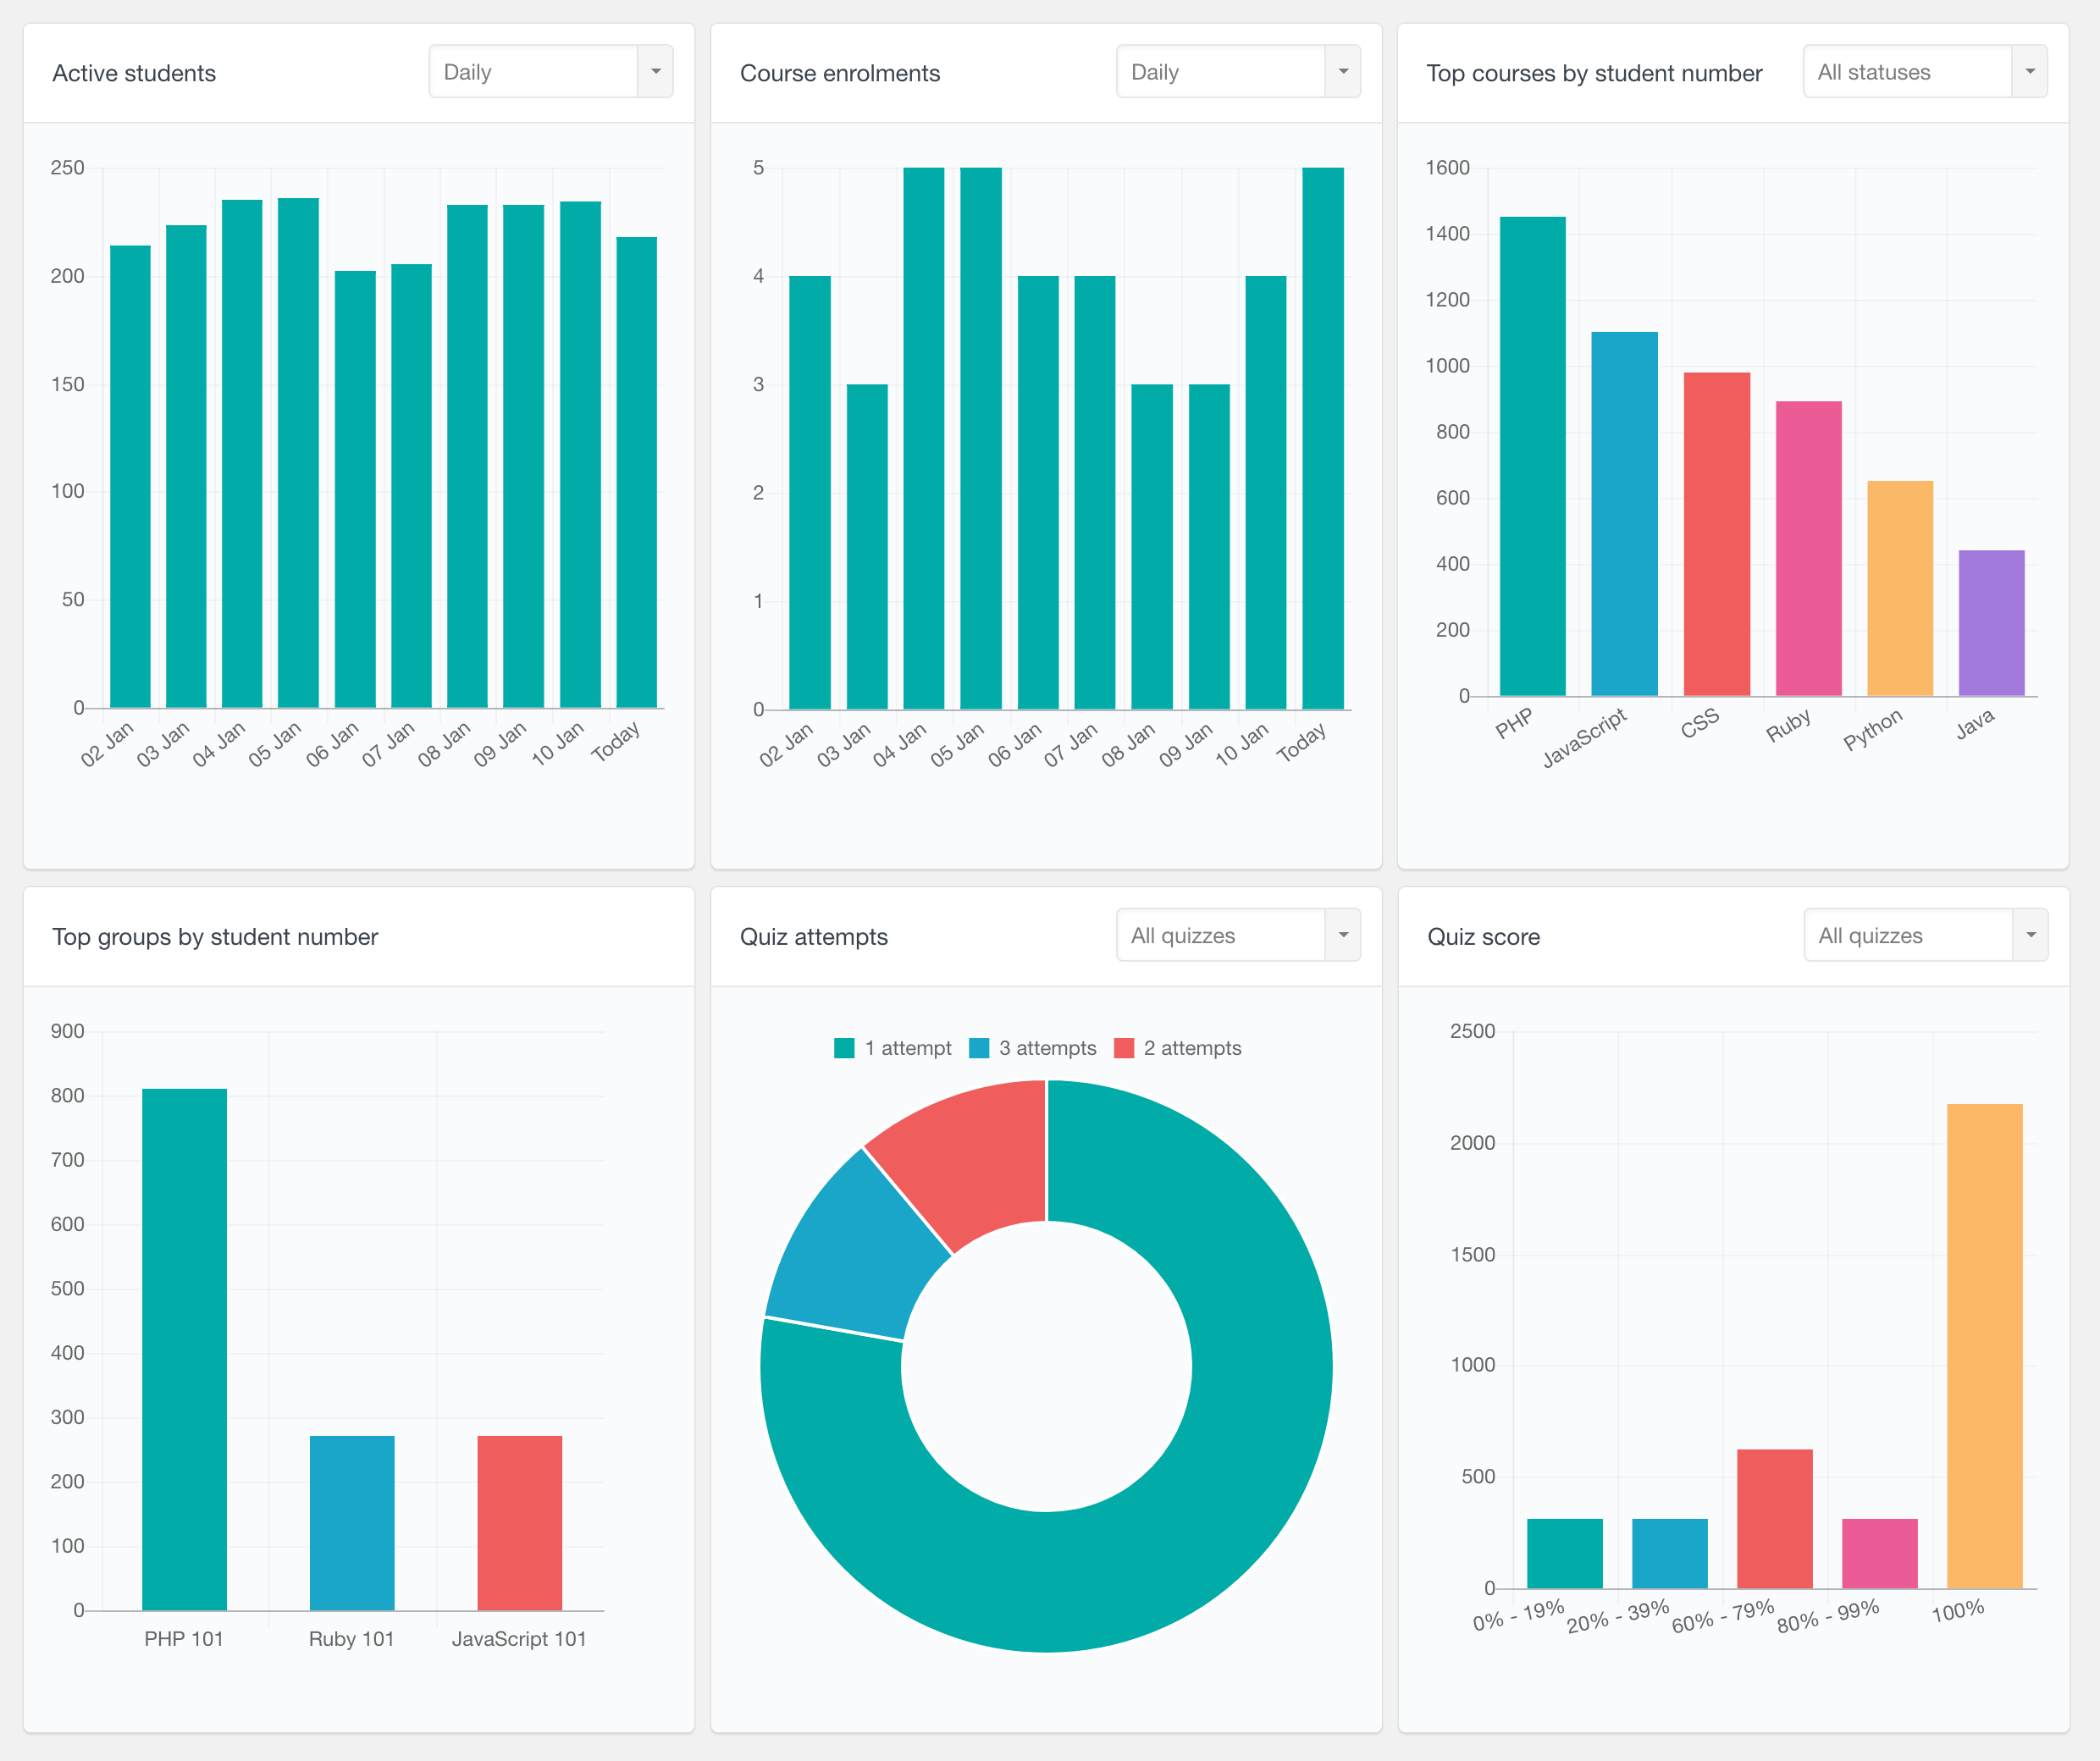
LearnDash top courses report
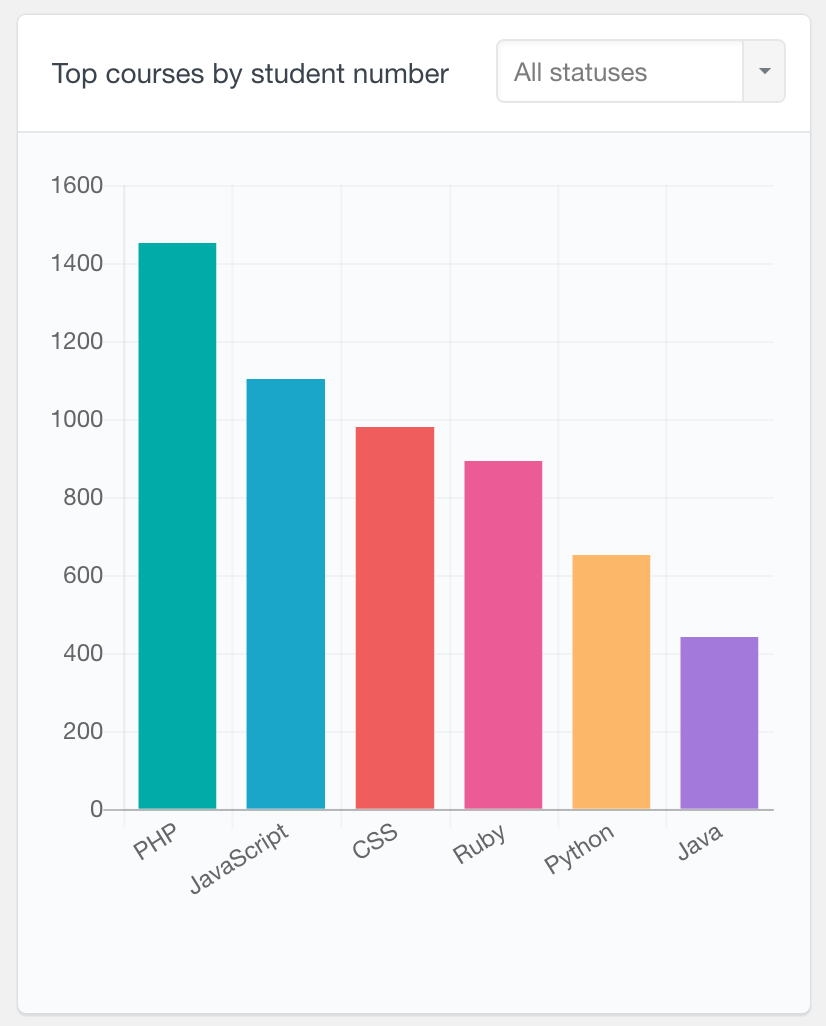
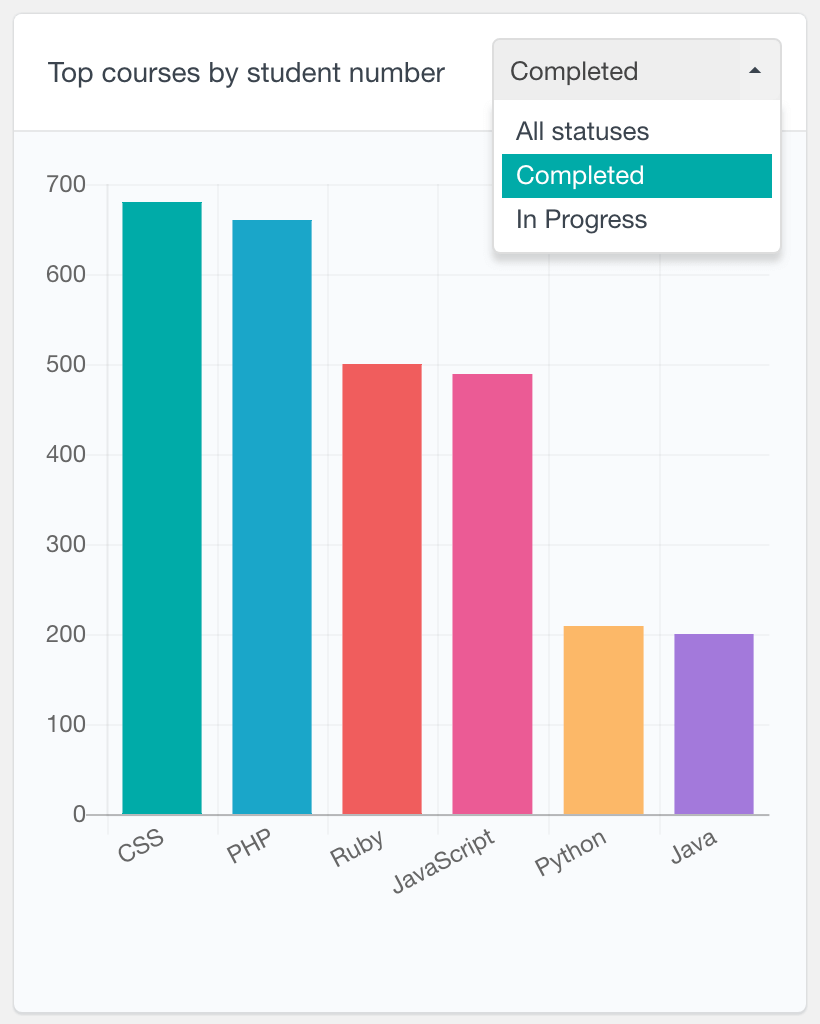
The top courses report shows a chart of the most popular courses based on the number of students per course. By default the report is generated based on the number of students that have ever enrolled in the online course, regardless of whether they have completed it or not. However you can also filter the report by the status of the courses. In this way, you can track course engagement find your top completed courses. Or you can see which courses have a high number of students that still have the course in progress.
This performance report can be another indication of how engaging your courses are. For example, highly engaging courses will have a higher percentage of students who have completed it versus the ones that are still in progress.
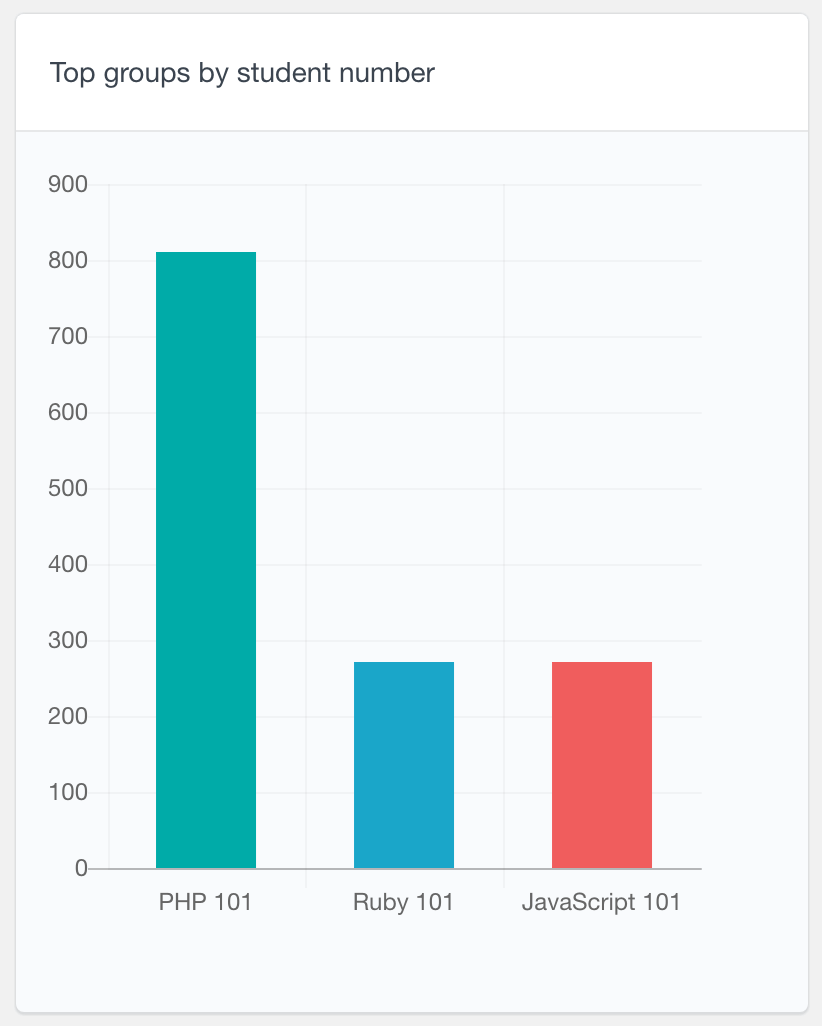
LearnDash top groups report
If you are using the LearnDash groups feature, you can use the top groups report to find the most popular groups based on the number of students. By default the report shows the top 8 most popular LearnDash groups in a bar chart. This LMS report can be useful in various ways, depending on how your system works. For example, if you find that you have a few groups that are more popular than the rest, you may consider creating more content for these groups’ courses specifically.
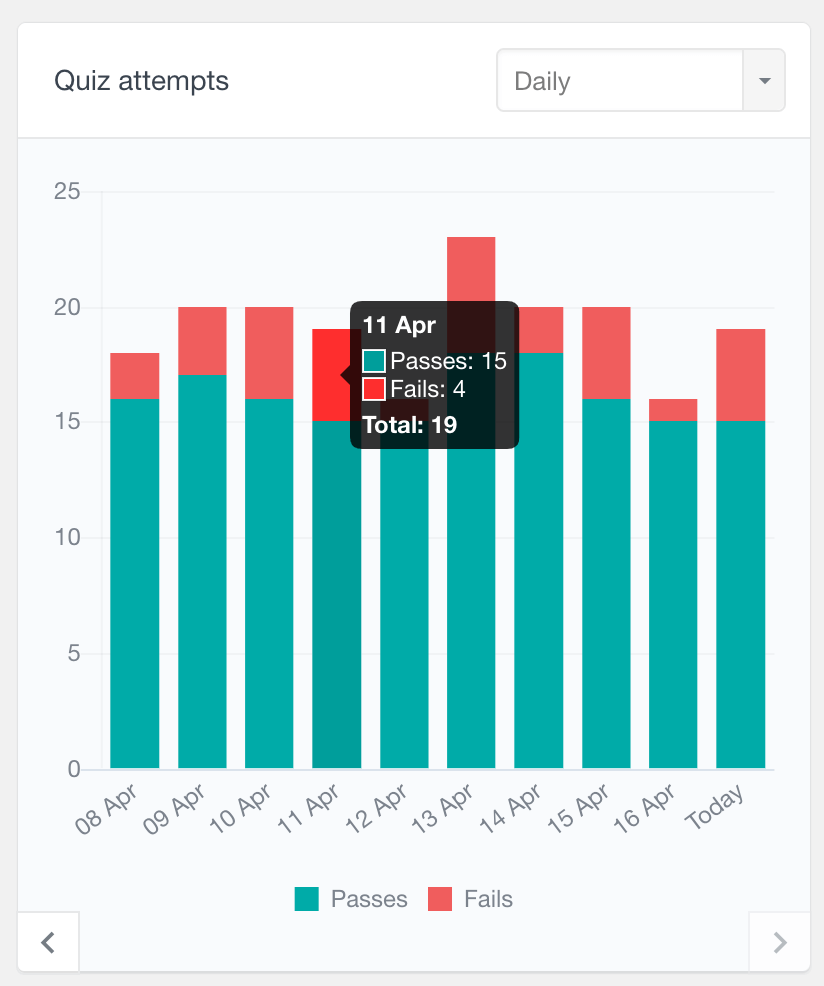
LearnDash quiz attempts report
The Quiz Attempts report displays the total number of attempts over time, segmented in color-coded groups to visualize passes (green) and fails (red). It is a periodic chart, displaying the data in daily, weekly, monthly and yearly periods.
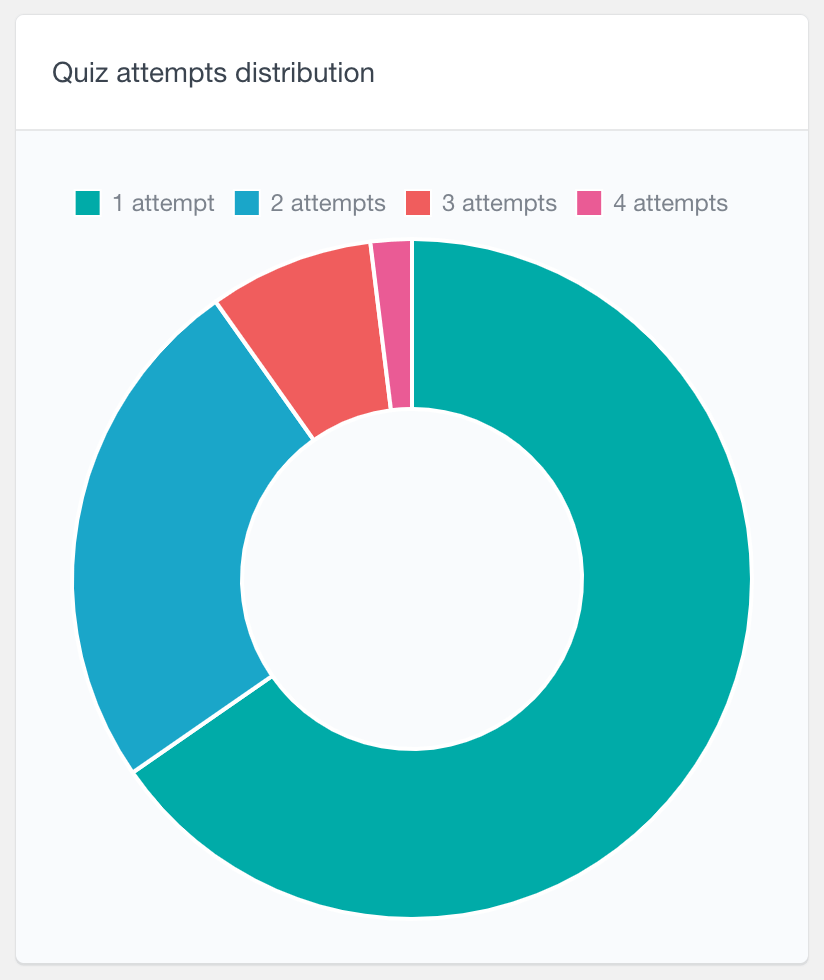
Another report that can help you analyze the quiz activity is the Quiz Attempts Distribution report. It is a pie chart report showing how many attempts your users need in order to complete a quiz. For example, it can show you how many students have passed a quiz from the first time or how many students took the quiz multiple times before passing it. This report can be a good indication of your quizzes’ difficulty level.
By default, both reports show the overall quiz attempts for all of the existing quizzes. However, you can also explore individual quiz attempts from the LearnDash Quiz reports section.
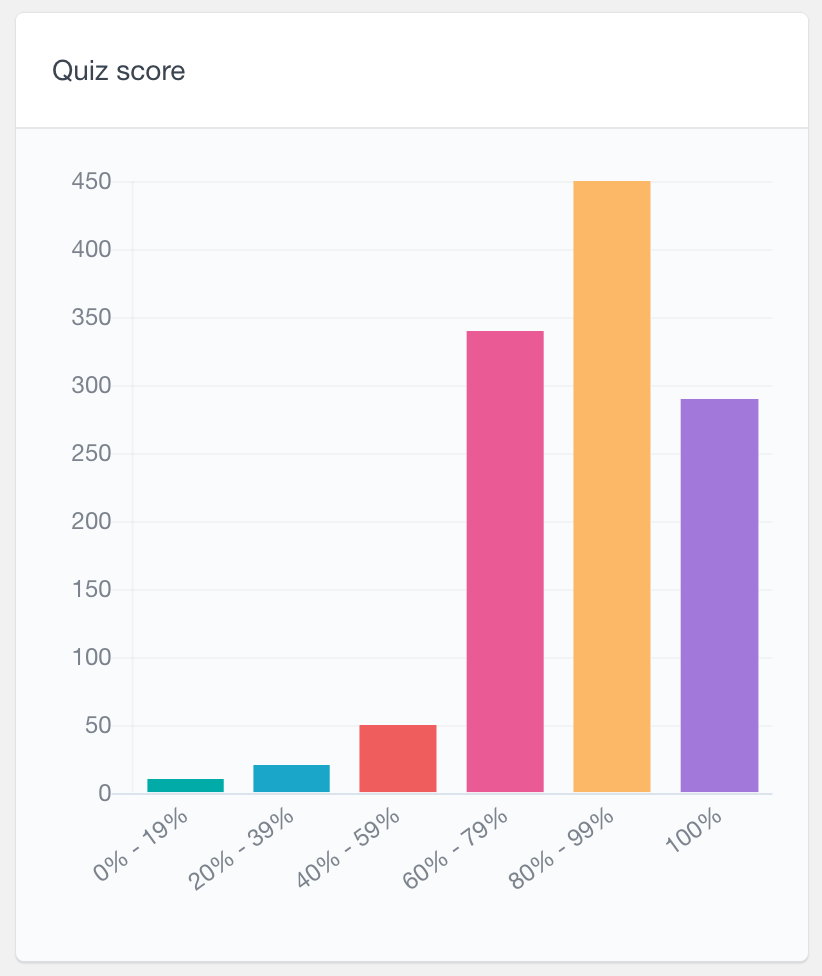
LearnDash quiz score report
Another quiz related report is the quiz score report. This report shows the scores of the quiz attempts. They are represented in ranges, so you can see overall how your students score on the quizzes.
Furthermore, you or the Group Leader can use this report to show the student performance and scores from a selected quiz only. This can be done from the LearnDash Quiz reports section, which displays activity and stats for a selected quiz.
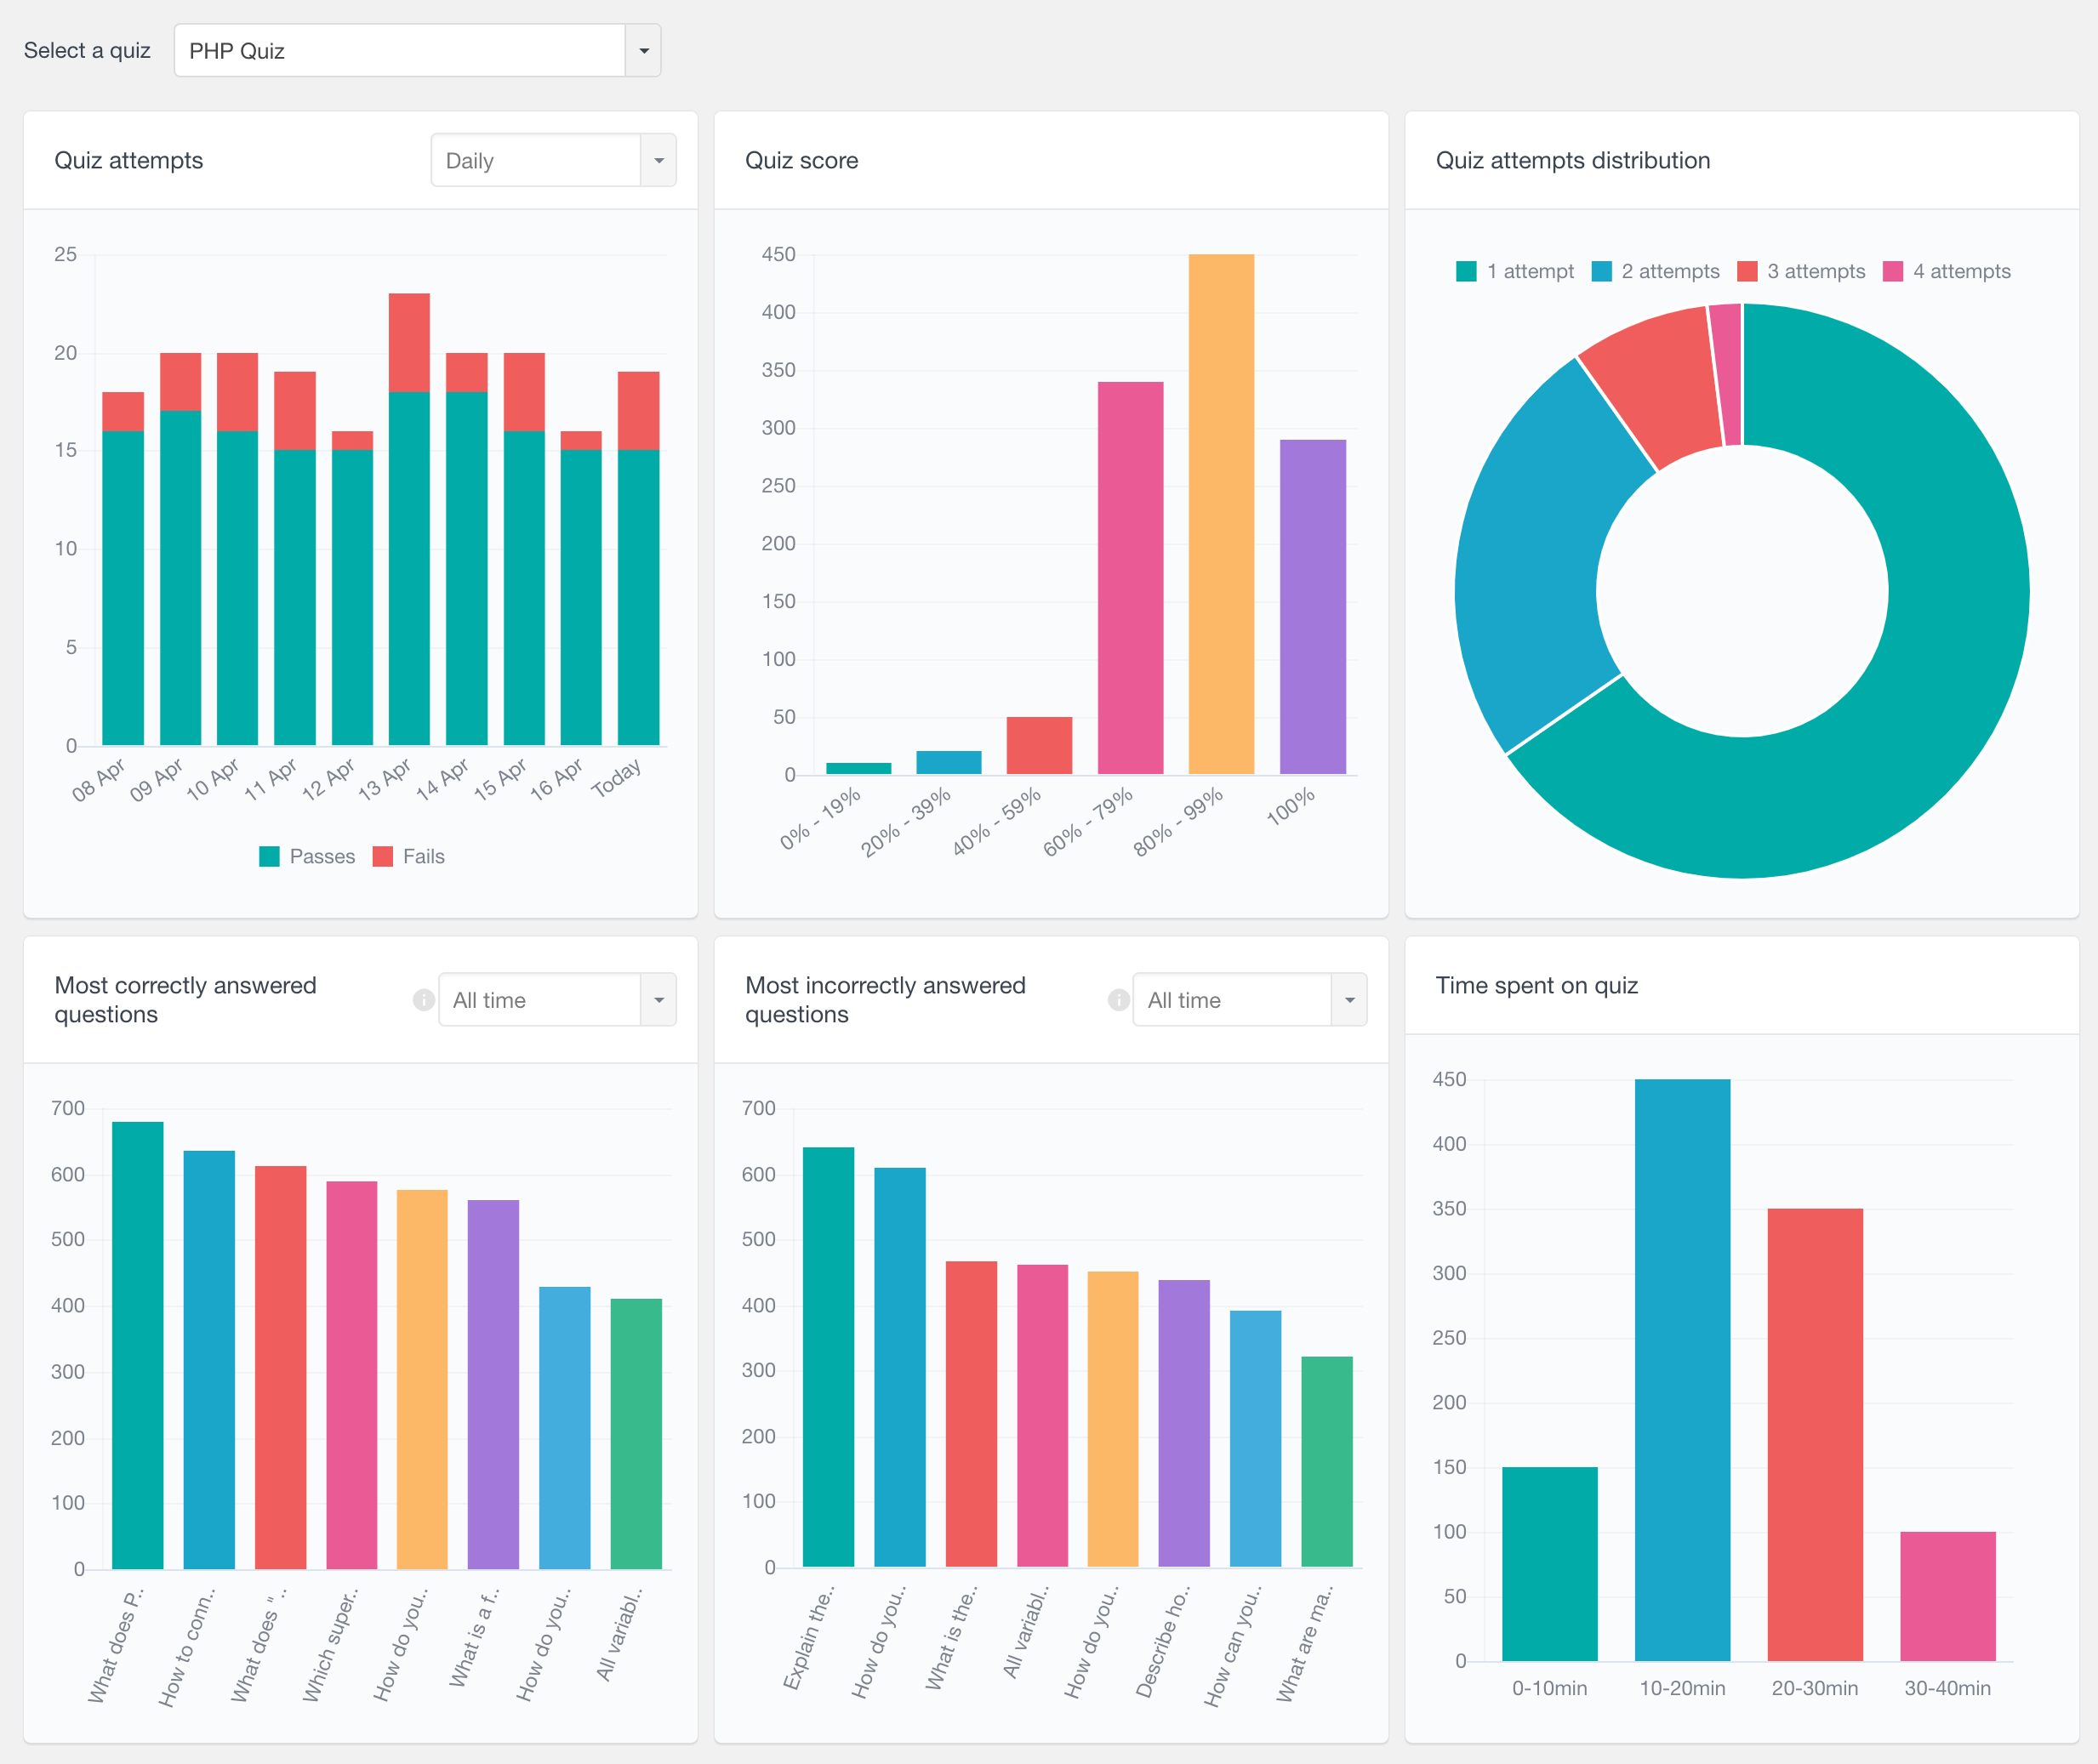
More LearnDash Quiz Reports
Users Insights includes a dedicated quiz reports section that shows stats and activity for a selected quiz only. In this section you can access reports like quiz attempts, quiz score, most correctly/incorrectly answered questions and time spent on quiz. For more information, you can visit the LearnDash Quiz Reports page.
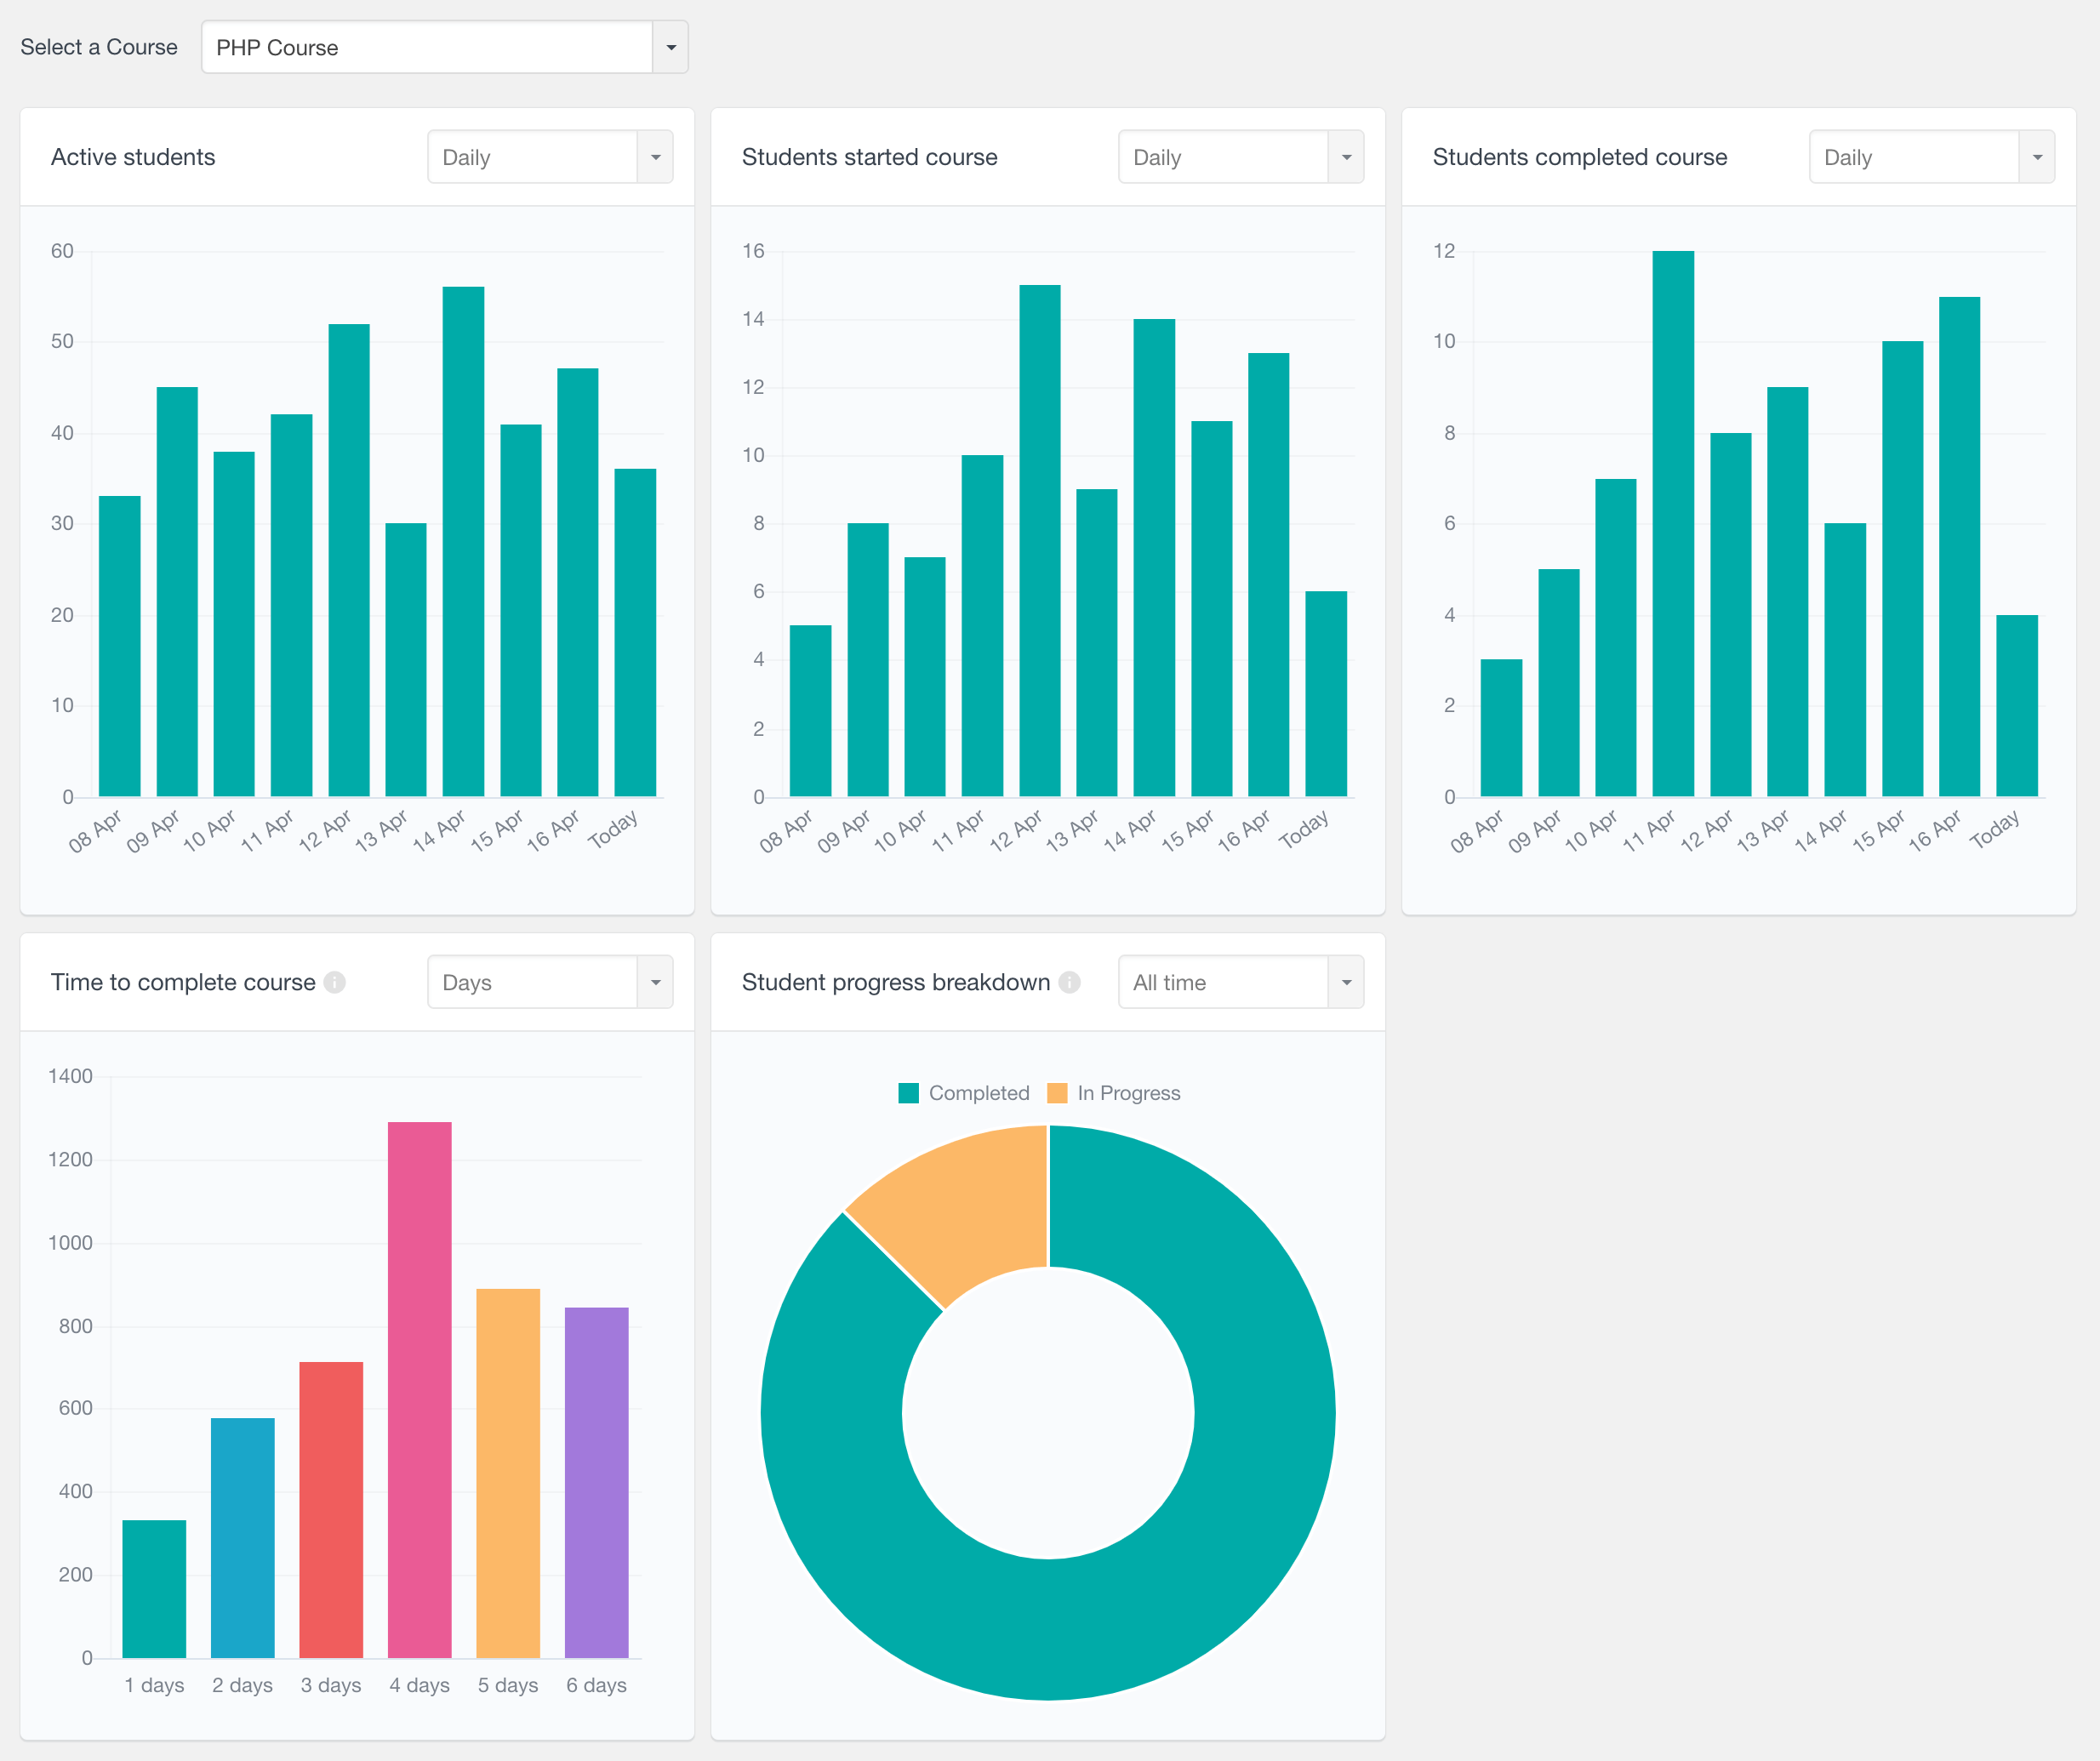
More LearnDash course reports
The reports feature of Users Insights also includes a LearnDash Course reports section, where you can view course-specific reports. In this page you can select a course and explore metrics such as number of active students, course completions and time to complete course. For more information you can refer to the LearnDash Course Reports page.
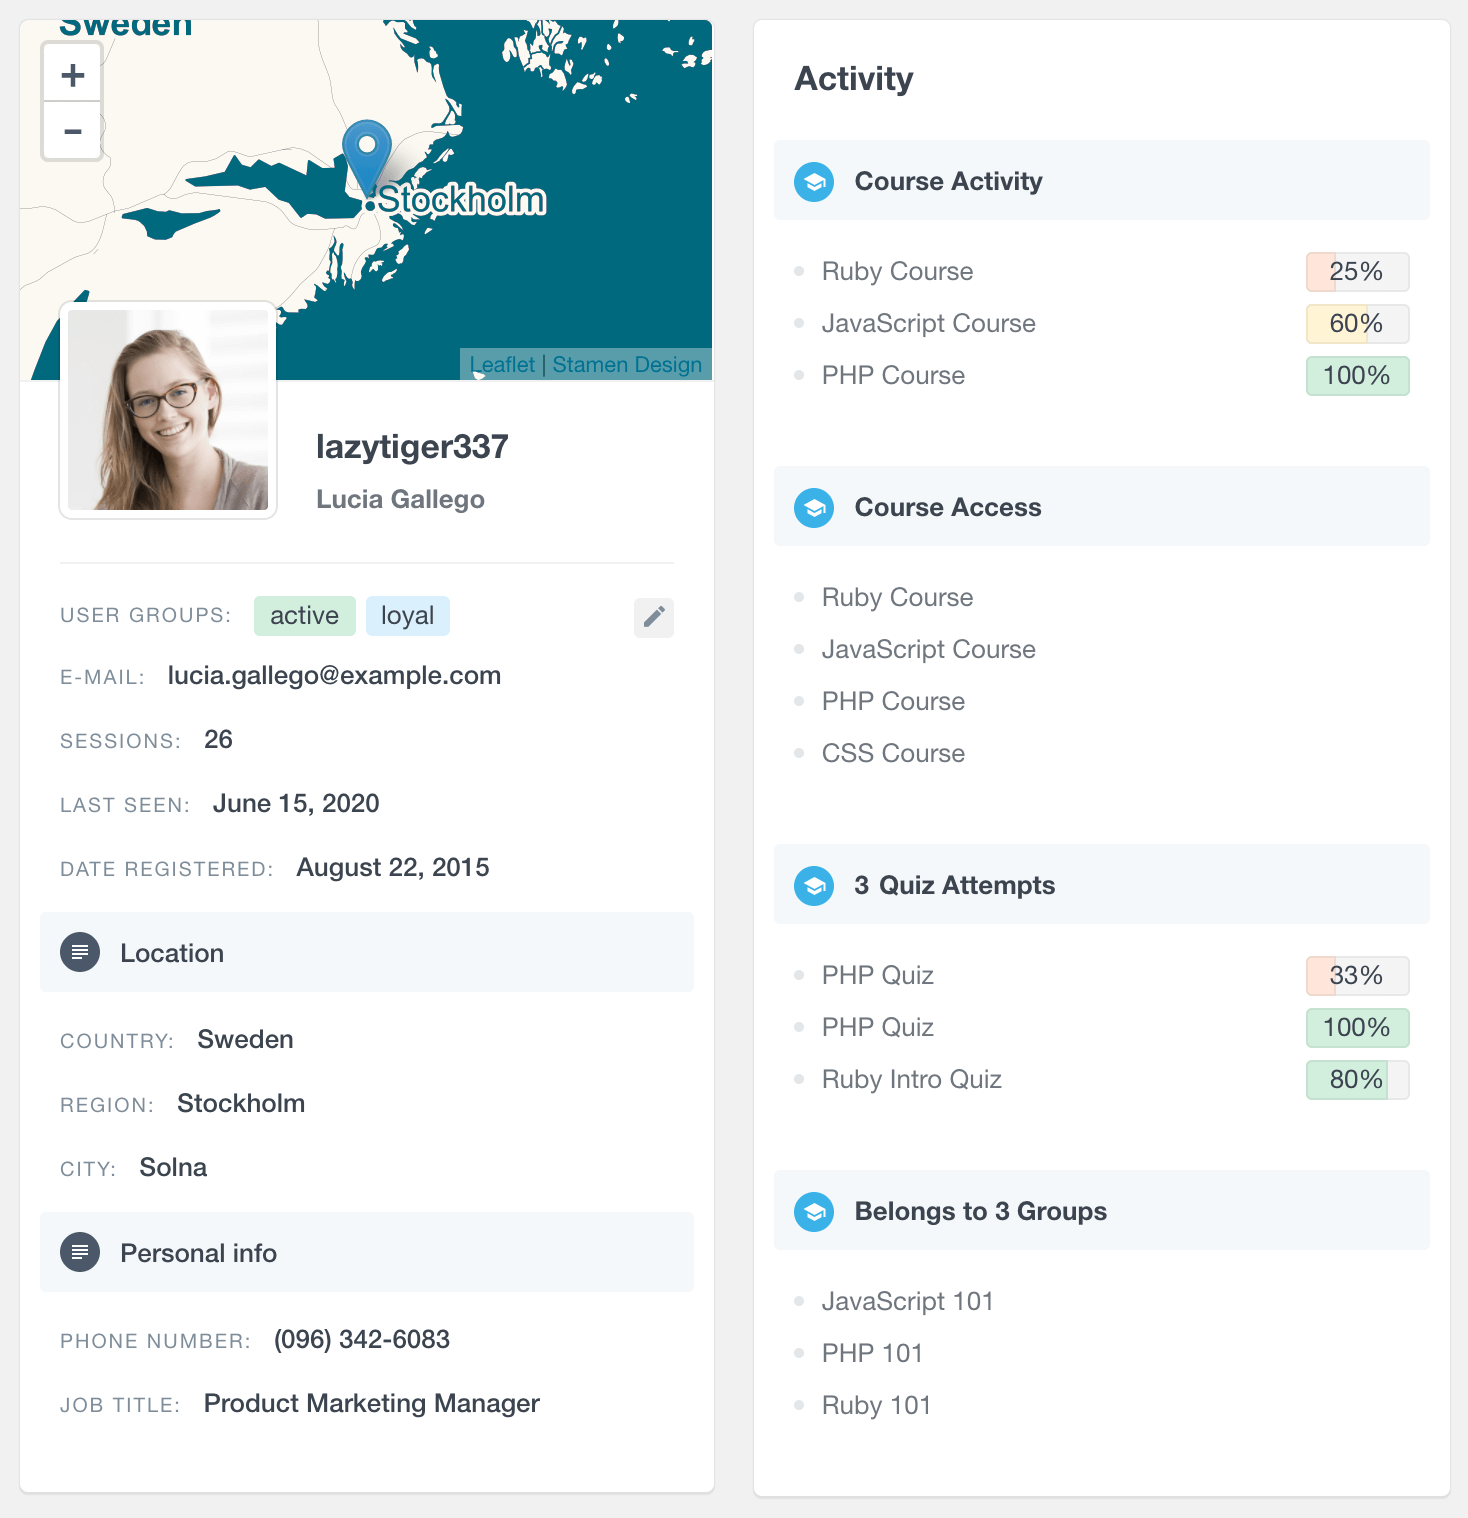
LearnDash student activity and performance
The reports section provides aggregate LearnDash reporting and LearnDash analytics. This type of LearnDash reporting can be quite helpful for tracking overall student performance and courses performance. However if you (or any LearnDash instructor) want to access a report for a specific learner and get data on individual level you can do it via the Users Insights profile pages. This is where all the individual student data is aggregated in one place. From here you can see the individual student performance and LearnDash analytics like: course completion and progress , course access, LearnDash groups the student belongs to, LearnDash quiz attempts, quiz results and completion:
Other WordPress user metrics and analytics
Besides the LearnDash specific metrics, Users Insights also comes with some more general WordPress user metrics. For example, the Registered Users report can show you the growth of your student base over time. Or you can explore the Users Insights Geolocation data with the demographic based user reports. Or perhaps, you are using WooCommerce to provide premium courses to your students and you can use the WooCommerce reports to analyze your sales performance.
Head over to the Reports page to learn more about all of the available reports.
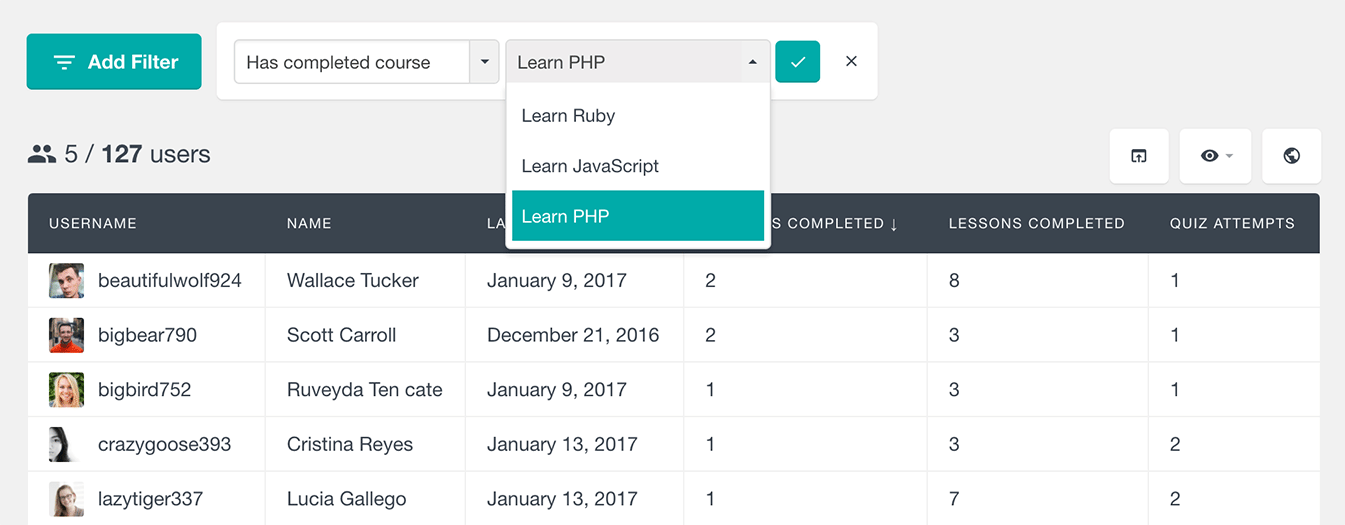
Advanced LearnDash user filters
In addition to the LearnDash reports, with Users Insights plugin you can perform advanced user searches and filters. You can search your students based on the courses that they are enrolled in or the quizzes that they have passed. Also you can see a detailed user profile page for each student that includes a detailed list of their LearnDash activity.
To learn more about the student related features, you can visit the LearnDash page where we have described everything in detail.