The LearnDash Course Reports feature of Users Insights provides detailed course activity reports for a selected course. This includes reports like the number of active students, how many students have started or completed a course over time, and the average time to complete the course. These features, combined with the rest of Users Insights LearnDash features, can give you valuable insights into your student activity.
The Users Insights plugin comes with the following features that can help you analyze your LearnDash student activity:
- LearnDash course reports (on this page)
- General LearnDash reports
- LearnDash Quiz reports
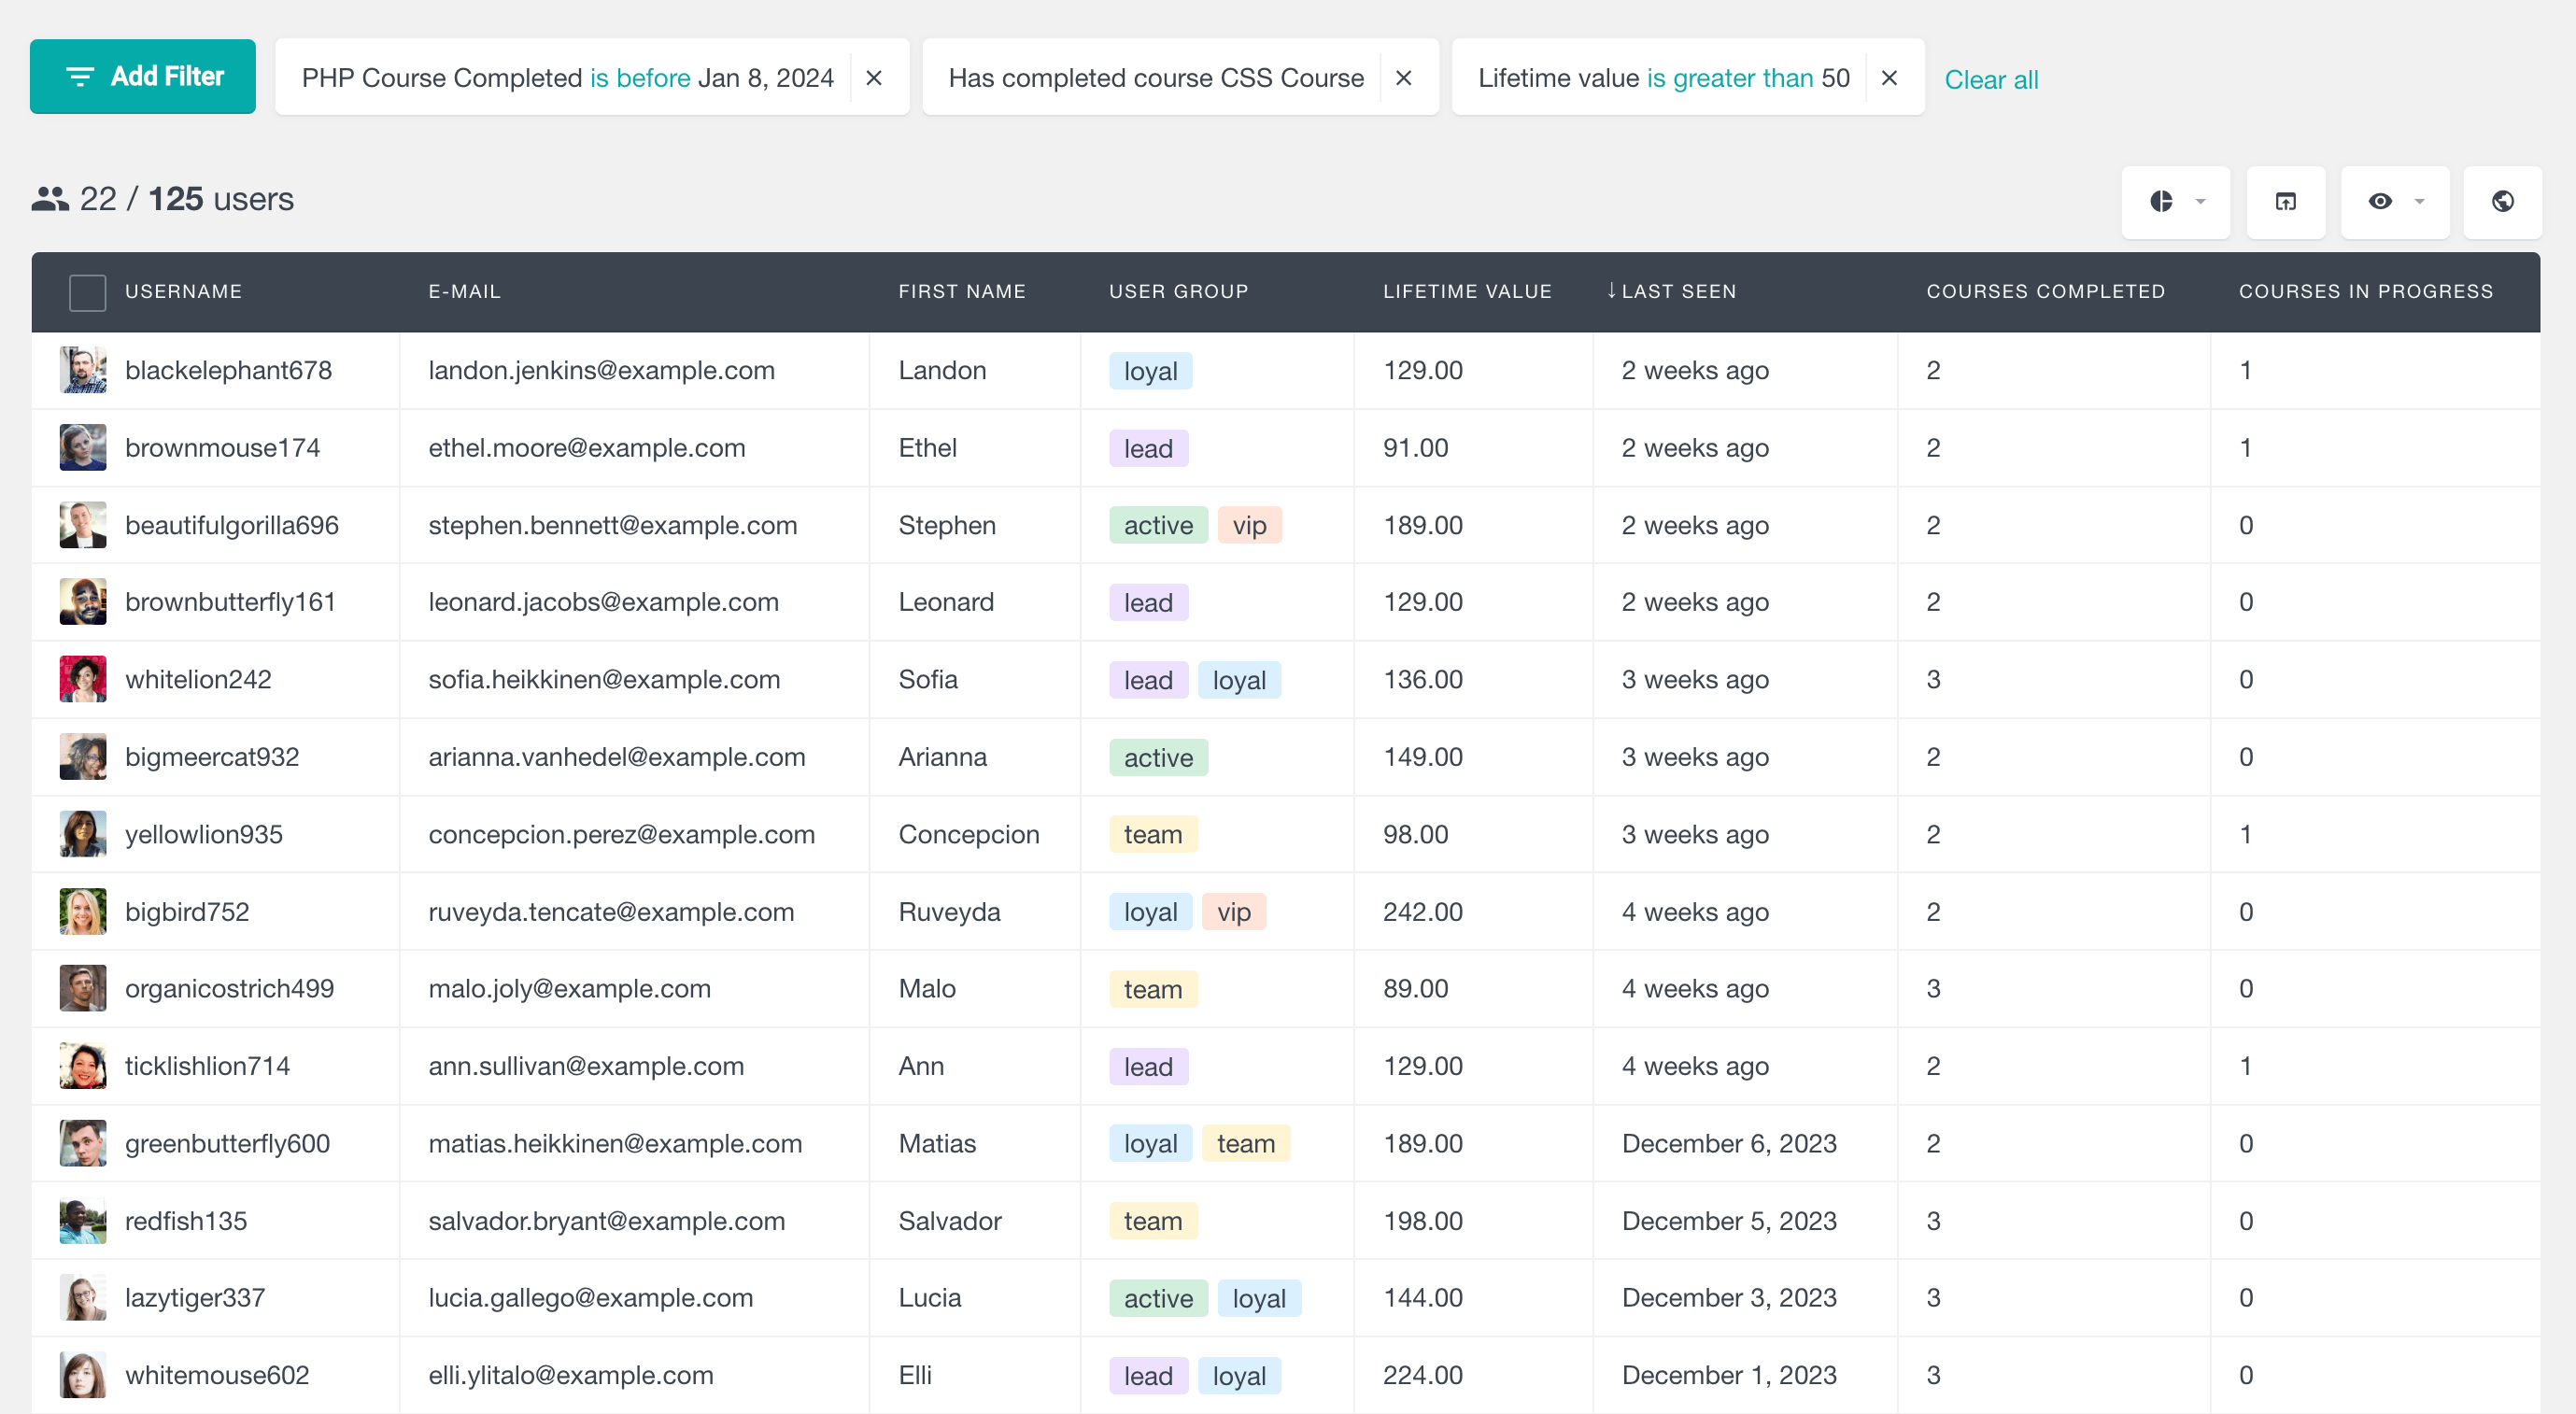
- LearnDash user table, filters, and profiles
To access the LearnDash Course Reports, go to WordPress Dashboard > Users Insights > Reports > LearnDash Courses. In this section you will be prompted to select a course:
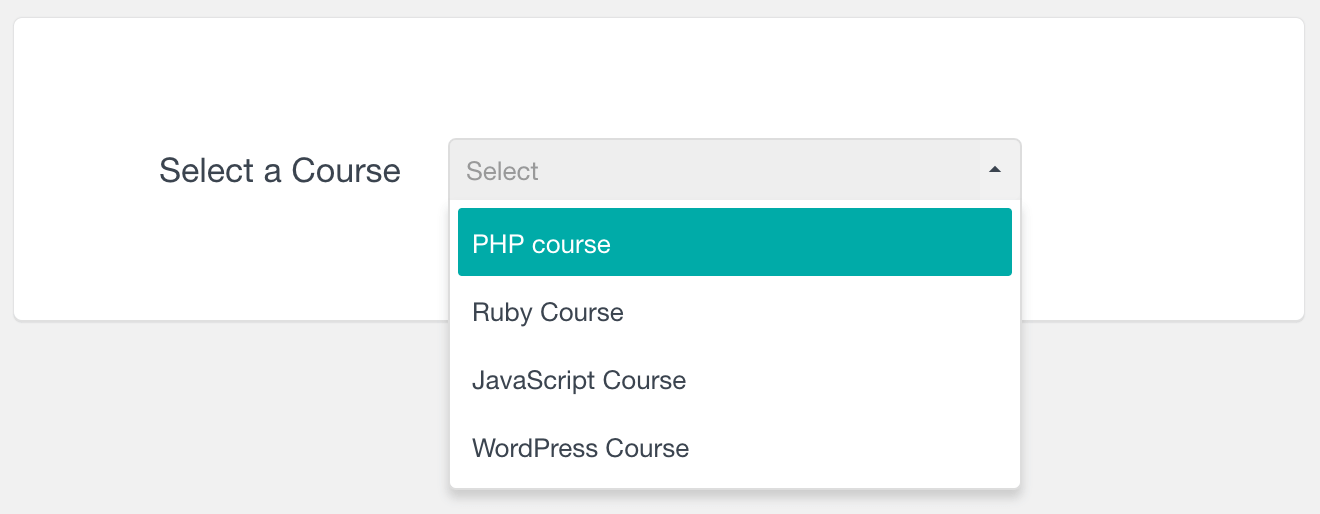
Once you select the course, a range of reports will become available for the selected course.
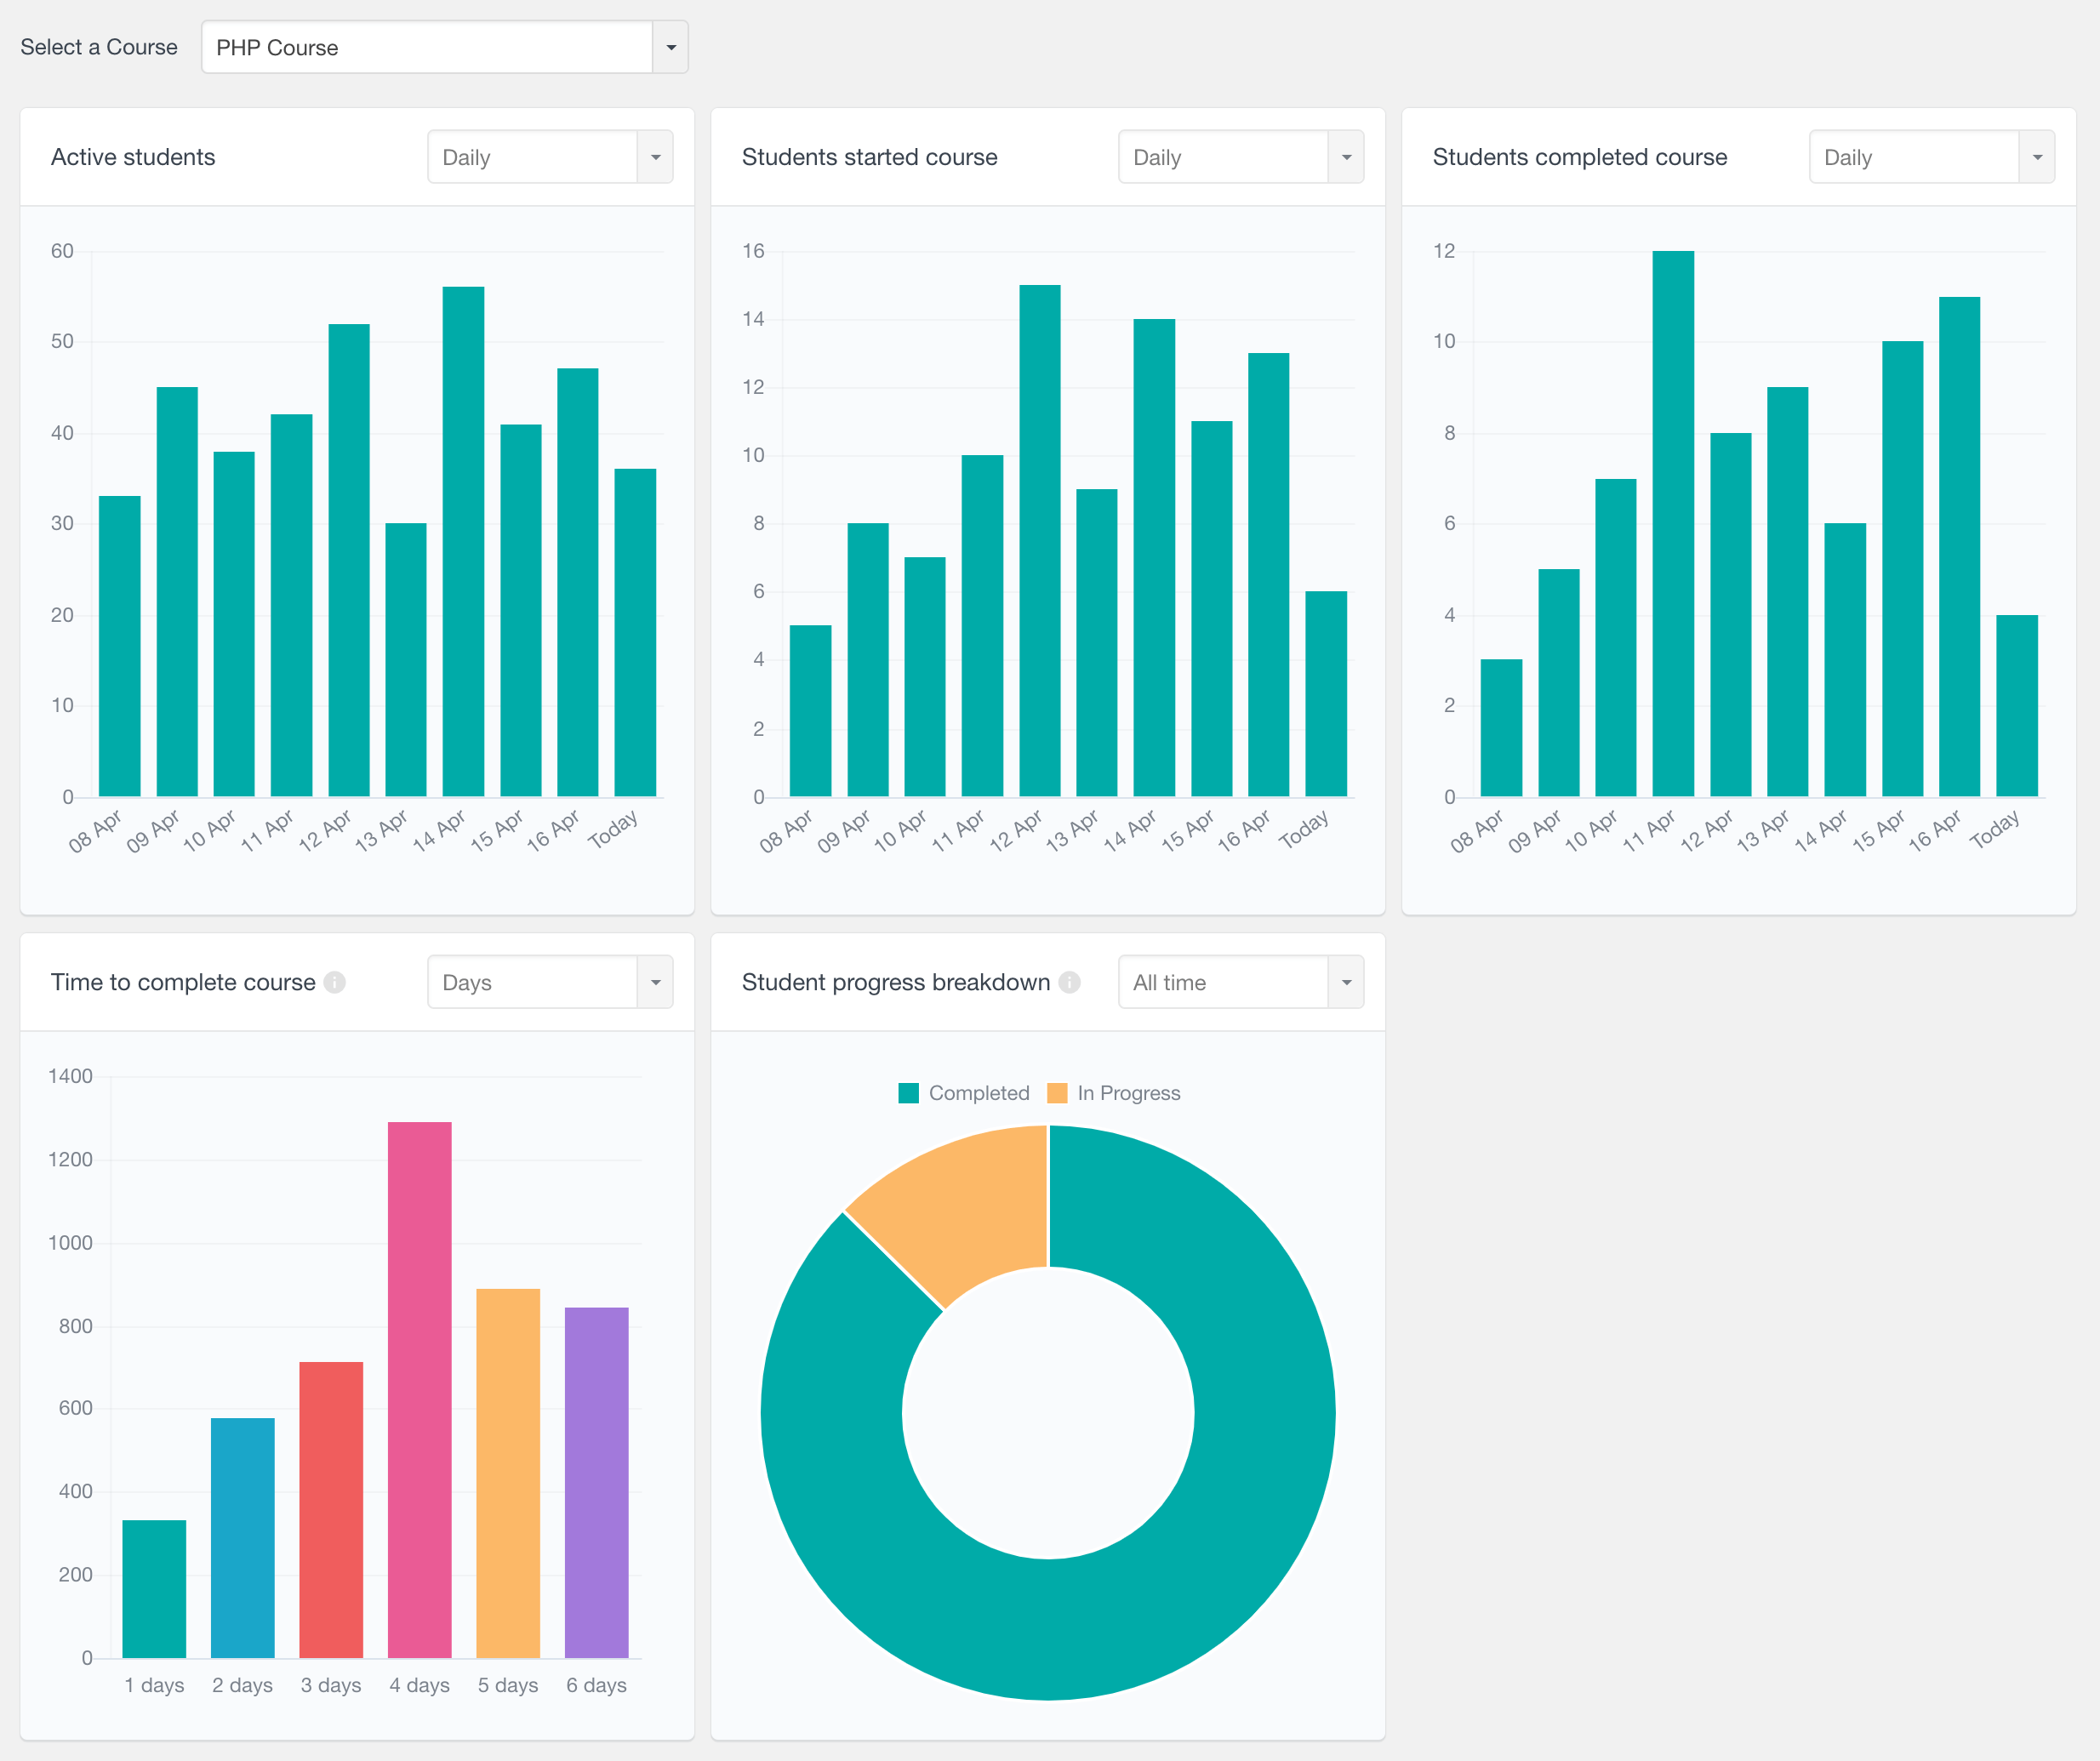
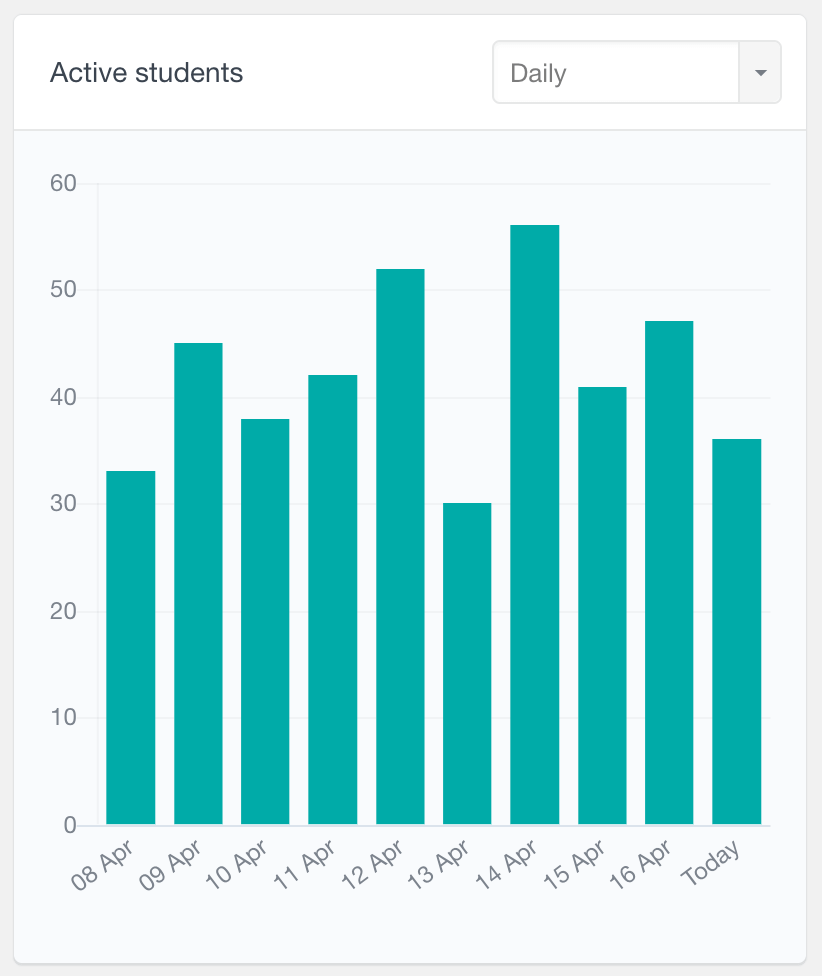
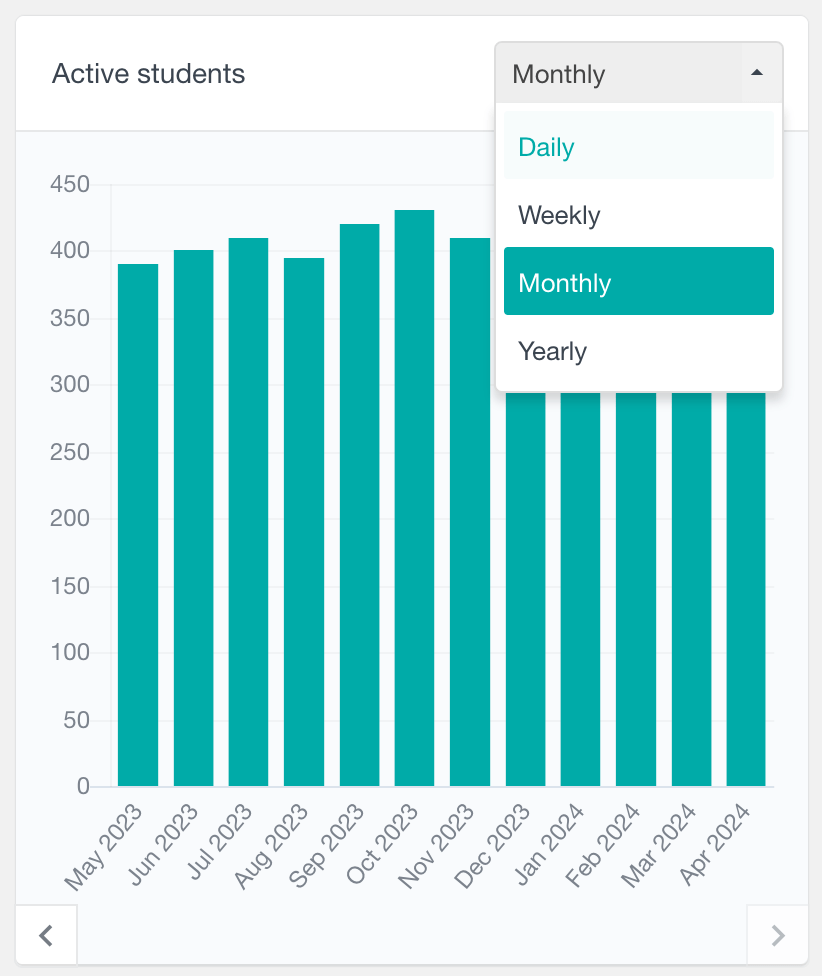
LearnDash Active Students in Course Report
The Active Students report displays the number of active students over time for the selected course. It captures data on course activity and any interactions with quizzes, lessons, and topics within the course. You have the flexibility to view this information at daily, weekly, monthly, or yearly intervals, and you can scroll back through time to analyze past trends.
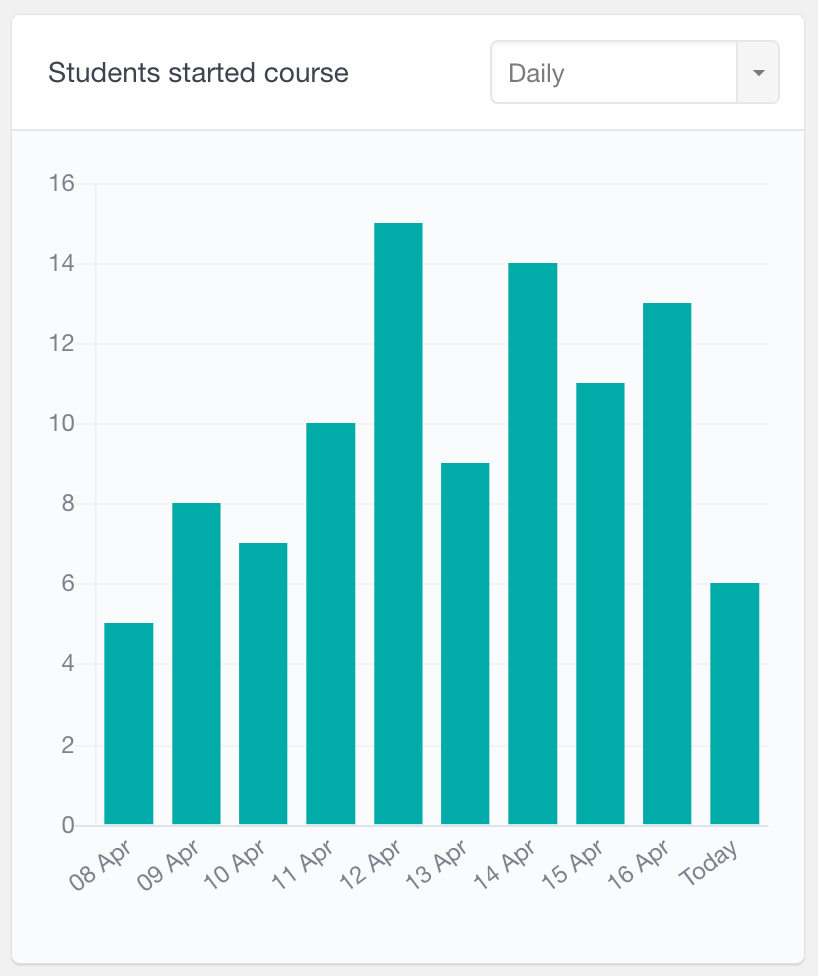
LearnDash Number of Students Started Course Report
In the course reports feature, you also have access to the Number of Students Started Course Report. This report allows you to track the number of students who have initiated the LearnDash course over a specified timeframe. As a periodic report, it allows you to explore the course data in different intervals and timeframes. This report is particularly useful for understanding the initial engagement level of your course, helping you assess how well your course signup and enrollment strategies are working.
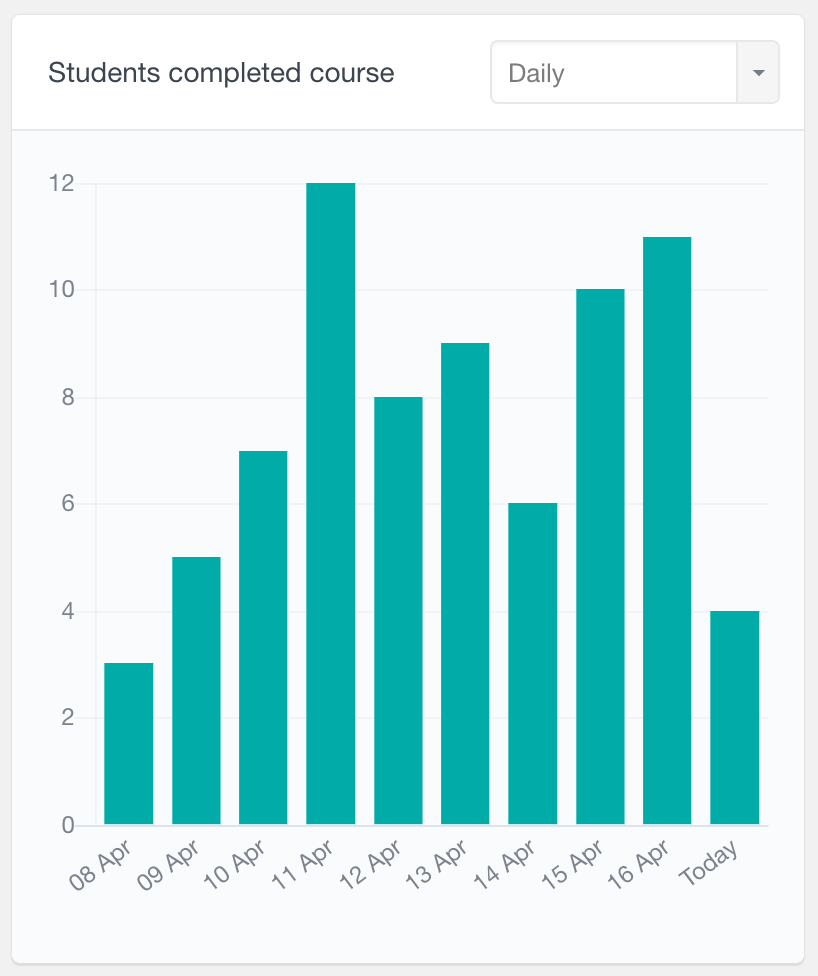
LearnDash Number of Students Completed Course Report
The Number of Students Completed Course Report is available to track course completion rates over selected time intervals – daily, weekly, monthly, or yearly. It provides a measure of how many students are reaching the end of your course successfully. This data can be a good indicator of the quality of your course content and its difficulty level.
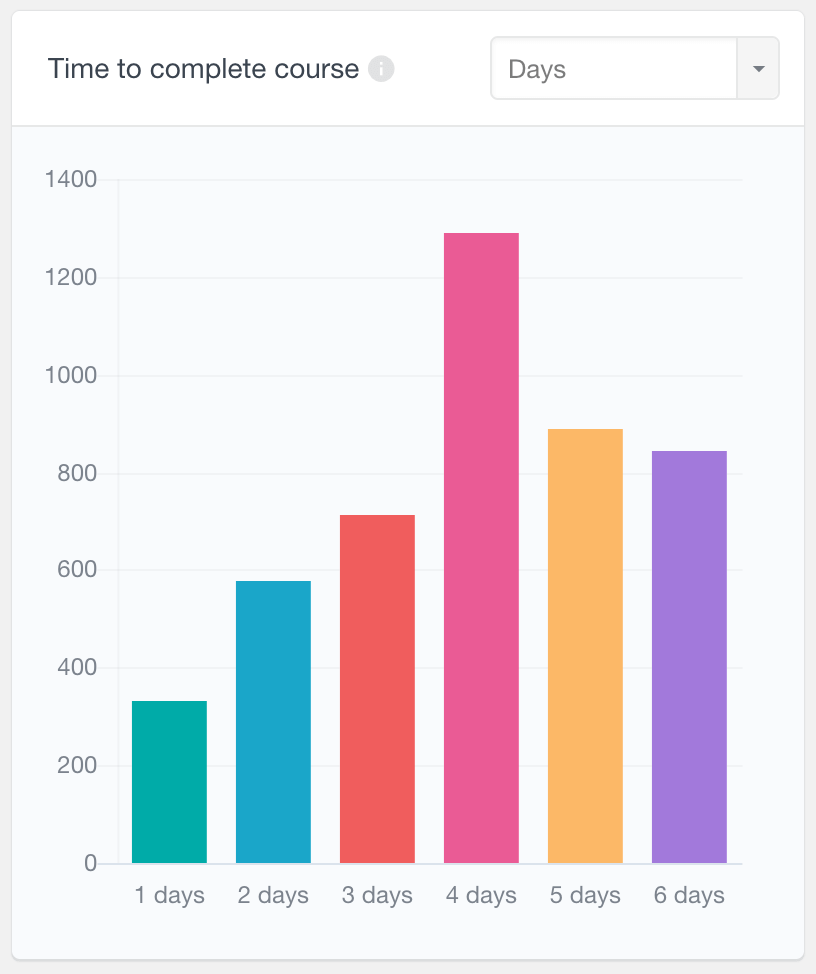
LearnDash Time To Complete Course Report
The LearnDash Time To Complete Course Report shows the average time students take to complete a course. It presents this information in the form of a distribution chart, categorizing the data into different time intervals. By default, the report displays results in days, but you have the option to adjust the measurement to hours, weeks, or months. This flexibility is particularly useful for managing courses of varying lengths and difficulty levels. By analyzing these time distributions, you can better understand the pacing of your courses, and adjust course timing or content as needed to optimize the learning experience.
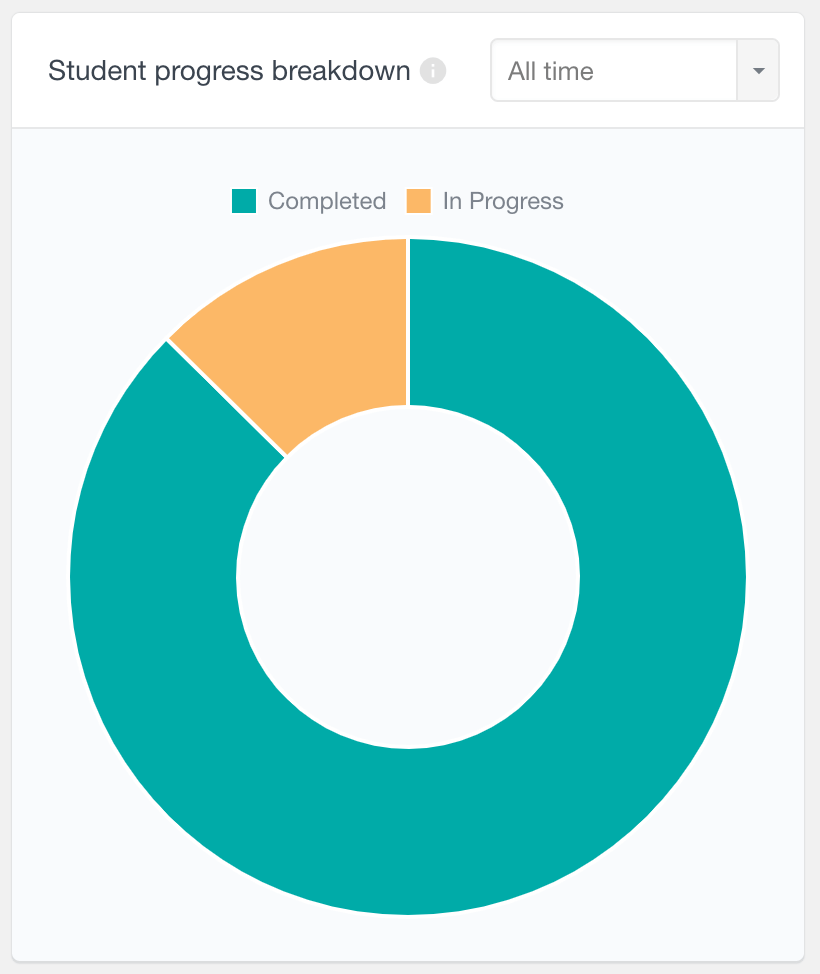
LearnDash Student Progress Breakdown Report
The Student Progress Breakdown Report provides a visual pie chart showing the proportion of students who have completed the LearnDash course versus those still in progress. By default, this report includes course progress data for all students, but you have the option to filter it based on the date students started the course. This filtering allows you to view progress data specifically for students who began the course within a selected timeframe and can be useful for comparing completion rates over different intervals. This analysis can also help you understand the effectiveness of any changes made to the course structure or content.
More Reports For LearnDash
In addition to the LearnDash course reports discussed on this page, Users Insights also provides additional LearnDash reporting tools:
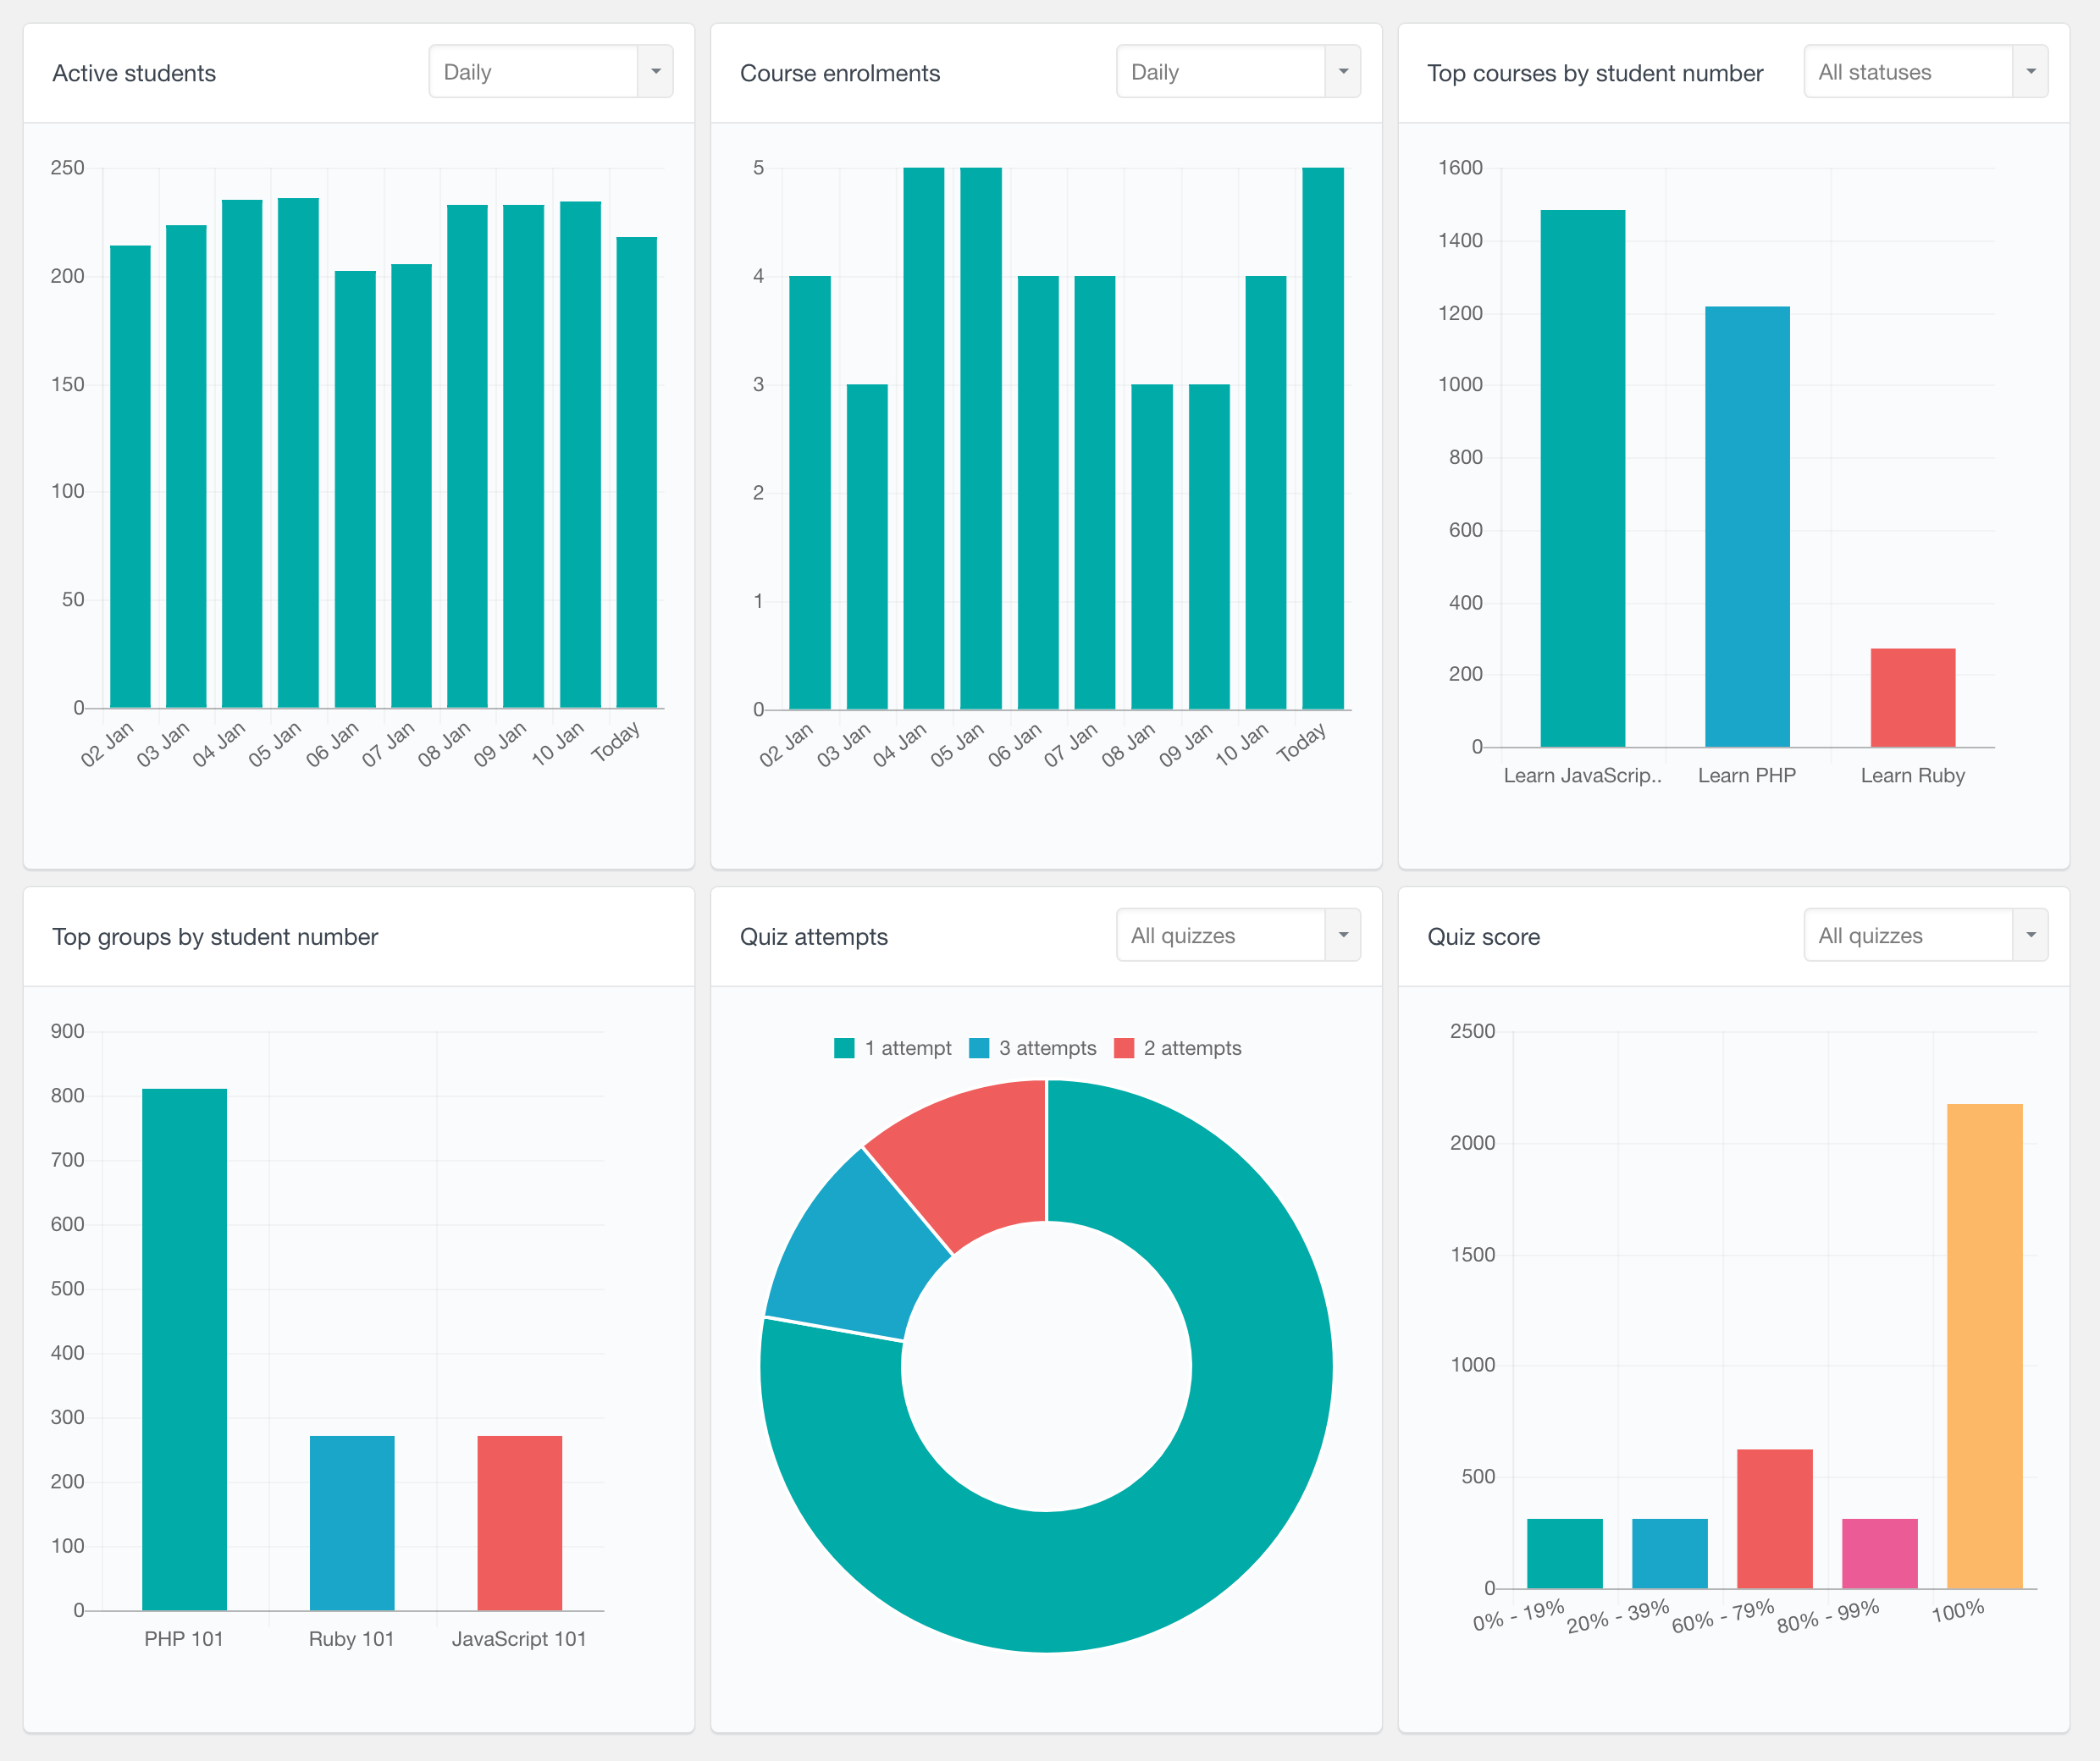
General LearnDash Reports
Provides overall student activity reports for your LMS website, highlighting the most popular courses, leading groups, and general activity across all courses and quizzes. For more information, visit the LearnDash Reports page.
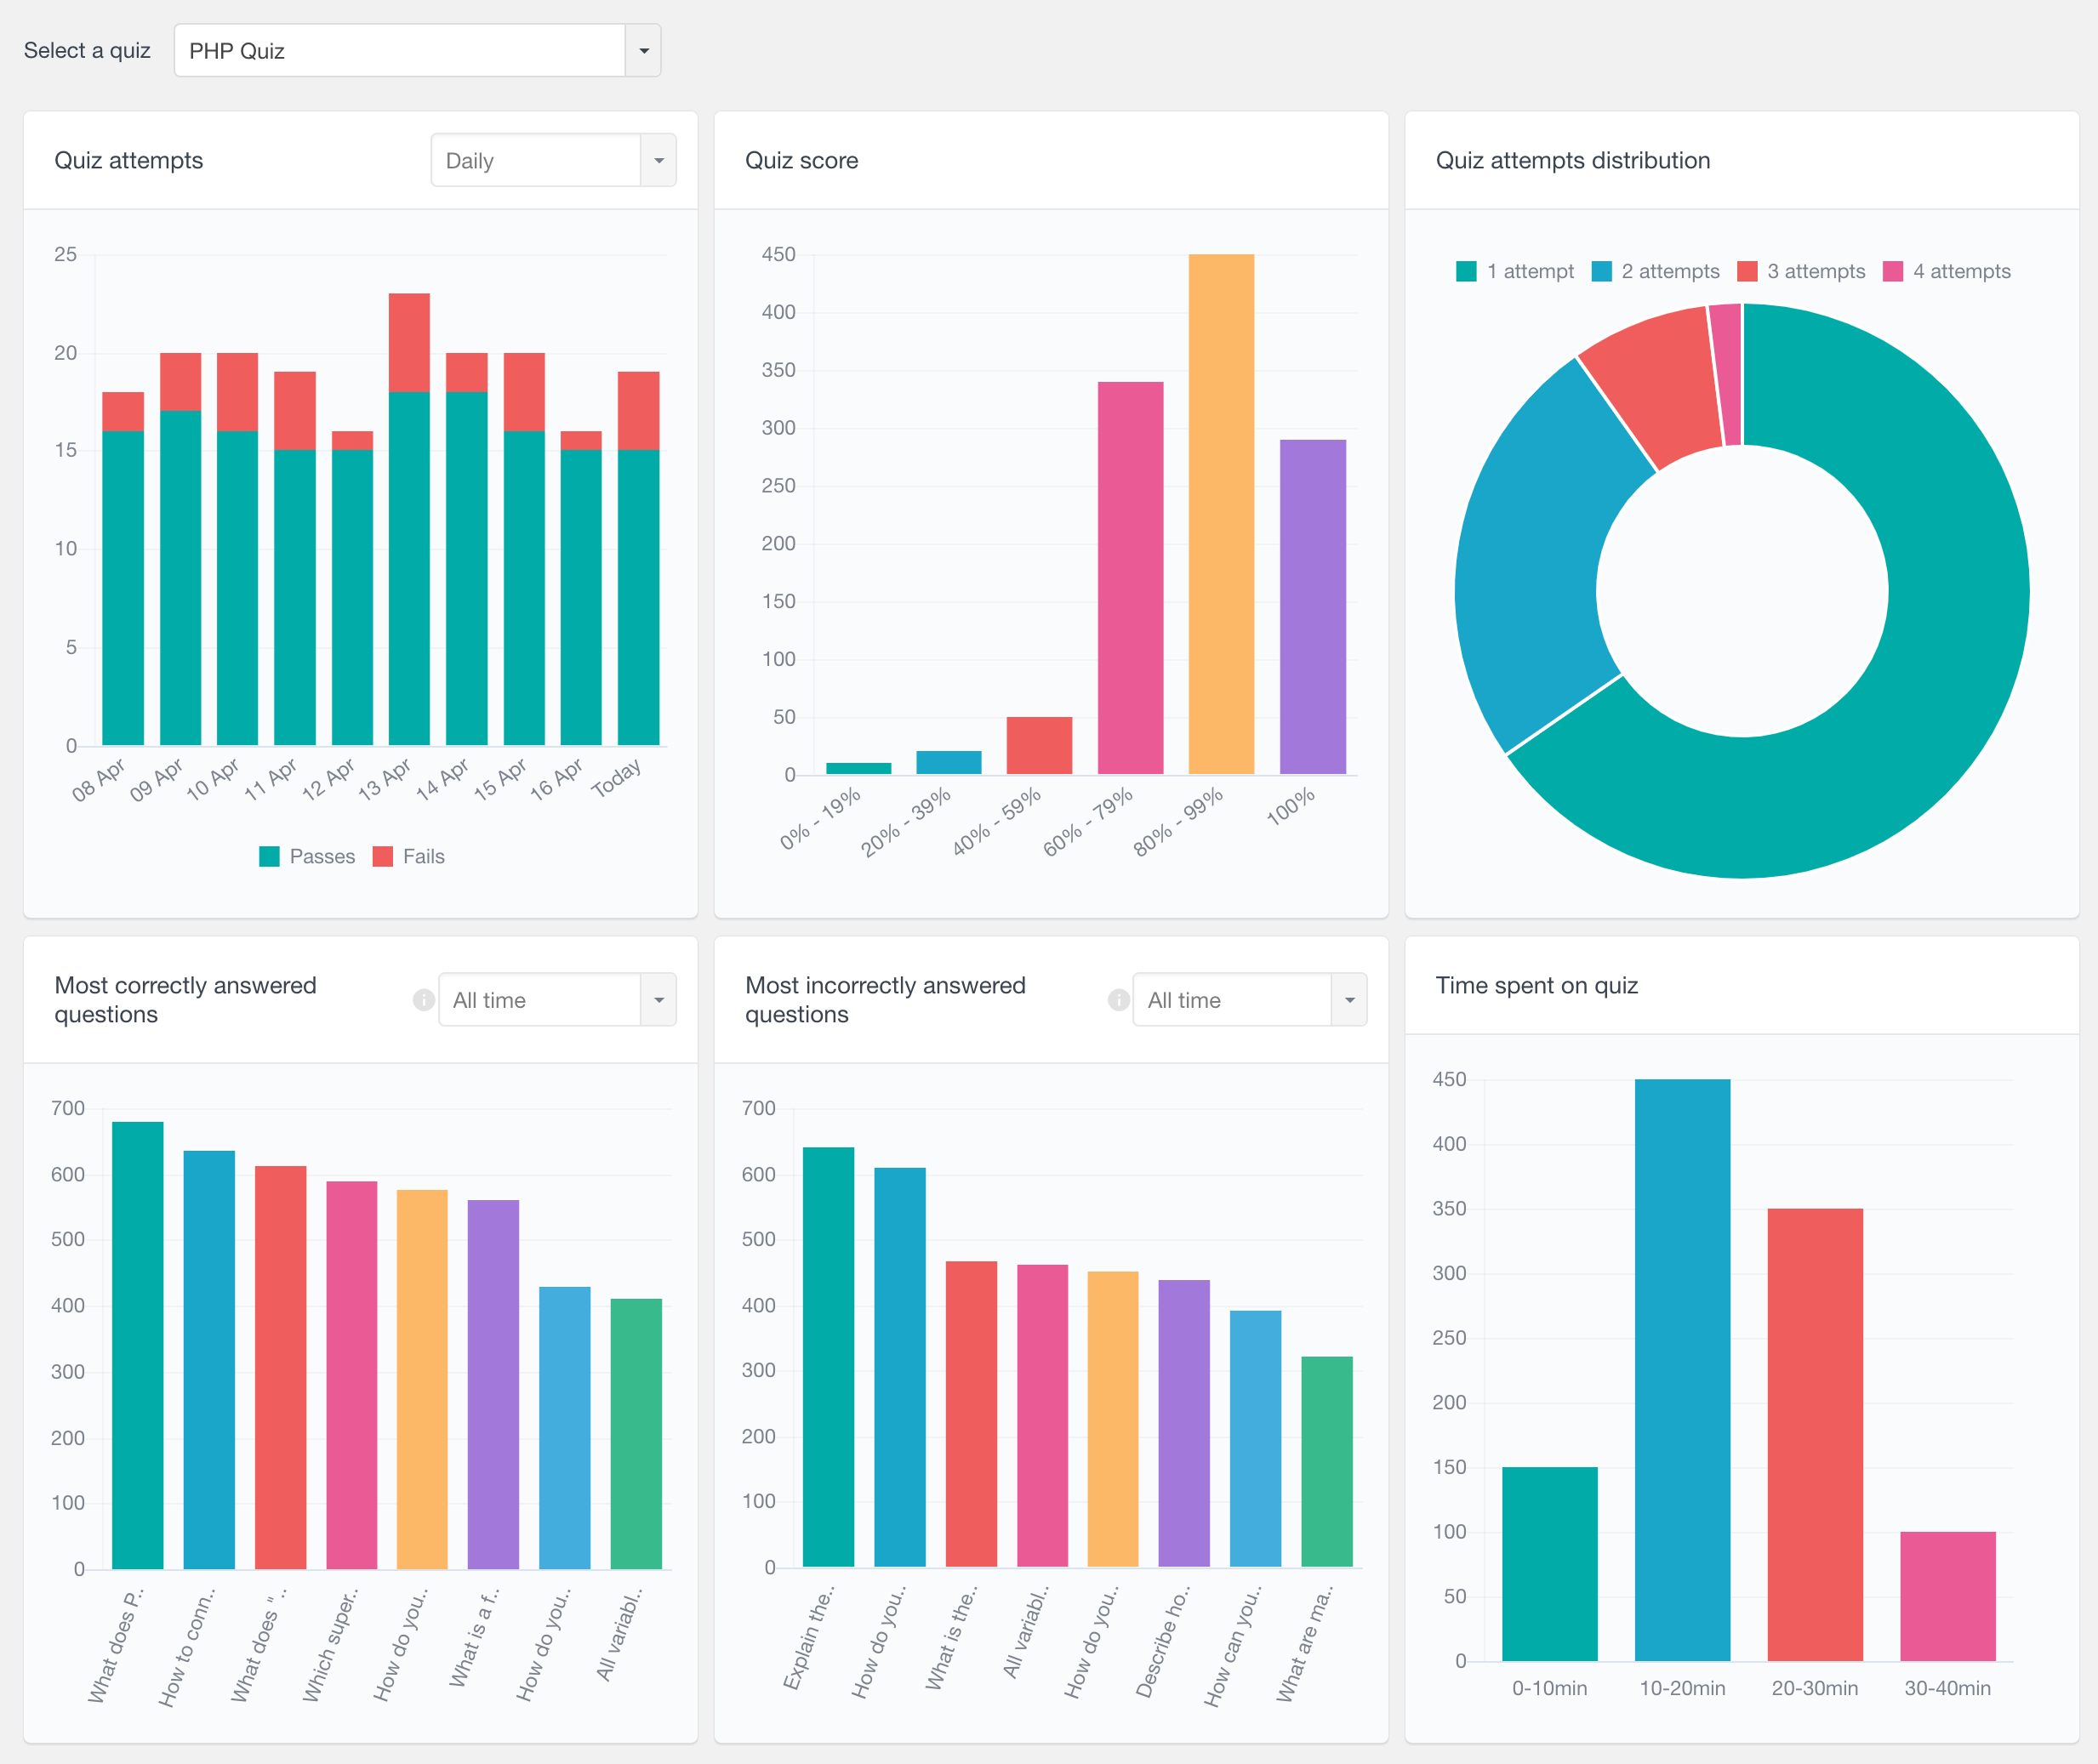
LearnDash Quiz Reports
Quiz-specific reports, providing information on quiz activity, such as quiz attempts (passes vs fails), most correctly/incorrectly answered questions and time spent on quiz. You can read more on the LearnDash Quiz Reports page.
LearnDash user table, filters and profiles
The Users Insights user table can be useful to explore the individual student details and activity. It also provides various filters, allowing you to segment the LearnDash students by various criteria. Find out more on the LearnDash User Data page.