The Ultimate Member module of Users Insights includes a Reports feature that visualizes the available user data with charts.
Your Ultimate Member website stores a wealth of data about your members like their profile data, their activity and their interactions with your website. The Users Insights Reports collect and unite this data into a single place from where you can get a bird’s-eye view of your membership website. With the help of reporting and analytics you can see where your business is growing and where it needs a little more attention. By using your data to create your own membership management reports you can make smarter and better choices that will make your membership website thrive.
Here is how it works. Users Insights automatically detects all of the Ultimate Member user forms. Then for each form, it finds the fields that can be visualized in a chart. These fields are mainly the ones that provide a set of options to select from. For example, this could be the radio and multi-select fields, numeric fields are also supported. Then Users Insights detects the user data for each field, groups in based on the options selected by the users and creates a chart based on the data.
Let’s see which field types are detected by the Ultimate Member Reports feature and how they are represented.
Radio field reports
With the Ultimate Member radio fields, the users have a set of options where they can choose one option only. Radio fields are usually used when there is a small number of options to choose from.
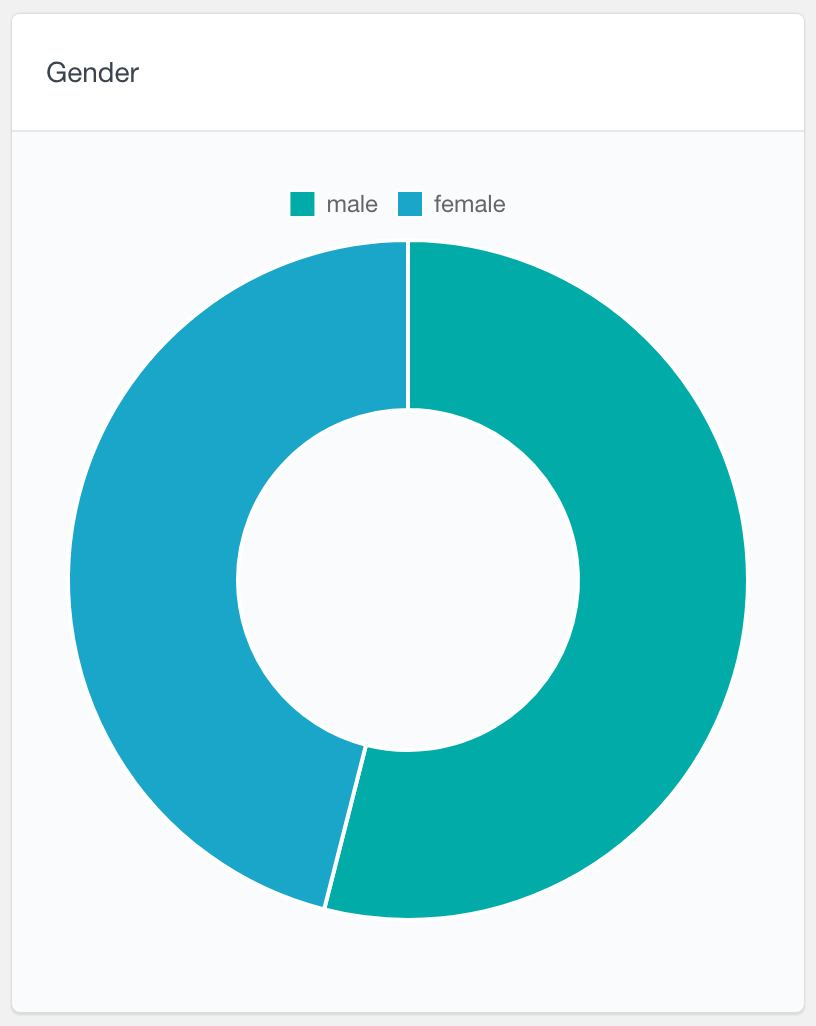
Users Insights visualizes the radio fields data in the form of a pie chart. It analyzes the stored user data and counts how many times each option has been selected. With this report, only the options that have been selected are displayed. This means that if there is an option that no one has selected, it won’t be visible on the chart.
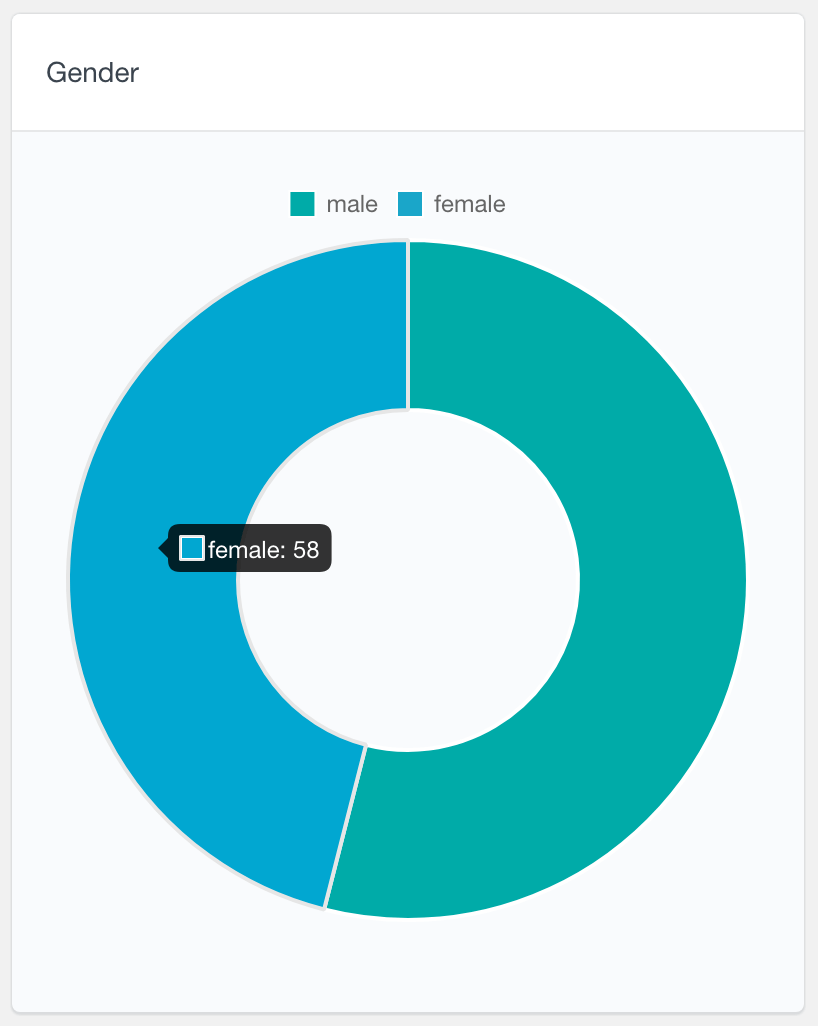
Here is an example of an Ultimate Member radio field chart where the users can select their gender. As shown on the second screenshot, hovering each slice of the pie chart shows how many users have selected this option:
Drop-down field reports
The Ultimate Member drop-down fields are very similar to the radio fields. With this type of field the users can choose one option, from a drop-down list. This field type is usually preferred over radio fields when there is a large number of options to choose from.
Similarly, the drop-down fields are also represented with a pie chart. To improve readability, when there is a large number of options, Users Insights would only show the top several options on the pie chart and group the rest of them under an “Other” section. In this way, if you have hundreds of options for example, they wouldn’t overcrowd the chart and only the most popular ones would be displayed.
Here is an example of a drop-down field report where the users can choose their freelance availability. The second screenshot shows how you can exclude values from the report – you can do this just by clicking on the labels of these values.
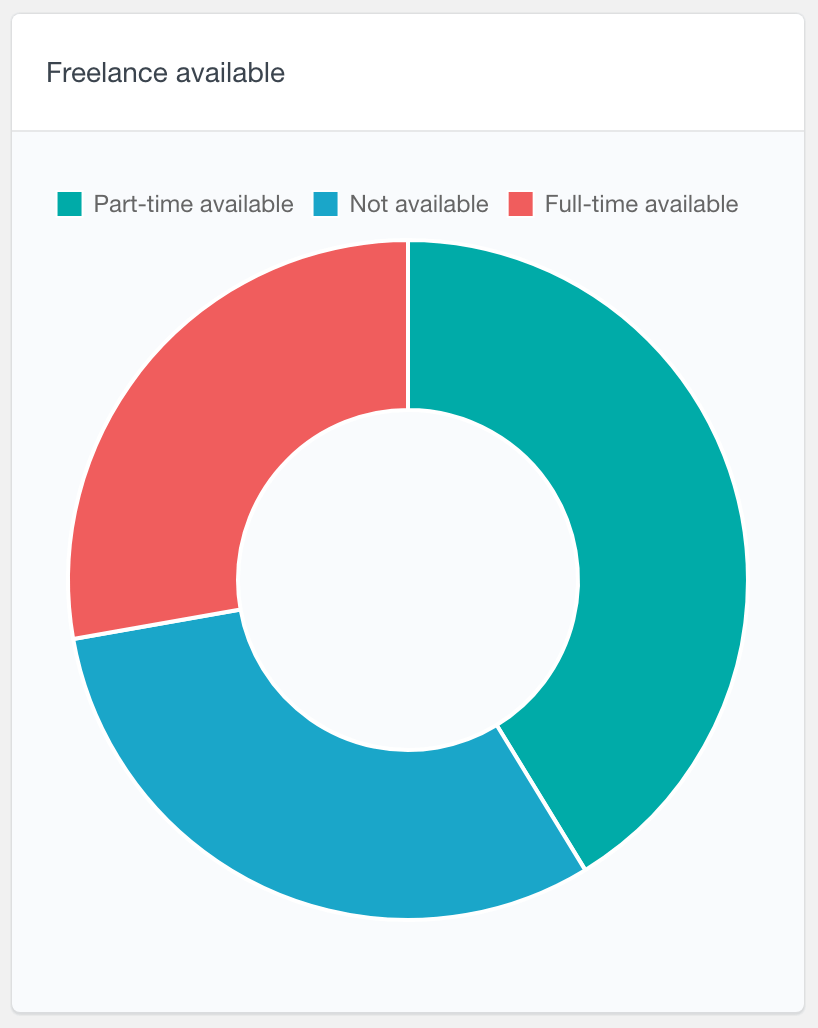
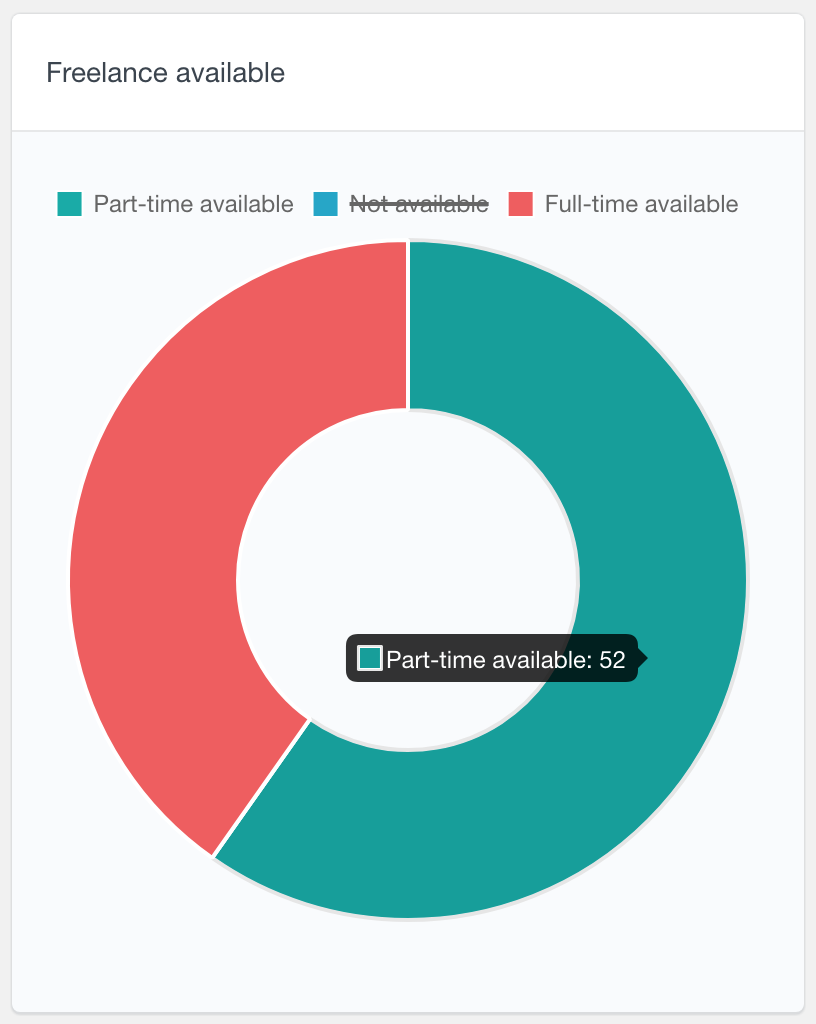
Excluding values from the report can be useful if you’d like to compare a set of values. With the examples above, the three sections look almost similar however when we exclude one one of the values, it becomes more obvious that one of the slices is a lot bigger than the other.
Multi-select field reports
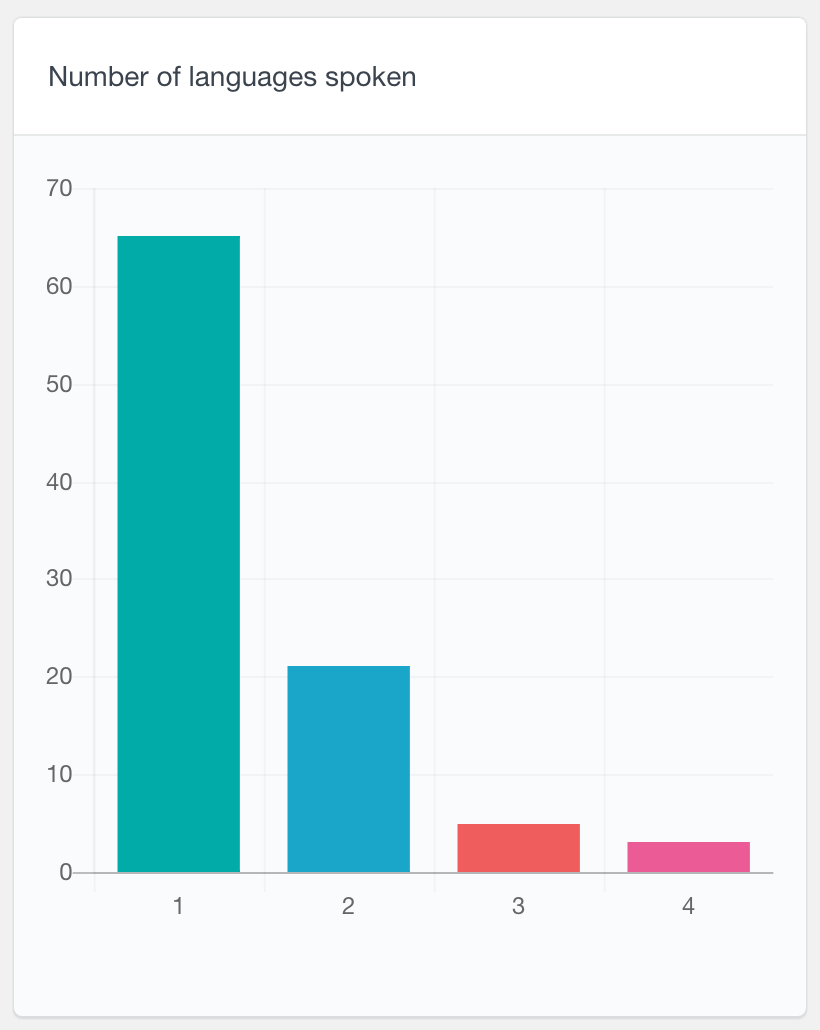
With the Ultimate Member multi-select fields, the users can choose multiple options from a list of options. Users Insights reports these fields’ data in the form of a bar chart. It first calculates how many times each option has been selected. Then it orders the options by the most popular ones. The top several options are displayed and the rest are grouped under an “Other” section.
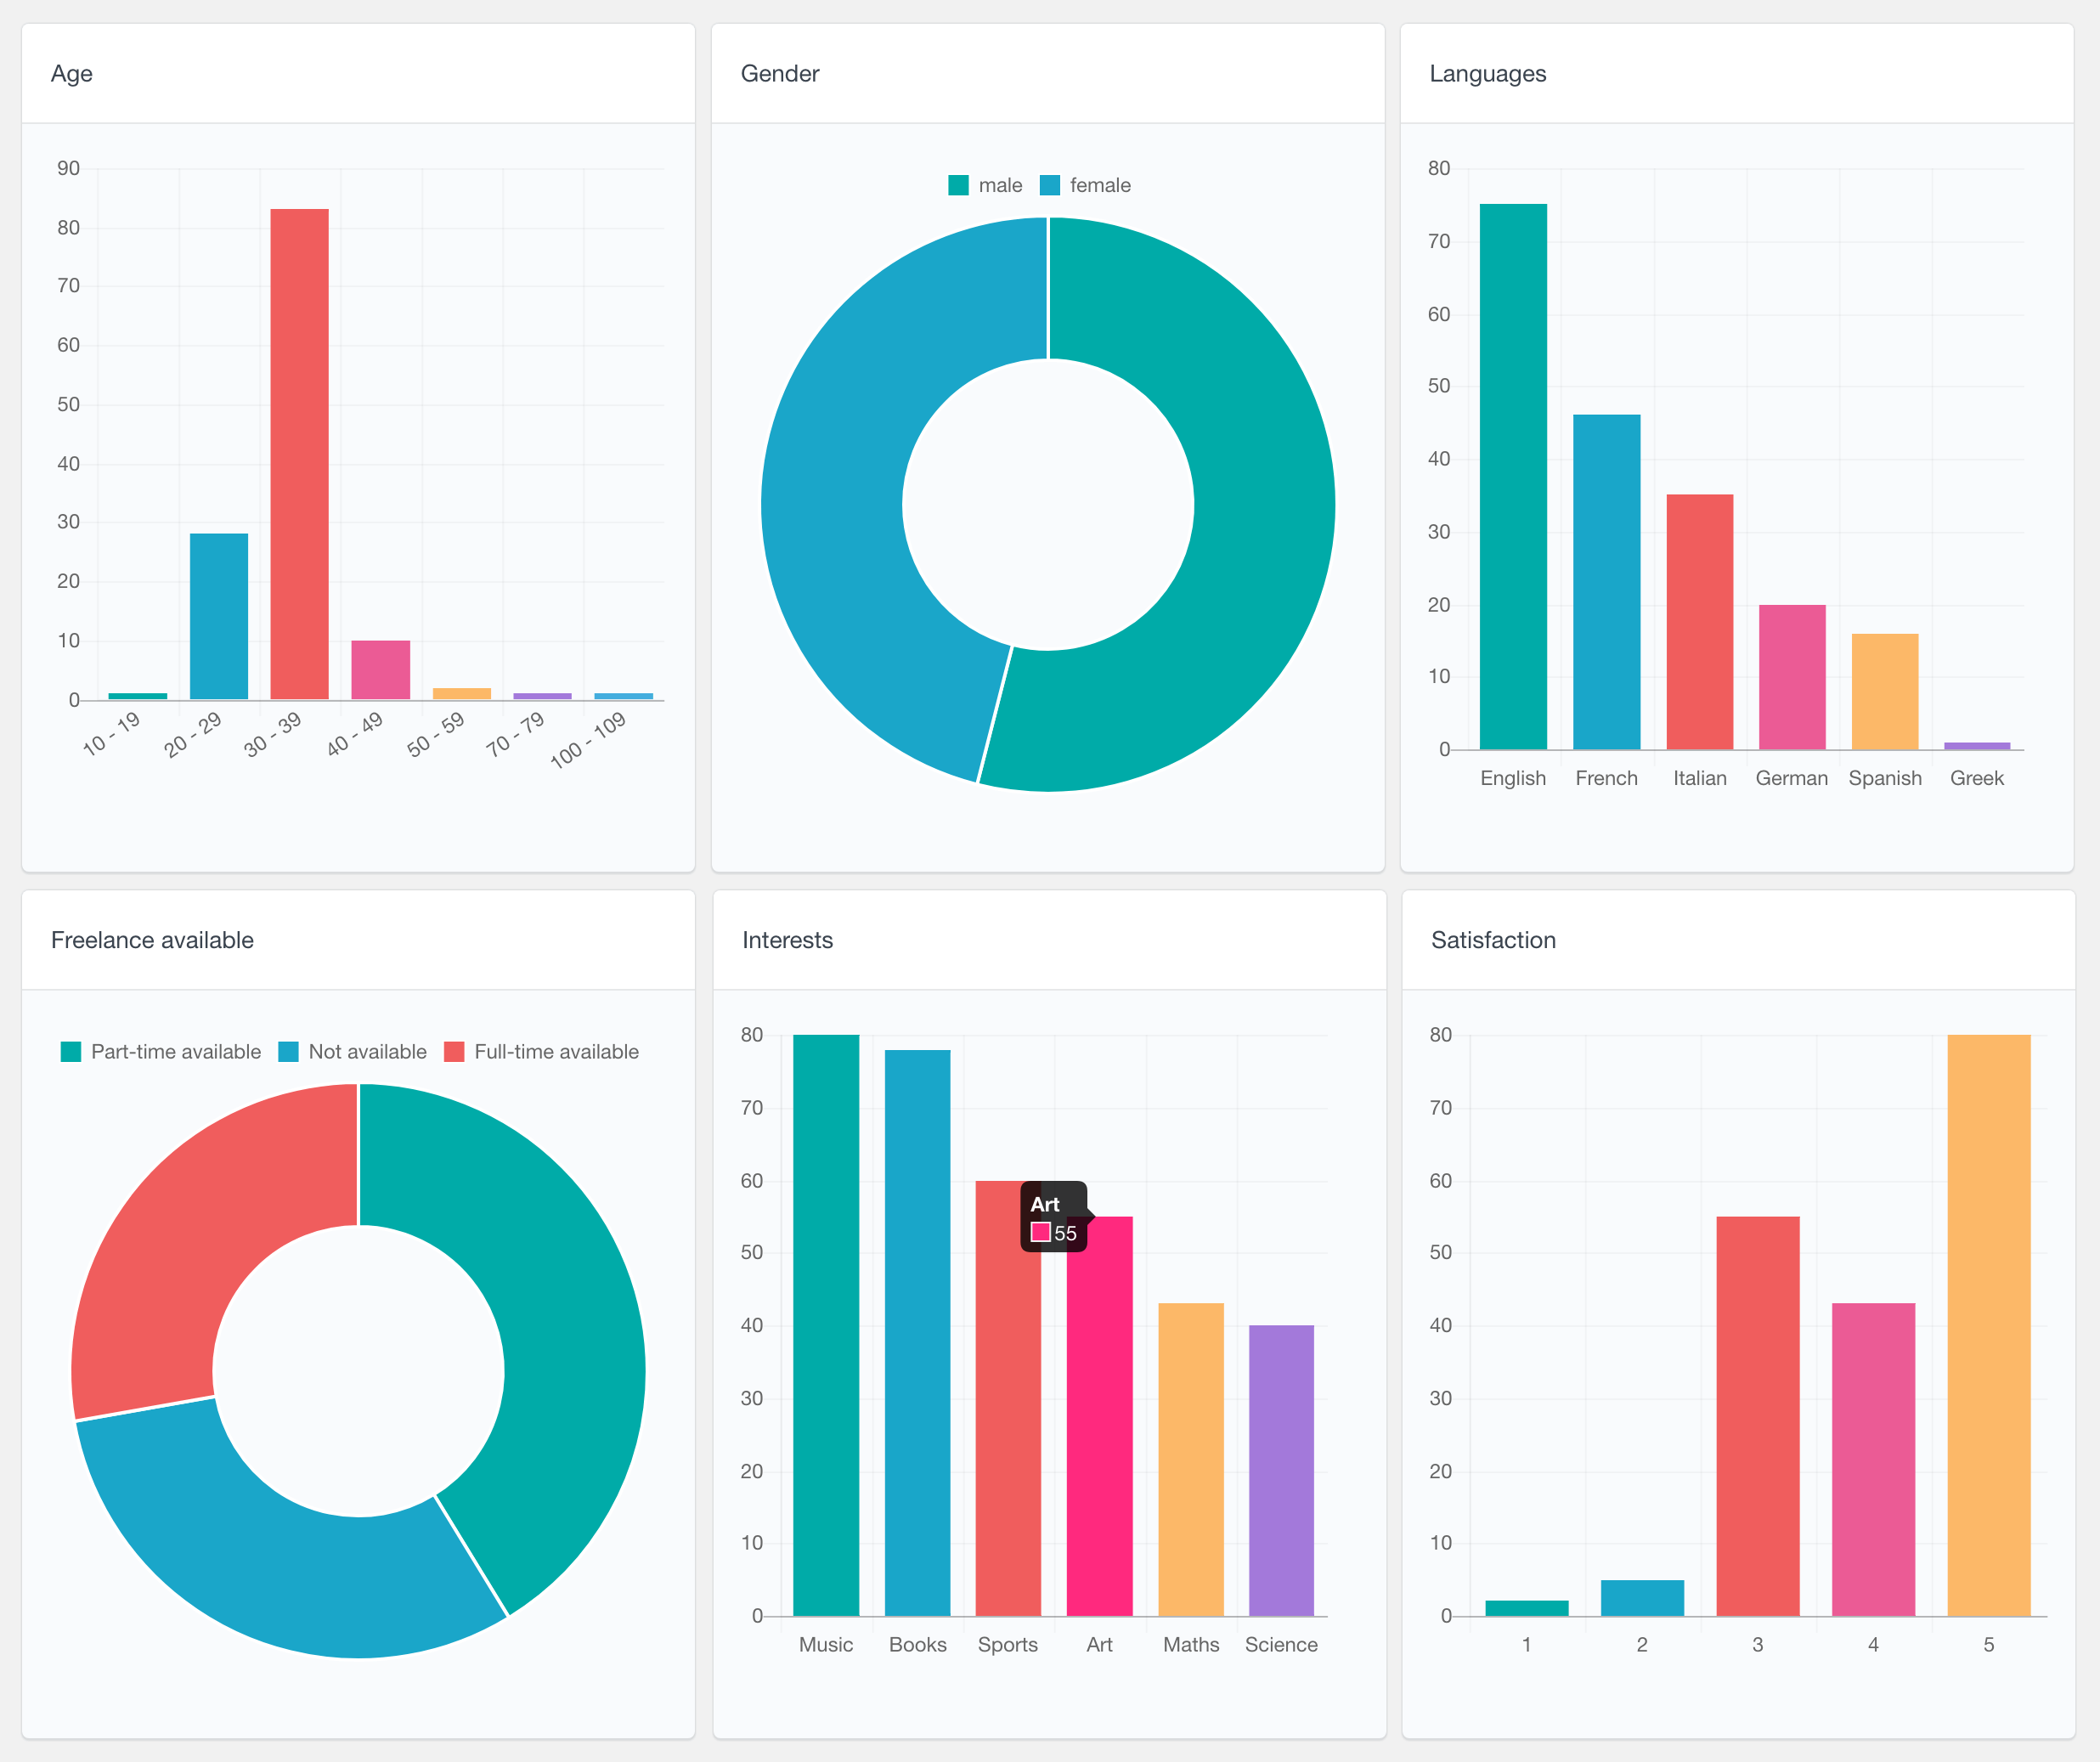
Here is an example showing the reports from an Ultimate Member Languages field. With this field the users can choose which languages they speak. As you can see on the graph, they are sorted by the most popular ones:
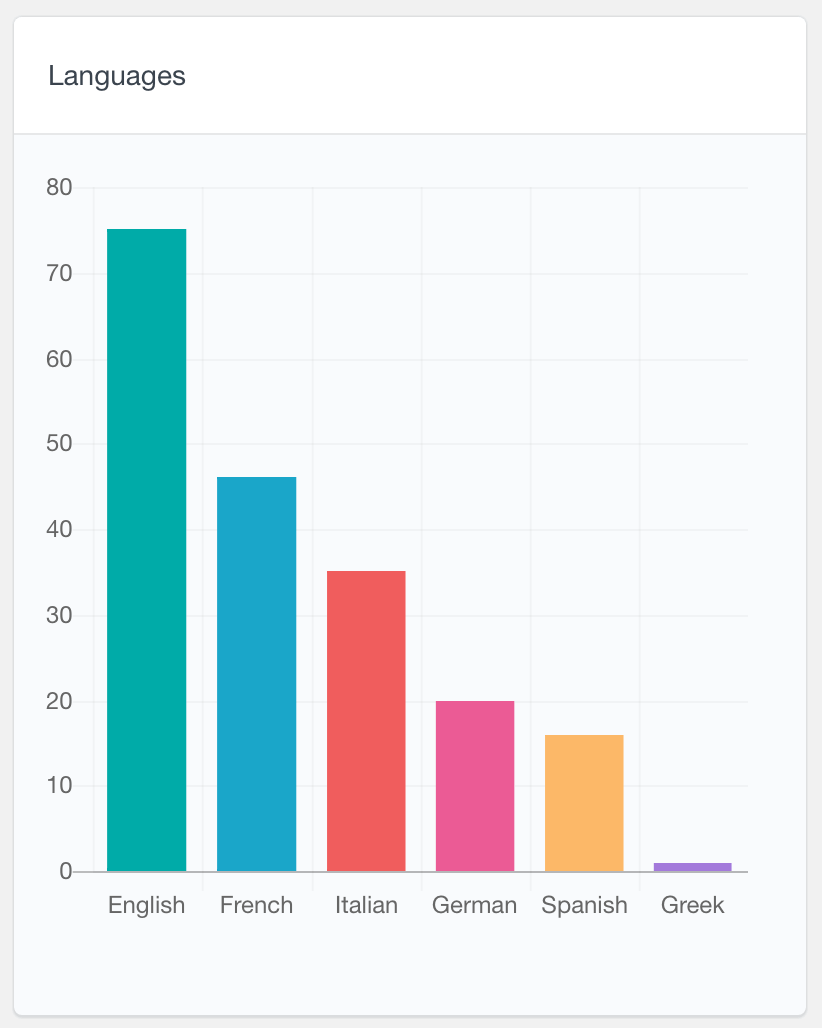
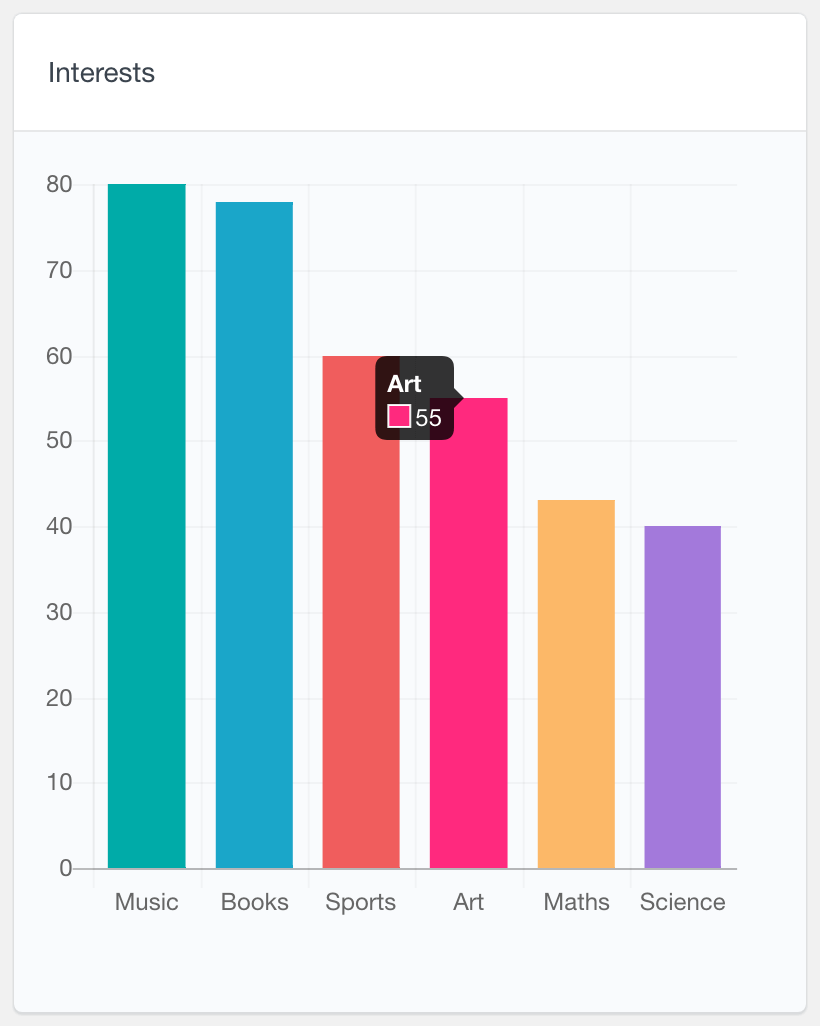
The scale on the left indicates the number of users who have selected the option. Hovering each of the bars also shows the exact number.
Numeric field reports
Another field type that Users Insights makes available in the Ultimate Member reports is the number field. With the Ultimate Member number fields, the users can insert any number. They can however have maximum or minimum limits, based on the field settings.
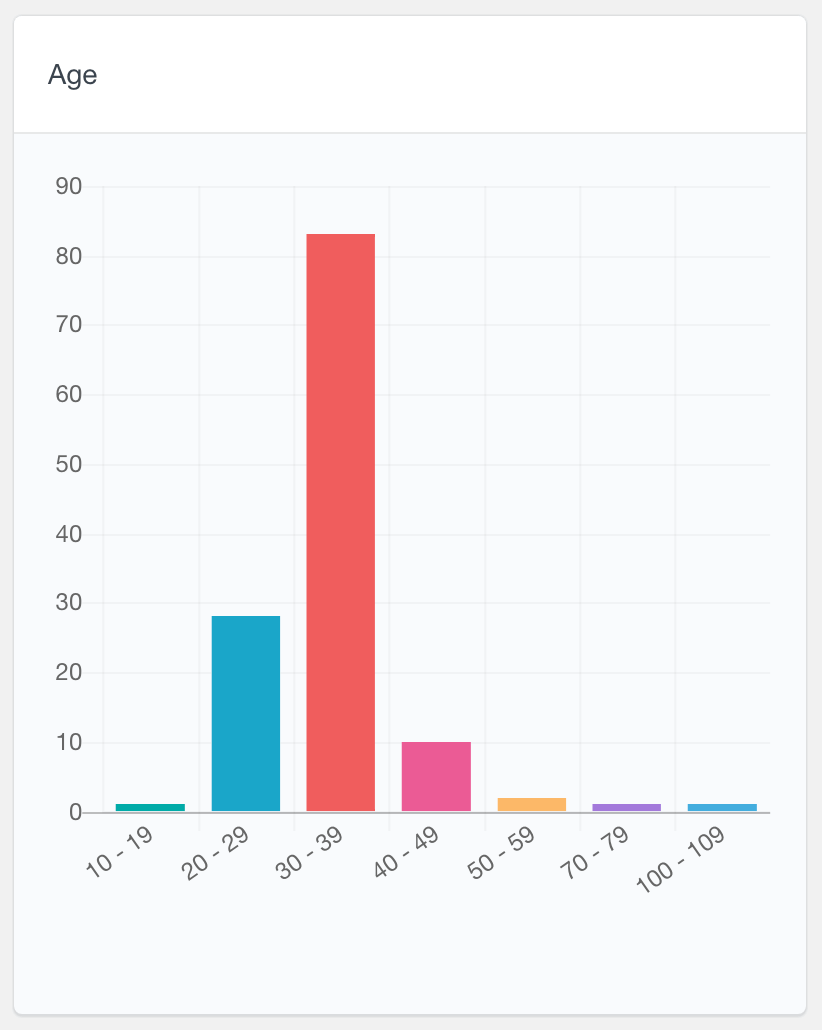
Here is how the numeric field reports work. If the unique values that the users have entered are smaller than the maximum number of bars for the chart (default is 8), each value is represented in a separate bar. If the values are more than that, they are grouped into ranges, showing how many values have been selected for each range.
The first screenshot below shows an example where the users have entered only 4 unique values. The second screenshot is an example of an Age field where the users have entered values ranging from 10 to 109. As you can see, in this case the values are grouped in ranges.
Rating field reports
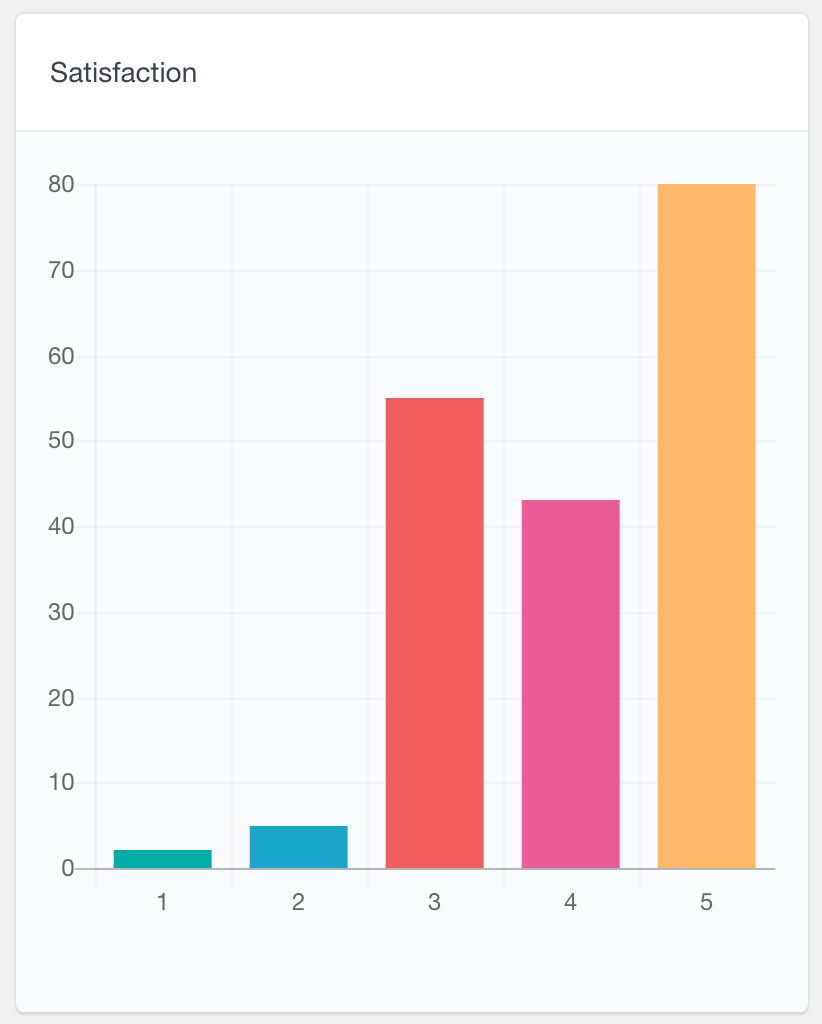
The Ultimate Member rating fields is a star-based widget that allows the users to provide their rating. The way the rating field reports work is very similar to the numeric field reports above. Here is an example of a Satisfaction rating report:
More general user reports
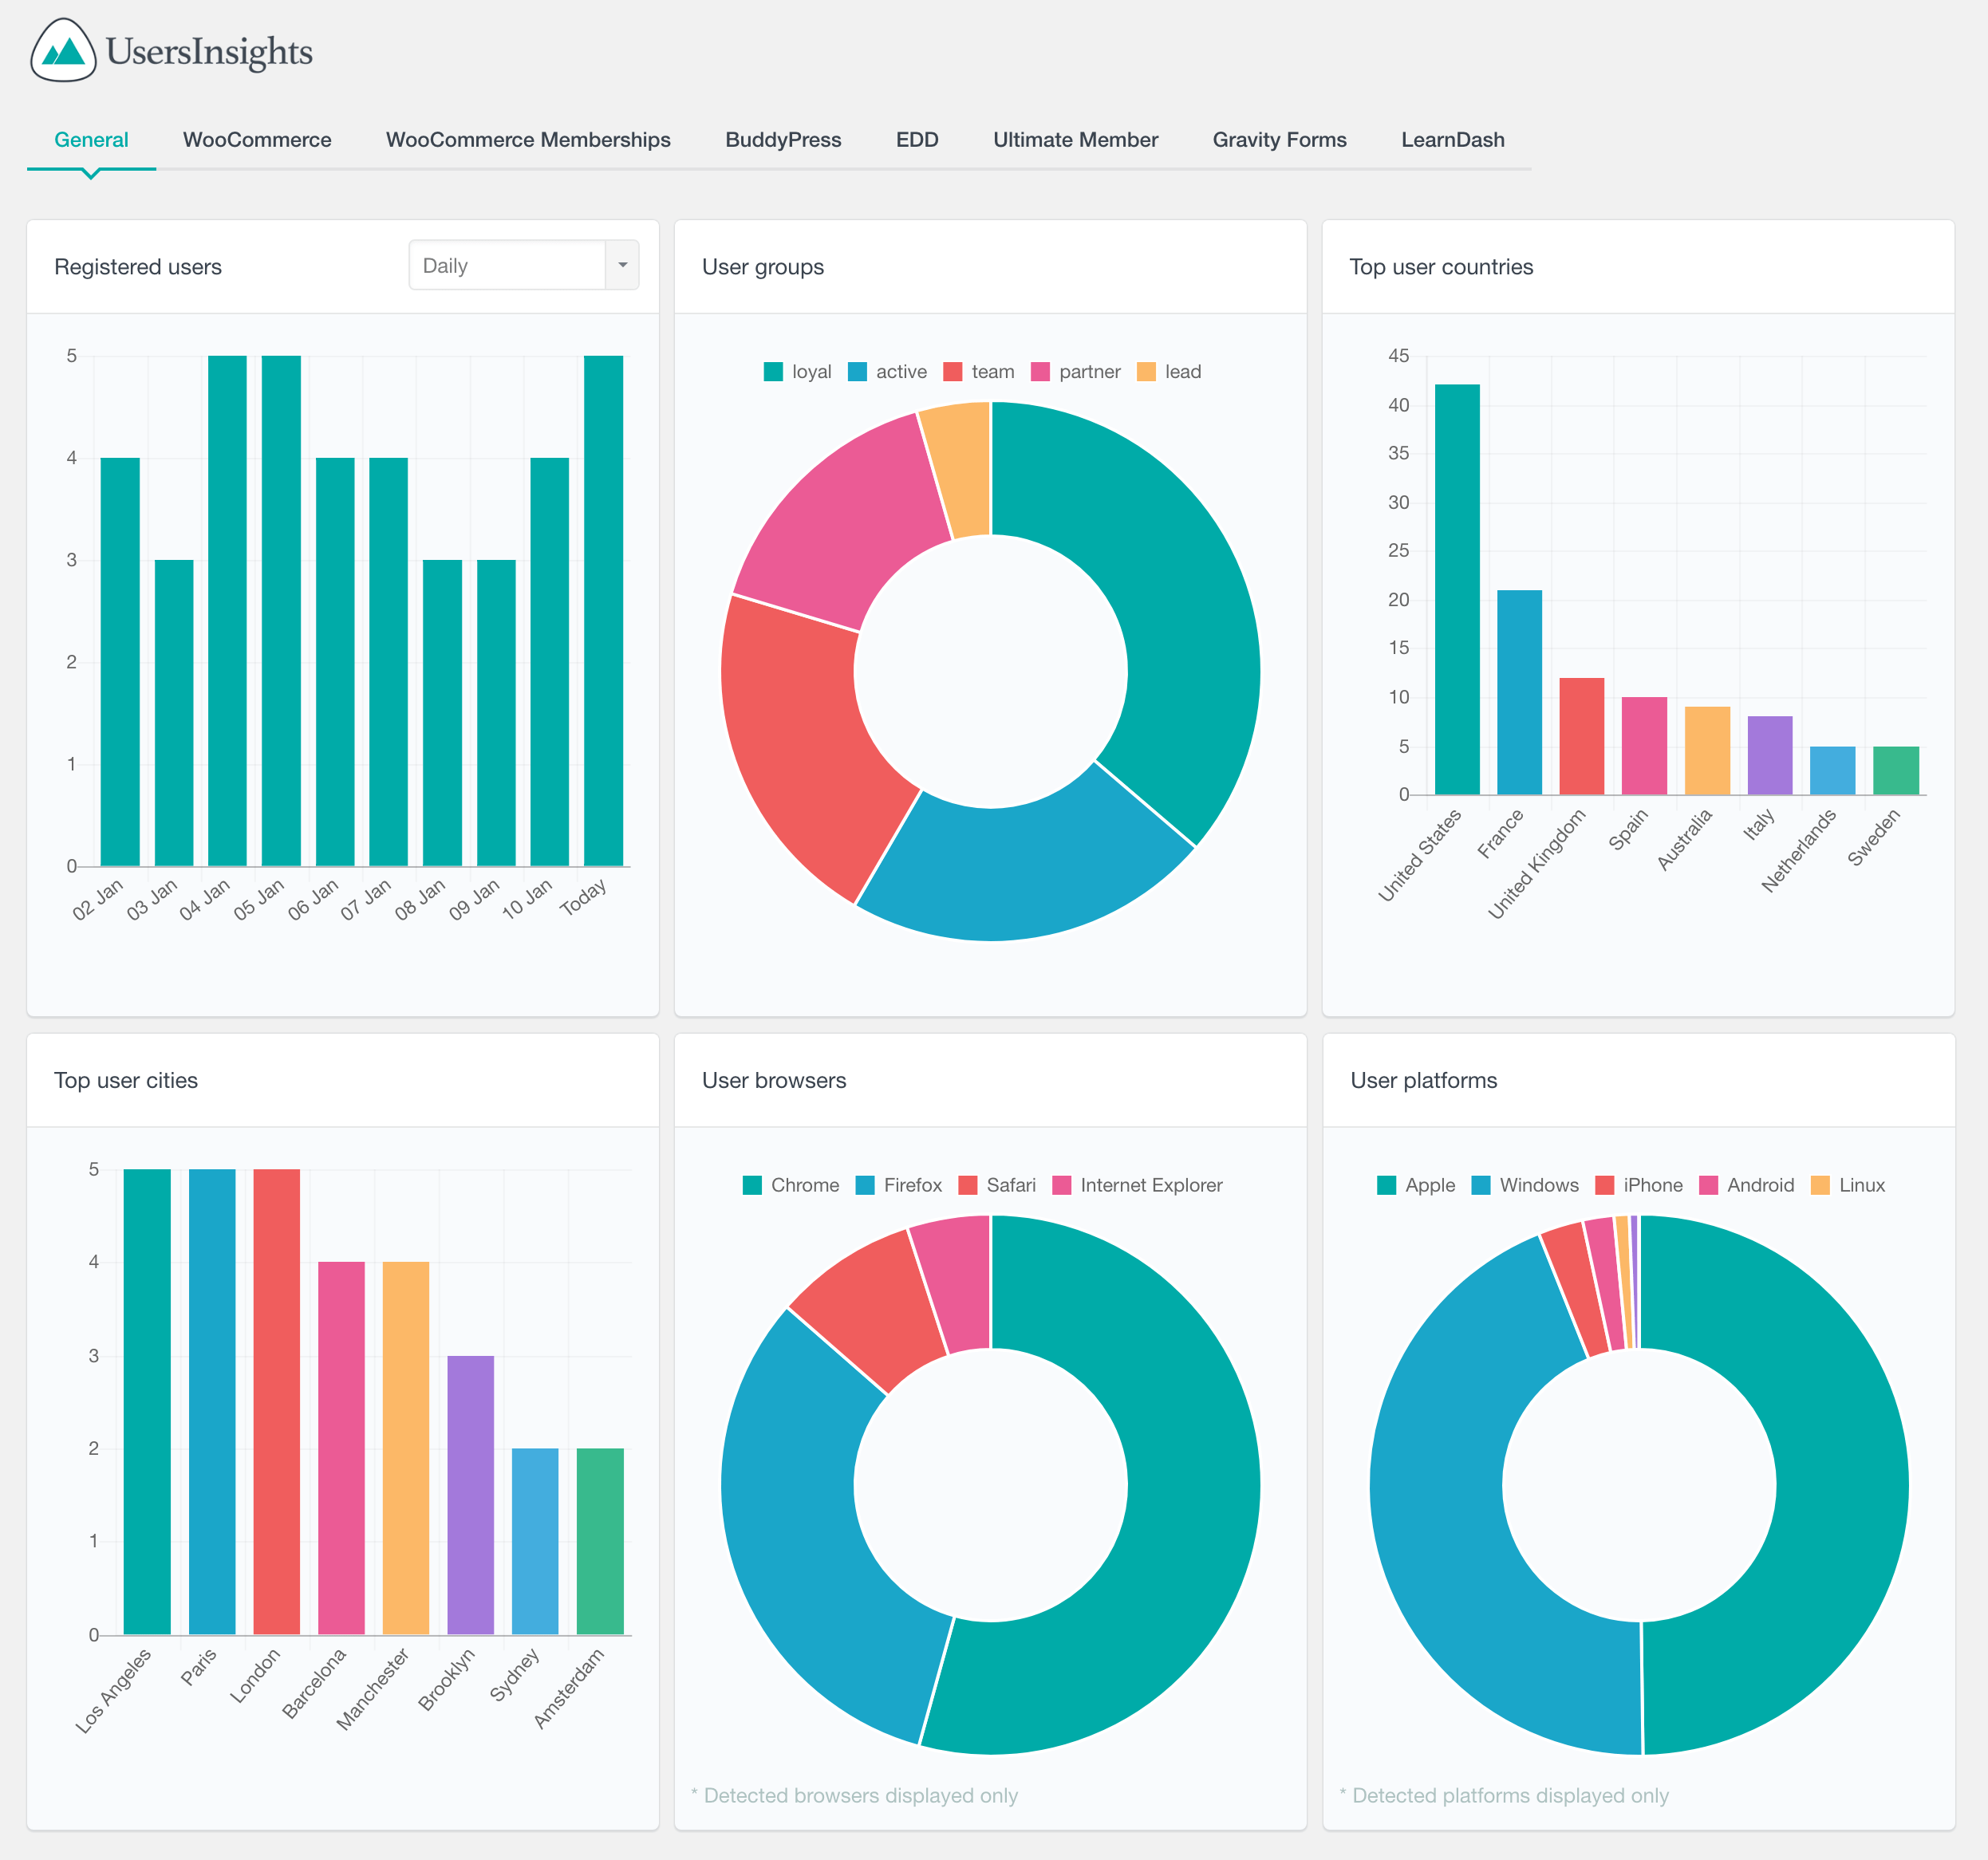
Users Insights also includes a General user reports section. It includes reports of the general WordPress and Users Insights data. For example, there is a number of users registered report which can help you analyze your user base growth over time. It also includes reports for the Users Insights Geolocation, Device Detection and Groups data. For more information, you can visit the Reports page.
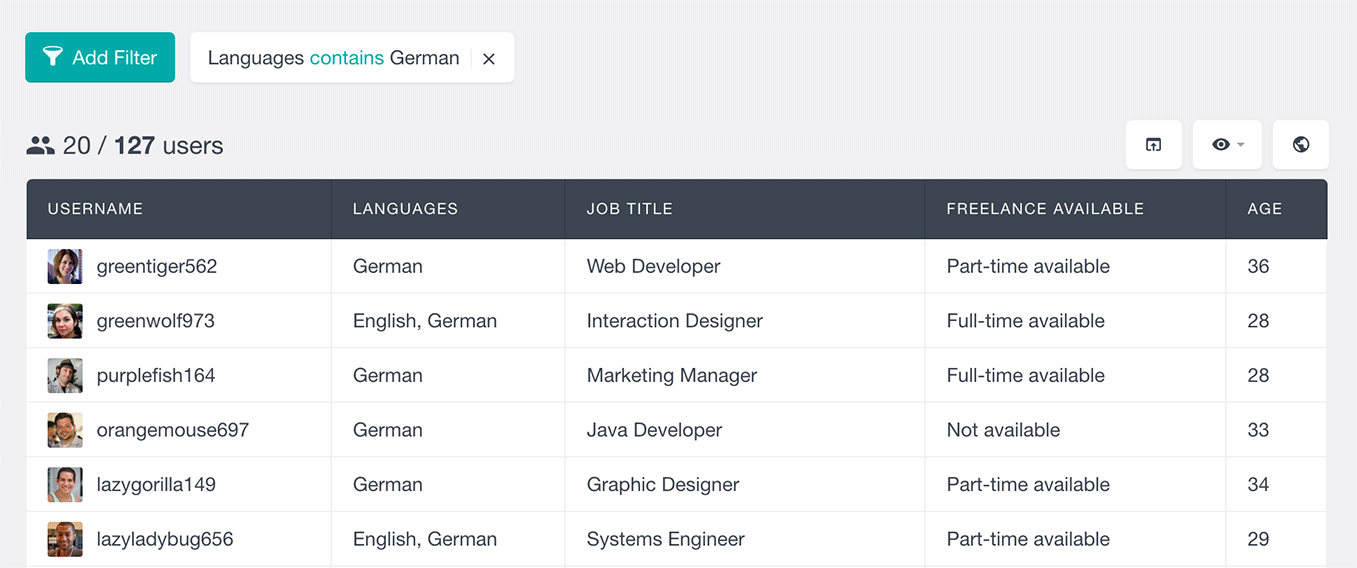
Searching and filtering the user data
Another way to analyze the Ultimate Member user data is by using the Users Insights user table and filters. The user table automatically detects all of the Ultimate Member fields and makes them available as filterable columns. To learn more about all the Ultimate Member filters, you can visit the Ultimate Member module page.