The Gravity Forms module of Users Insights comes with a Reports feature that can help you visualize and analyze your Gravity Forms data. This feature consists of two parts:
- The user-based form reports: First is the user submission report that can show you the most popular forms that are submitted by your WordPress users. The second and more exciting part is reports of your user data, submitted with the User Registration Add-on. This is the data that is directly tied to your users, such as their profile and custom field data. Users Insights automatically detects the Gravity Forms user fields data and generates reports based on the field types. This allows you to create your own personalized Gravity Forms Analytics dashboard.
- General Gravity Forms reports: This is a new feature, introduced in Users Insights 3.9. With this feature, you can enable visual form reports for all of your form entries, including those that are not linked via the User Registration Add-on and those that are submitted by visitors (non-registered users). This feature requires Gravity Forms 2.3 or newer.
1. User-based form reports for Gravity Forms
The user-based Gravity Forms reports can be found in the Users Insights -> Reports -> Gravity Forms Users section. The following reports and sections are available in the Gravity Forms reports dashboard:
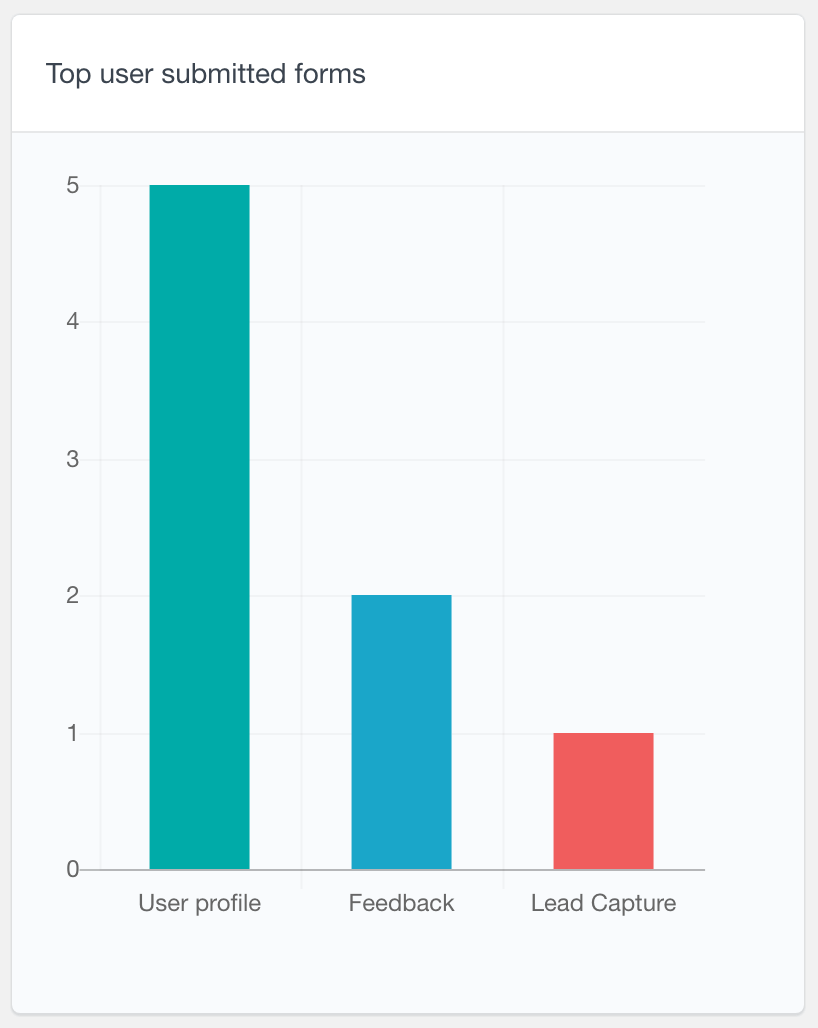
Top user submitted forms report
As its name implies, this report can show you which are the top Gravity forms submitted by your users. This report detects both standard forms and user forms (created with the User Registration add-on). It is a bar chart, where the left axis indicates how many users have submitted the corresponding form.
The Gravity Forms submission Reports can help you understand which forms your users have lost interest in completing. If you have a form that is accessible by both registered users and visitors, you might find that the percentage of users who have submitted the form might be different from what you expected.
For example, if you use Gravity Forms to survey your users, you can use the reports to see what surveys your users respond most to. To increase their submissions, you could email the users who have not submitted this form and perhaps send them some kind of incentive to do so.
Gravity Forms user data reports
As we mentioned earlier, the reports come with a feature that detects the user data that is stored for each user via the User Registration Add-on. The reports are automatically generated based on the type of data available.
The available Gravity Forms charts are mostly focused on fields that have limited options to choose from, such as drop-down and radio fields. Some other field types, such as the number fields, that can be visualized on a chart are also detected. Let’s see all of the Gravity Forms user field types that are available in the reports section.
2. General Gravity Forms reports
With this new feature, you can now analyze the Gravity Forms entries for all of your forms, regardless of whether they are submitted by registered users or just visitors. You can enable reports for each of your forms separately in the Users Insights -> Module Options -> Gravity Forms -> Settings section:
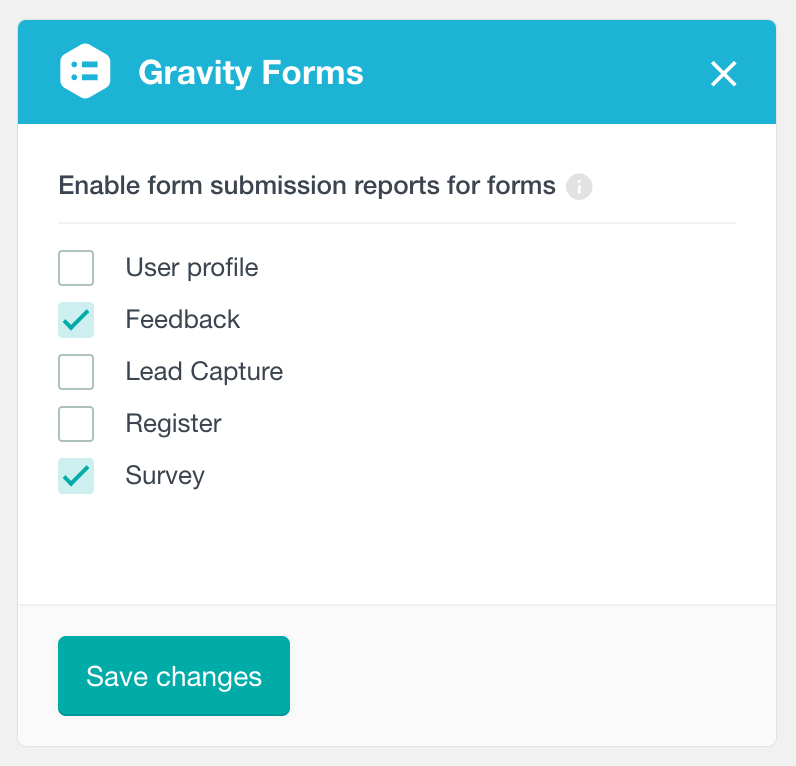
Once enabled there will be a separate section for each form available on the Reports page.
Gravity Forms charts and Gravity Forms data
Gravity Forms charts are a great way to visualize your form data. You can use them to see how your form is being used, track submissions over time, and more.
The following types of reports are available for each form in this section:
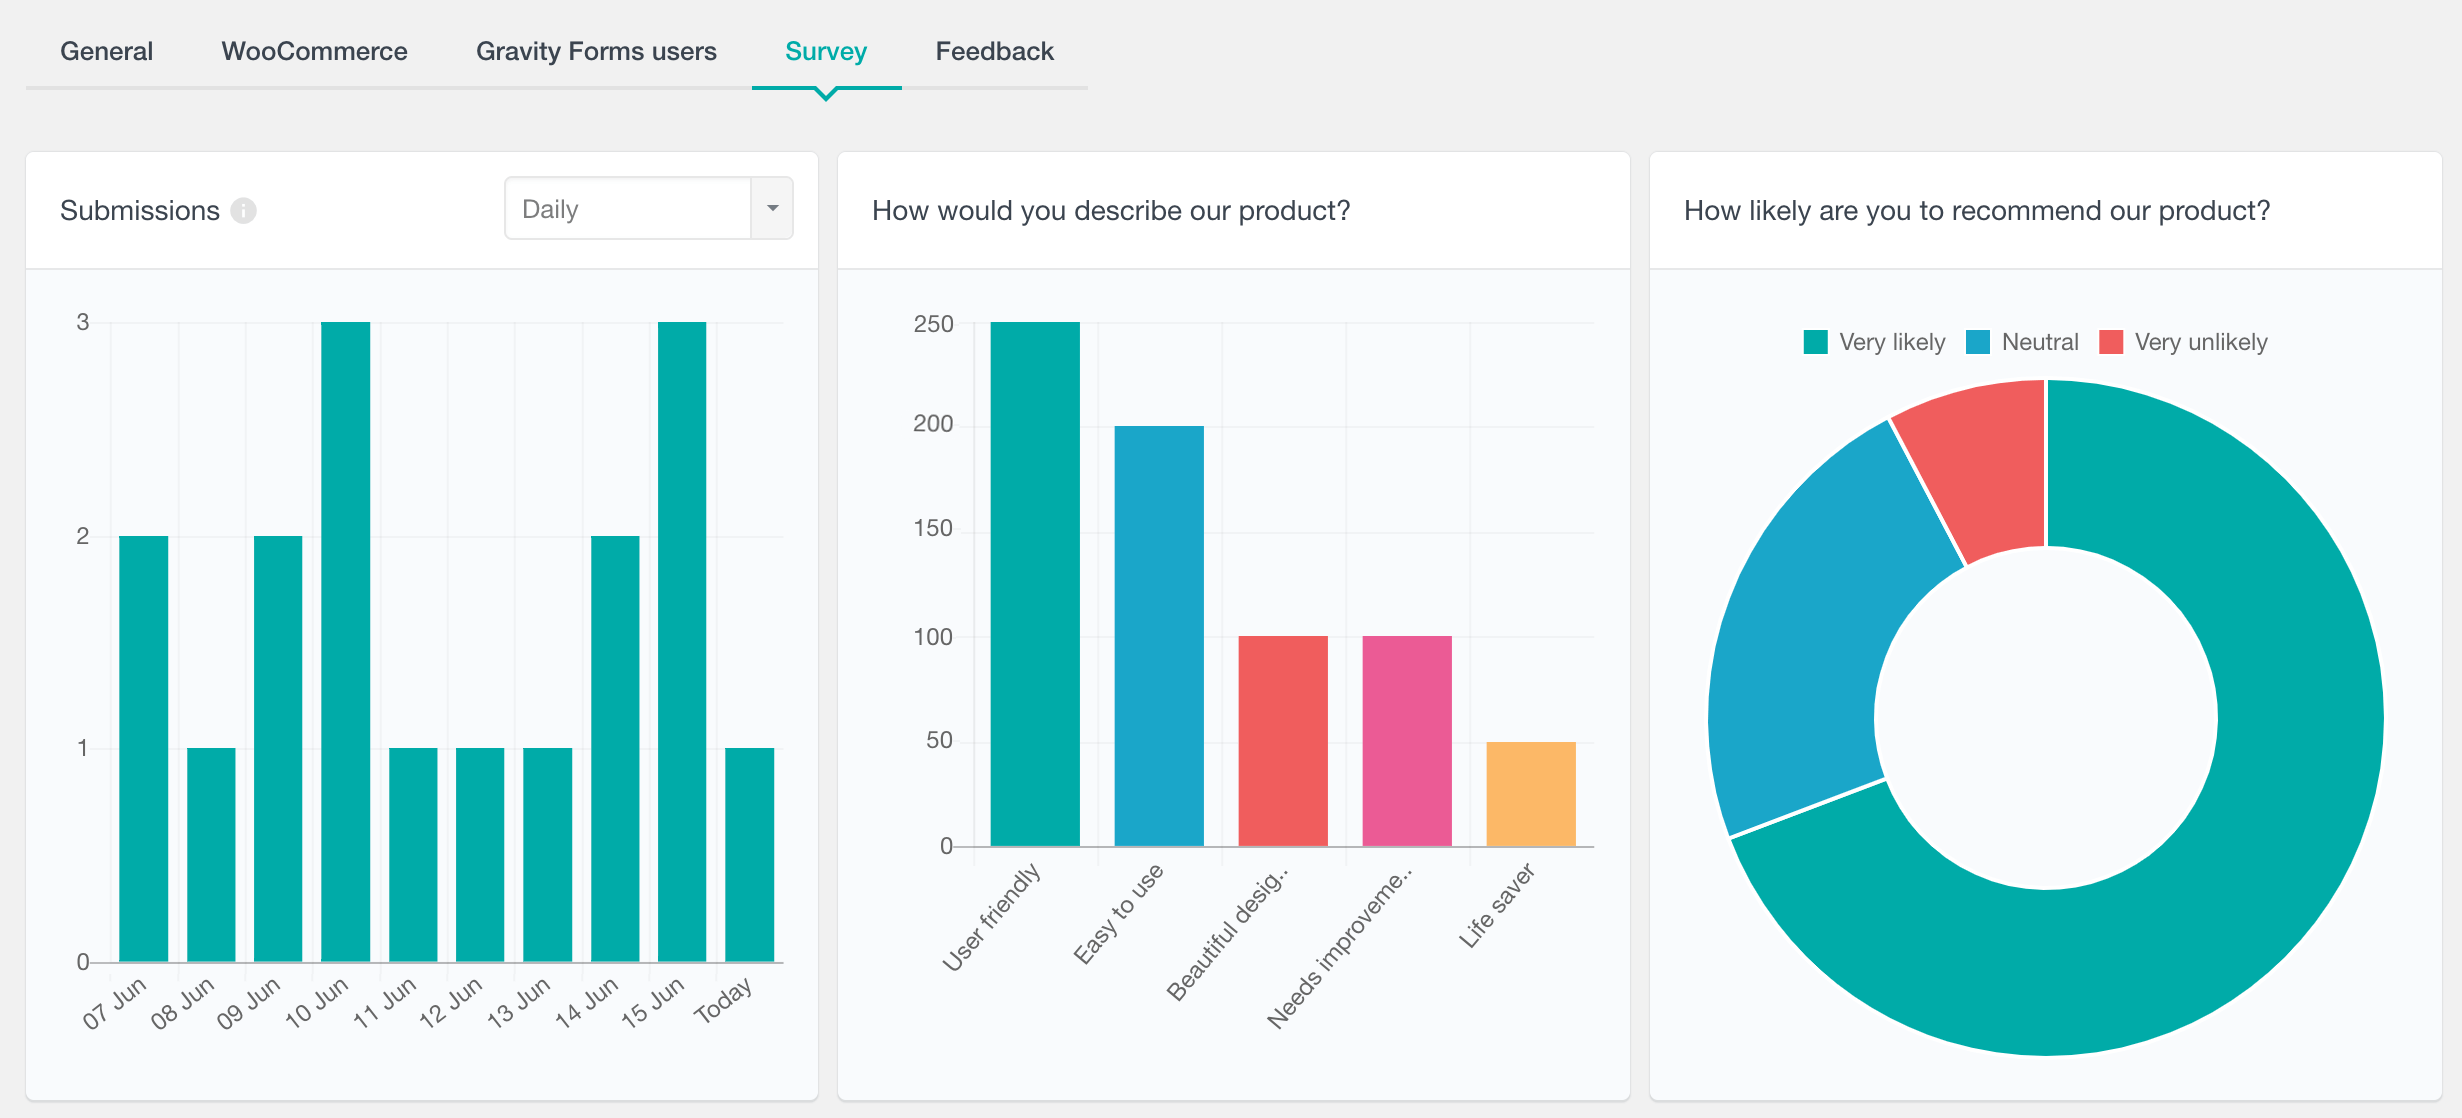
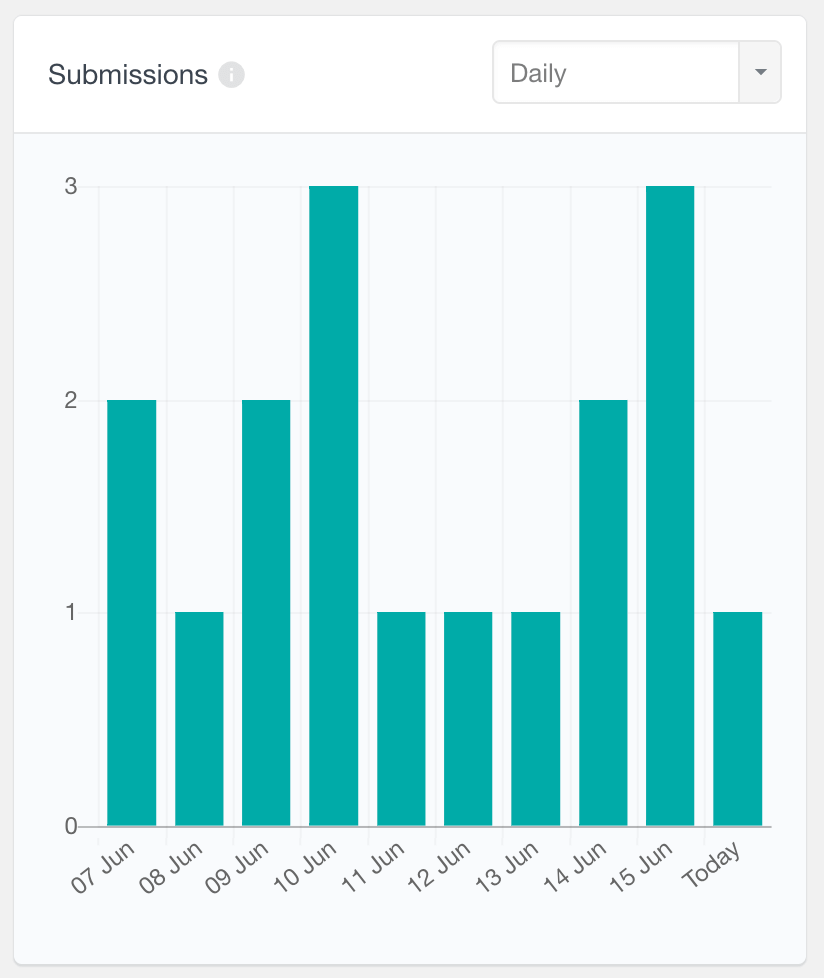
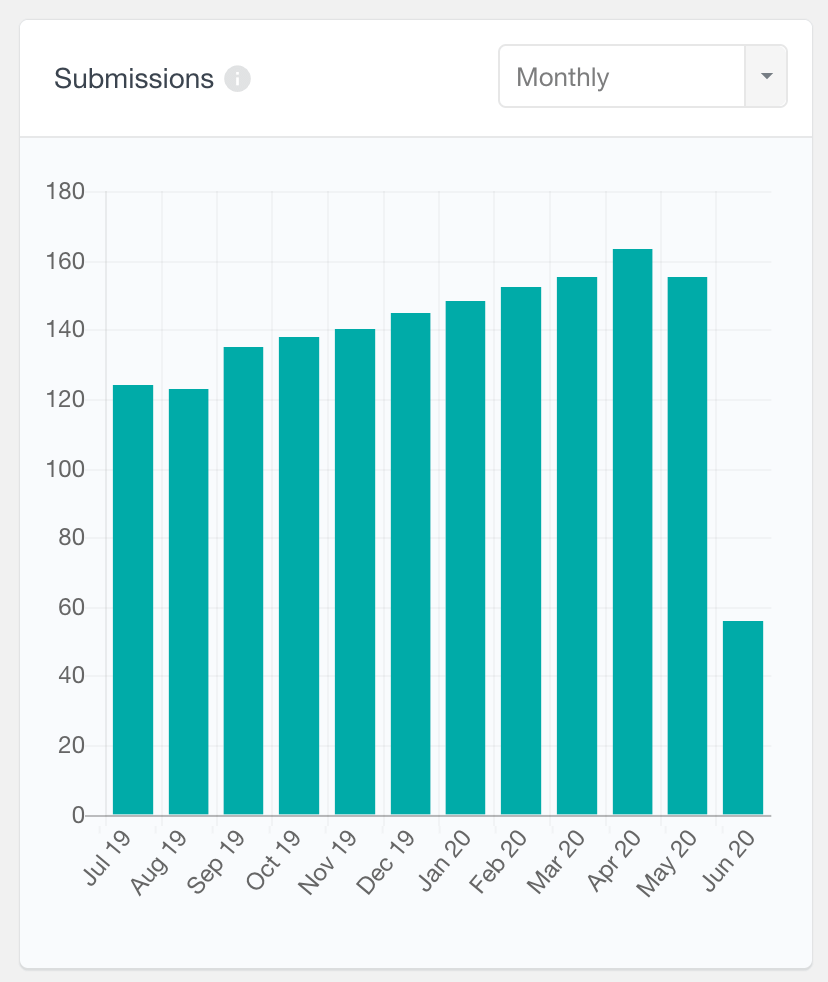
Submissions report
This report shows the number of submissions for the selected form over time. This periodic report supports Daily, Weekly, Monthly and Yearly periods. You can use the arrows on the bottom of the chart to move through the different time periods. It can be very useful to visualize the submission activity of a given form over time.
Gravity Forms Entry data reports
With each enabled form, Users Insights automatically generates graphical reports for all of the supported form fields. These reports represent all of the form entries, including non-user entries and multiple entries submitted by the same person. Similarly to the user-based reports, different chart types are generated based on the field type.
Supported Gravity Forms field types
In this section, we’ll explore the supported field types and how they are visualized in the reports. These field types apply to both the user-based reports and the general Gravity Forms reports.
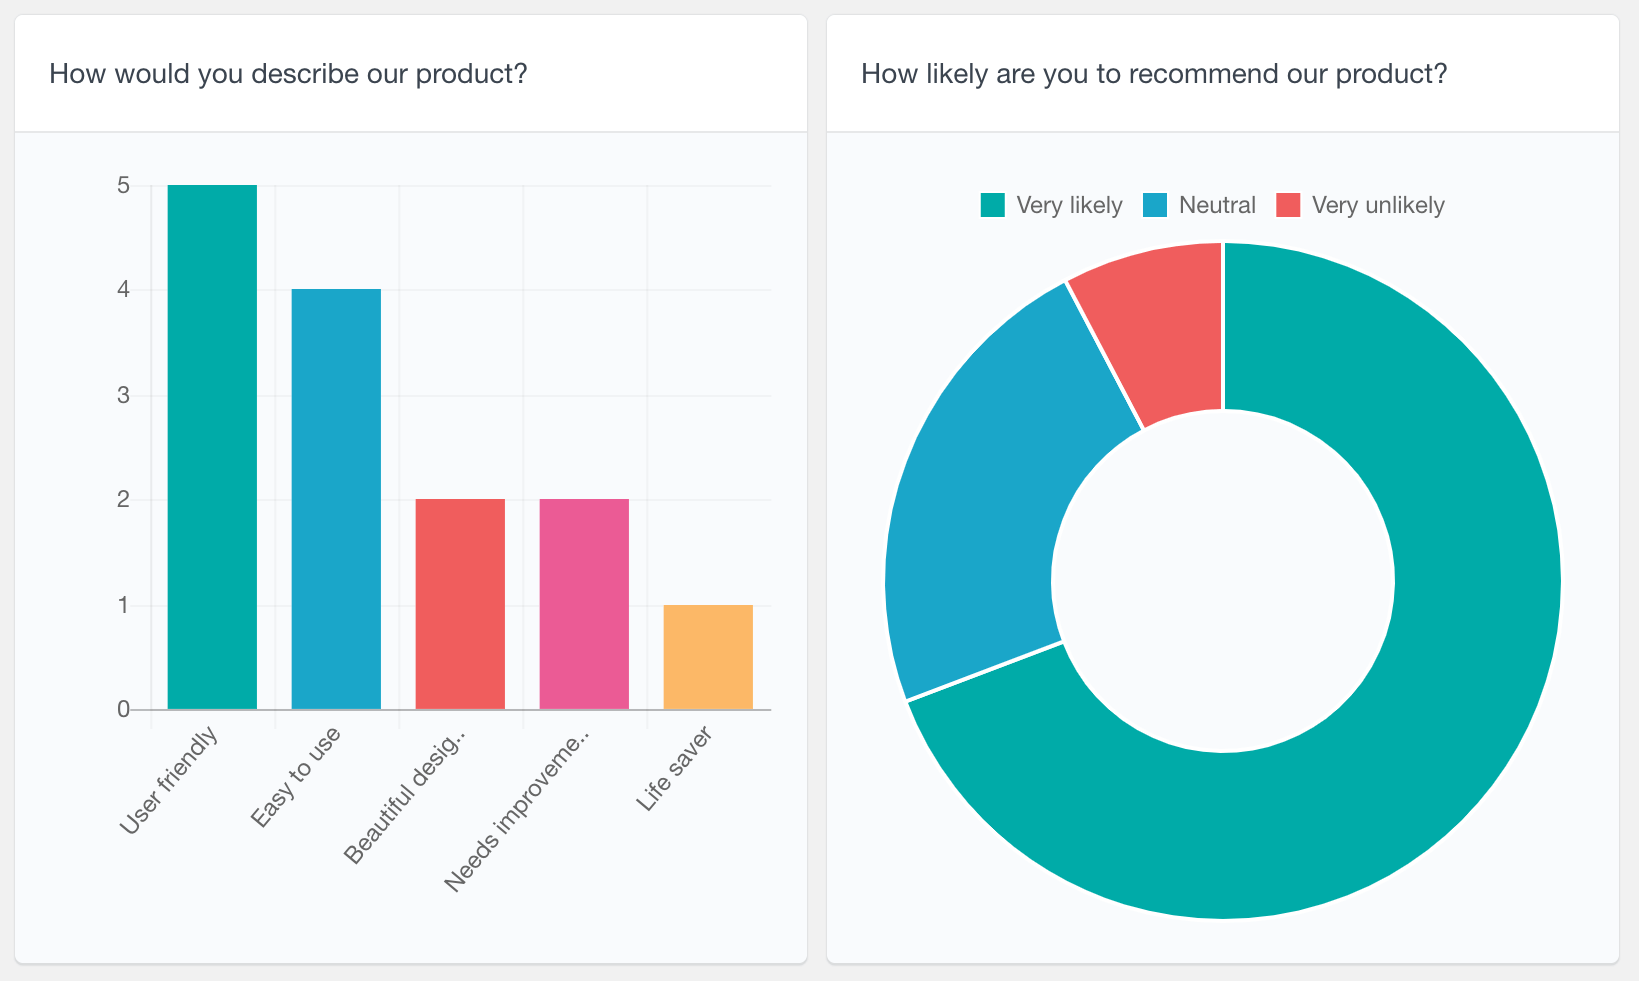
Radio and drop-down fields
The radio and drop-down menus give the users the ability to pick a single option from a list. These fields are typically called single-choice fields. The radio fields work best for shorter lists of options – for example, with 2-3 options. Drop-down menus are often used for longer lists of options.
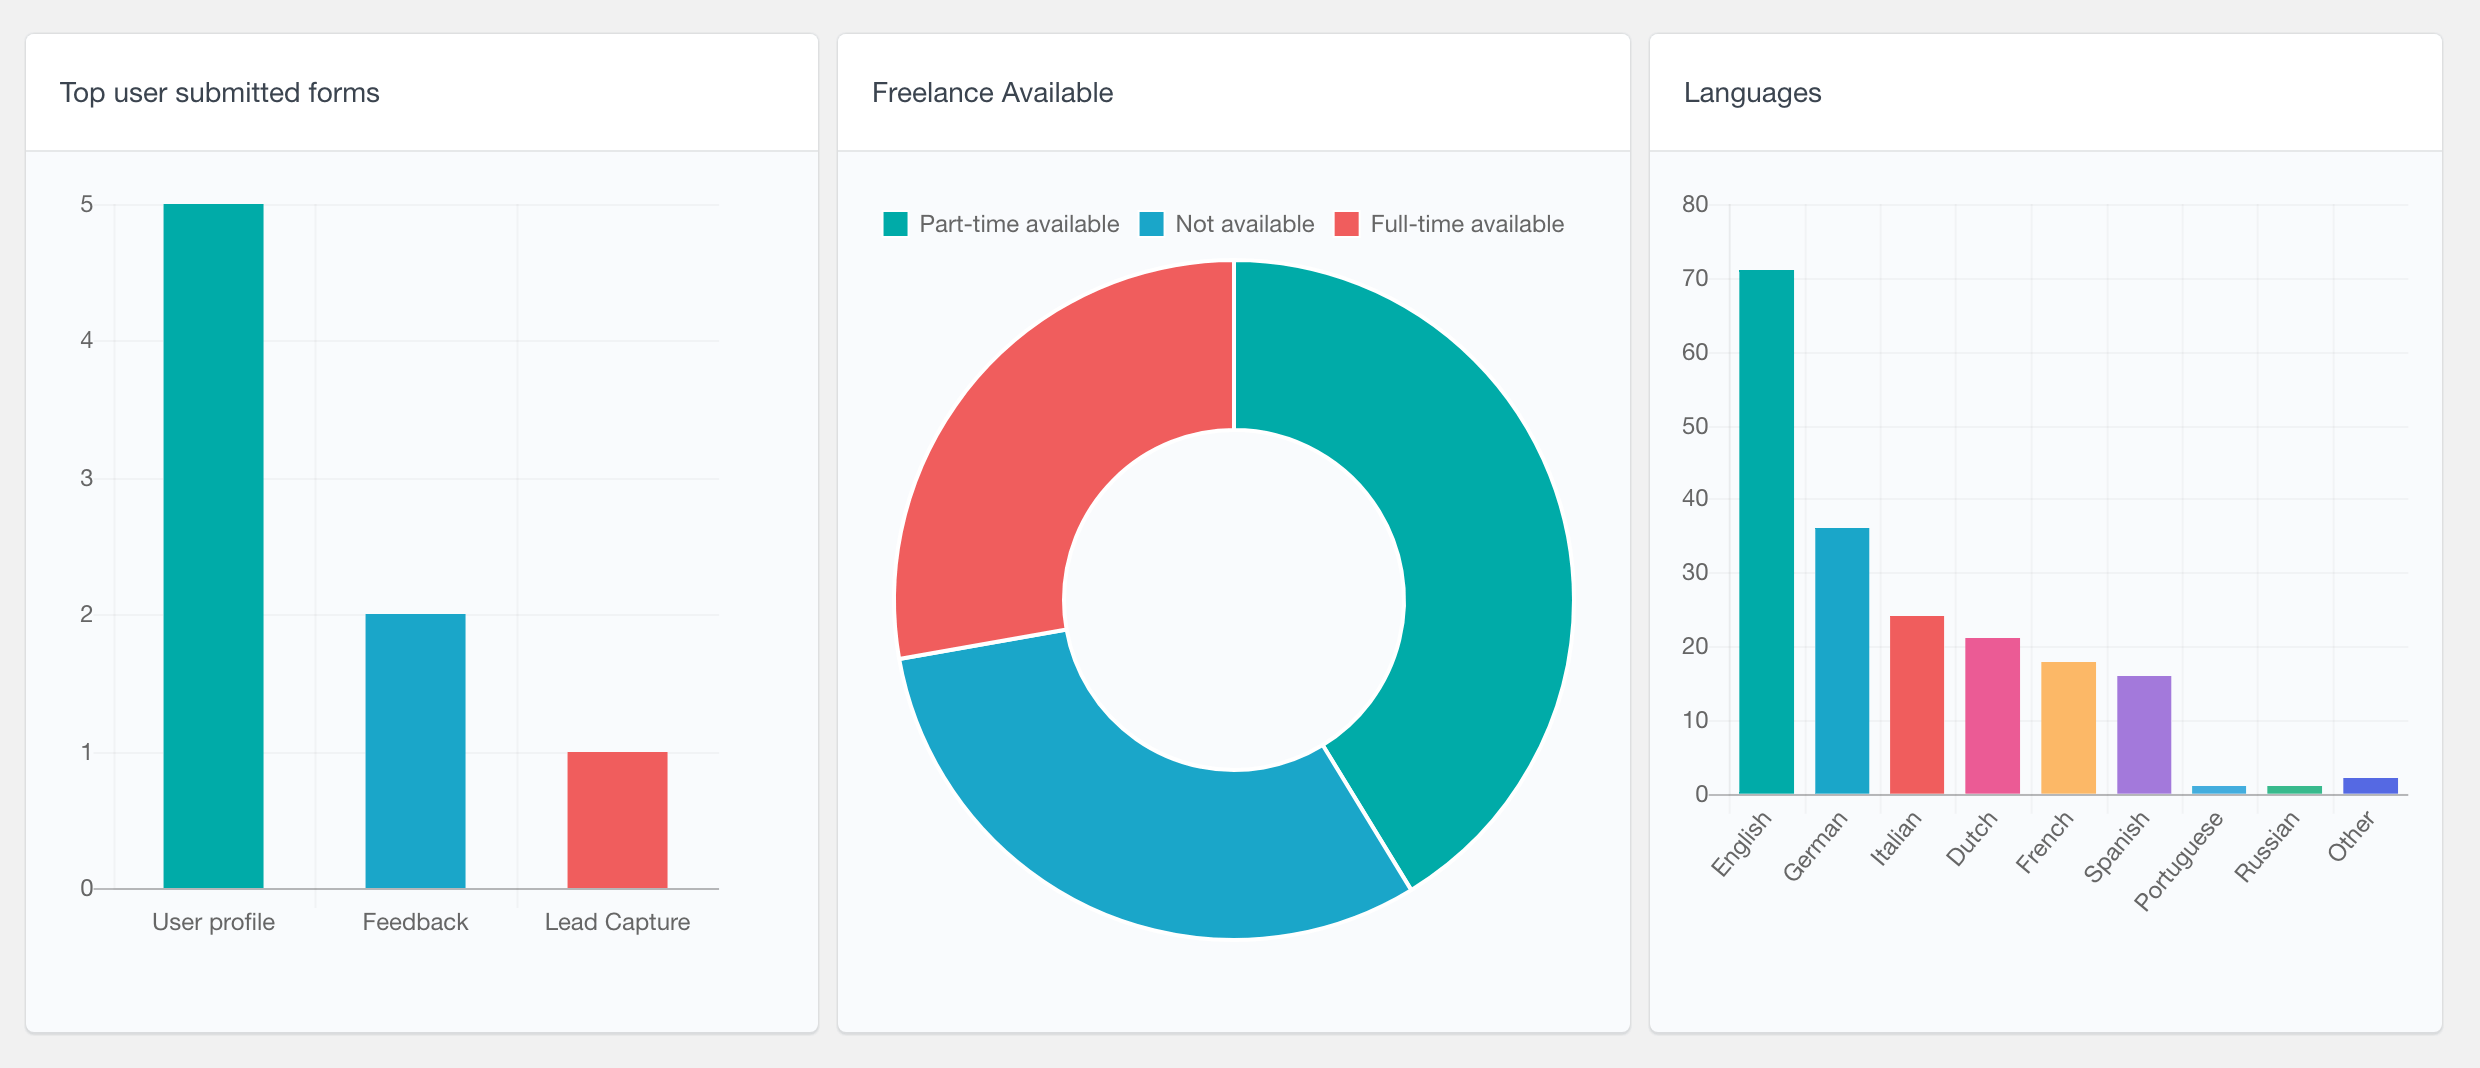
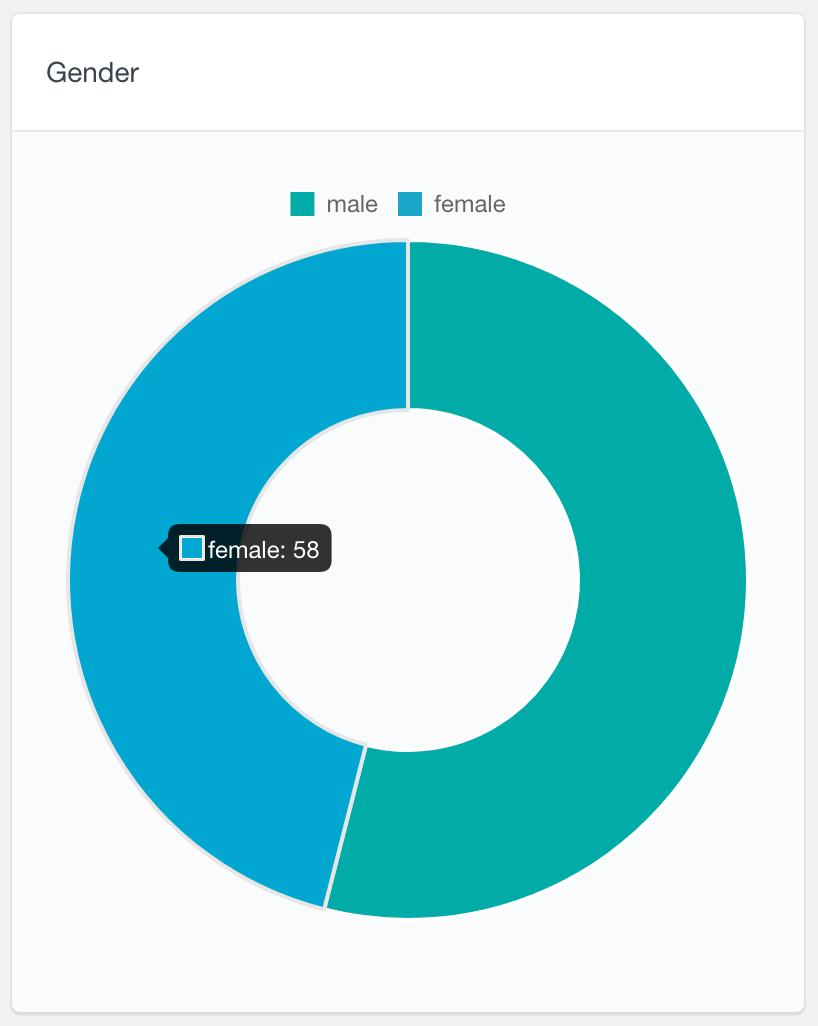
The Gravity Forms single-choice field reports are represented as pie charts. Since the choices are mutually exclusive, each slice on the chart would represent the percentage of users that have selected the corresponding option. The Gravity Forms charts visualize only the submitted data. This means that if some of the entries are missing data for this particular field, they won’t be visualized on the graph. Additionally, to avoid overloading, only the top several most popular options are represented on the graph. The rest of the options are grouped under the “Other” group.
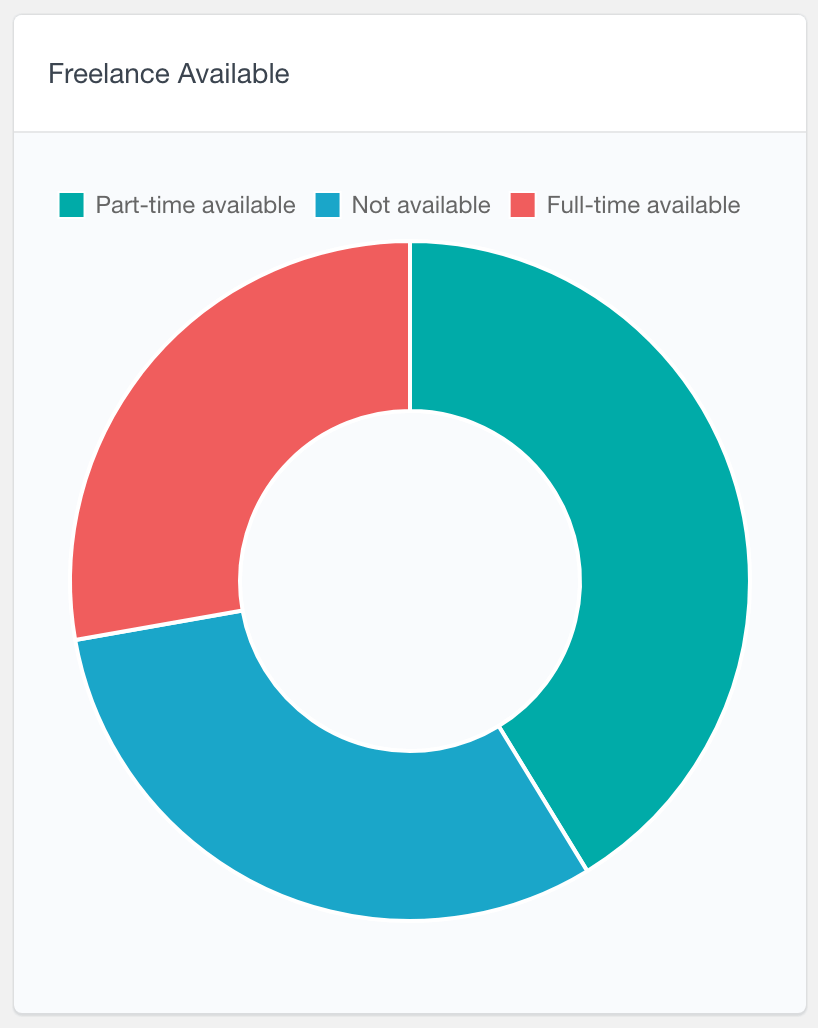
The following screenshots illustrate examples of single-choice fields. On the left, you can see a radio button field where the users can select their gender. As you can see on the screenshot, hovering over each slice from the graph shows the number of records with the selected option. The second screenshot is an example of a drop-down field report, where the users can select their availability.
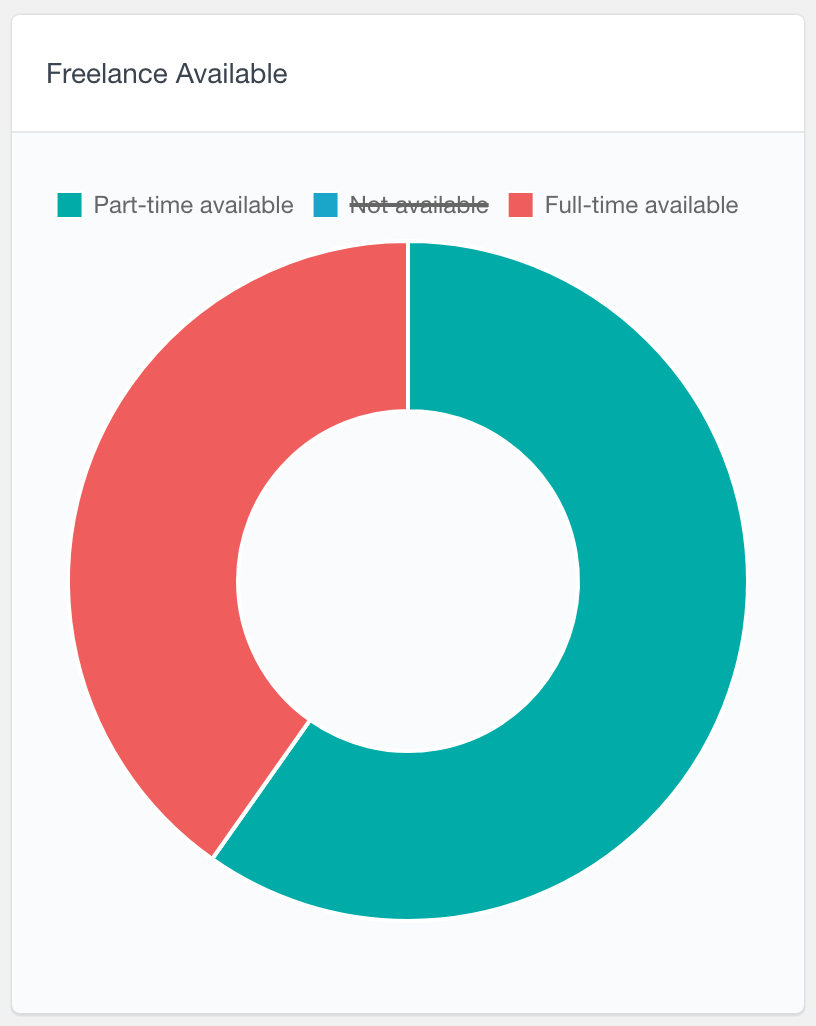
You can also compare the proportions of two or more slices, by excluding the rest of them. To exclude a slice from the chart, just click on its label. Here is an example of comparing just two of the options. As you can see, this can better visualize how the two options compare to each other:
Multi-select and checkbox fields
With the multi-select and checkbox fields, the users can choose one or more options from a list. These fields are often referred to as multiple-choice fields. The checkbox fields are often used for shorter lists of options, while the multi-select fields are more suitable for longer lists.
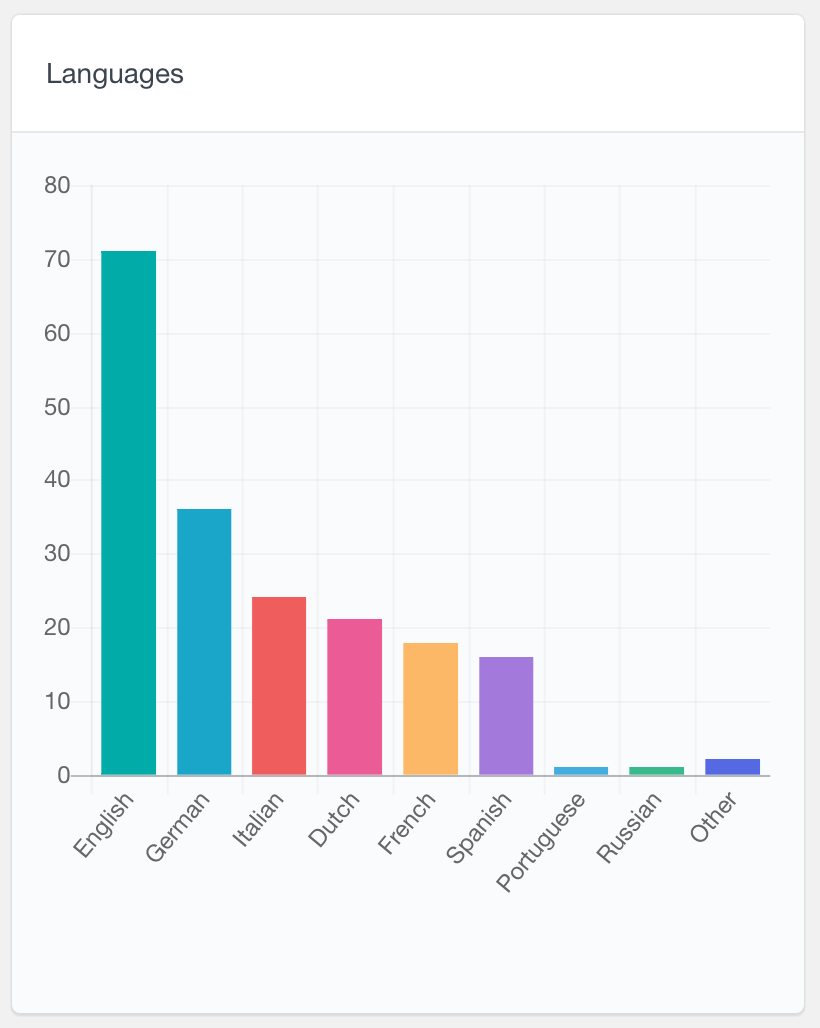
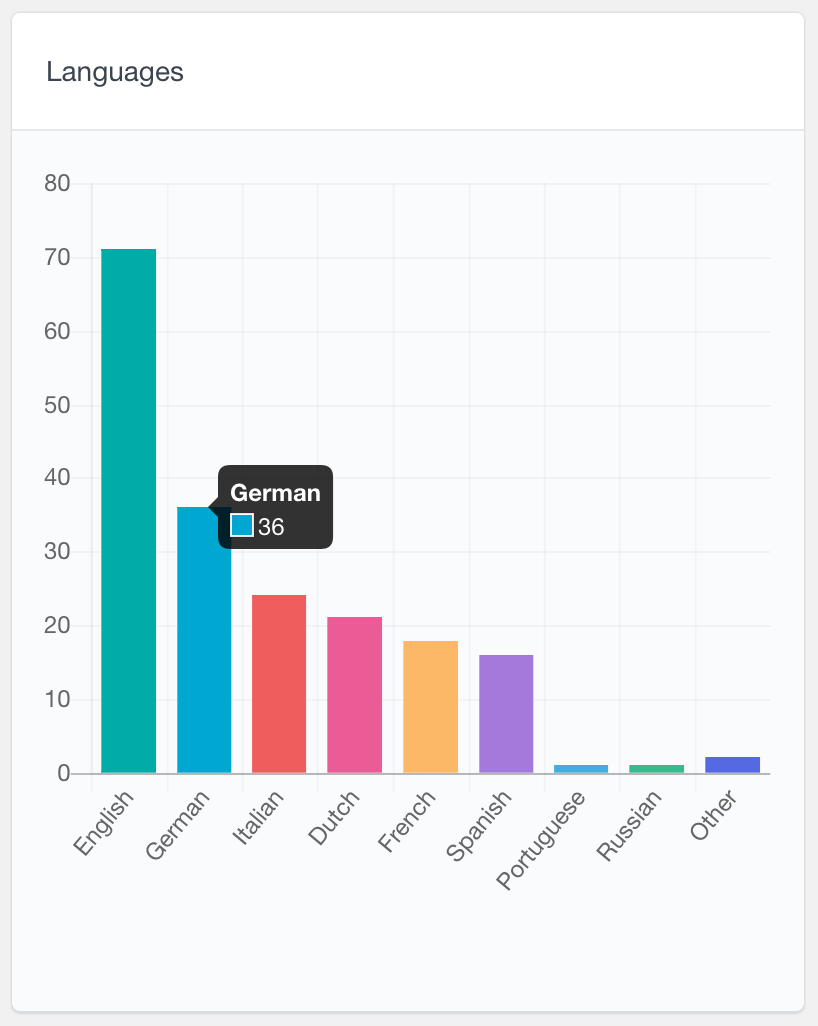
The Gravity Forms multiple-choice fields are represented in the form of bar charts. Similarly to the reports described above, only the several most popular options are visualized and the rest are displayed under the “Other” section. The left axis of the chart indicates how many records corresponding to the selected option.
Here is an example of a multi-select field where the users can select one or more languages that they speak.
Number fields
The Gravity Forms number fields are another field type that is detected by the Users Insights reports. The number fields simply allow the users to submit a numeric value to the corresponding field.
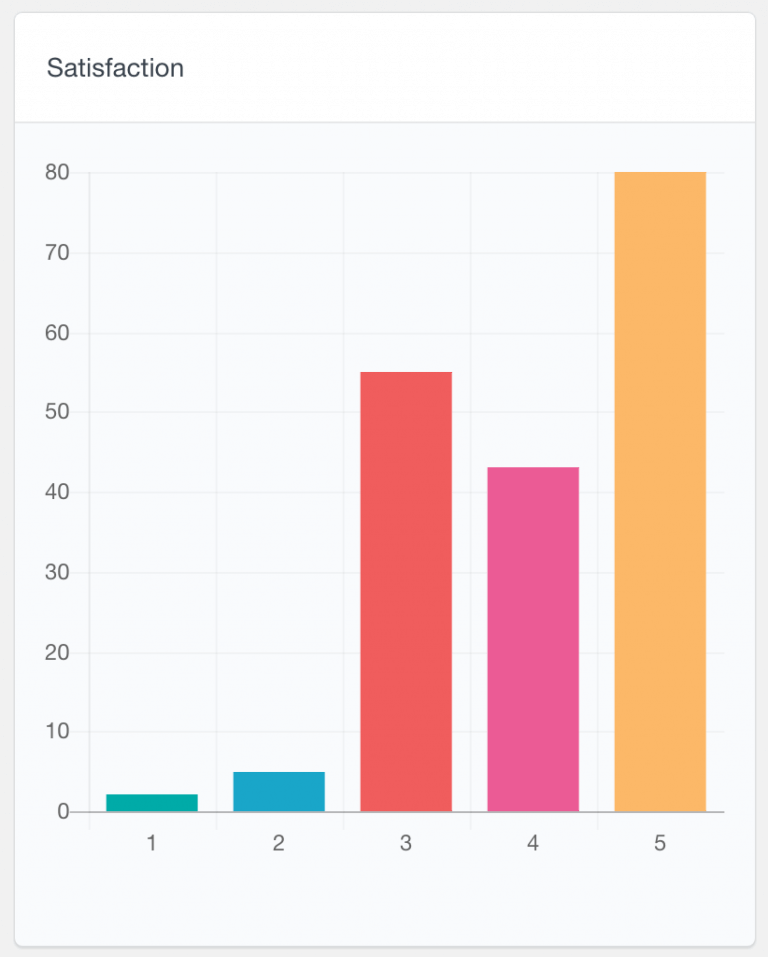
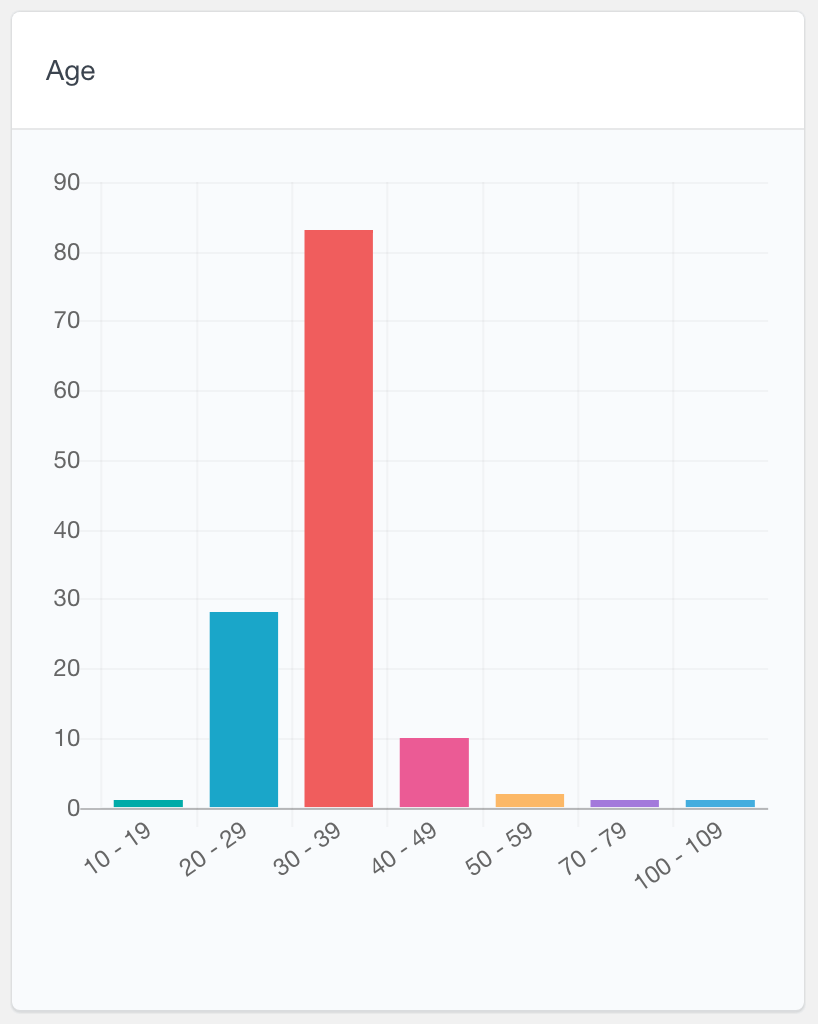
The Users Insights plugin uses bar charts to visualize the numeric data. For fields that accept a small range of values, each of the values will be visualized in a separate bar on the graph. However, in the cases of a wider range of submitted values, the report would automatically group the values into smaller ranges.
The following section illustrates those two scenarios. In the first example, where the values range from 1 to 5, each value is represented in its own bar. In the second example though, the submitted values range from 10 to 109 and therefore are grouped into smaller ranges. The left axis indicates the number of records corresponding to each value and you can also hover over each bar to see the exact number.
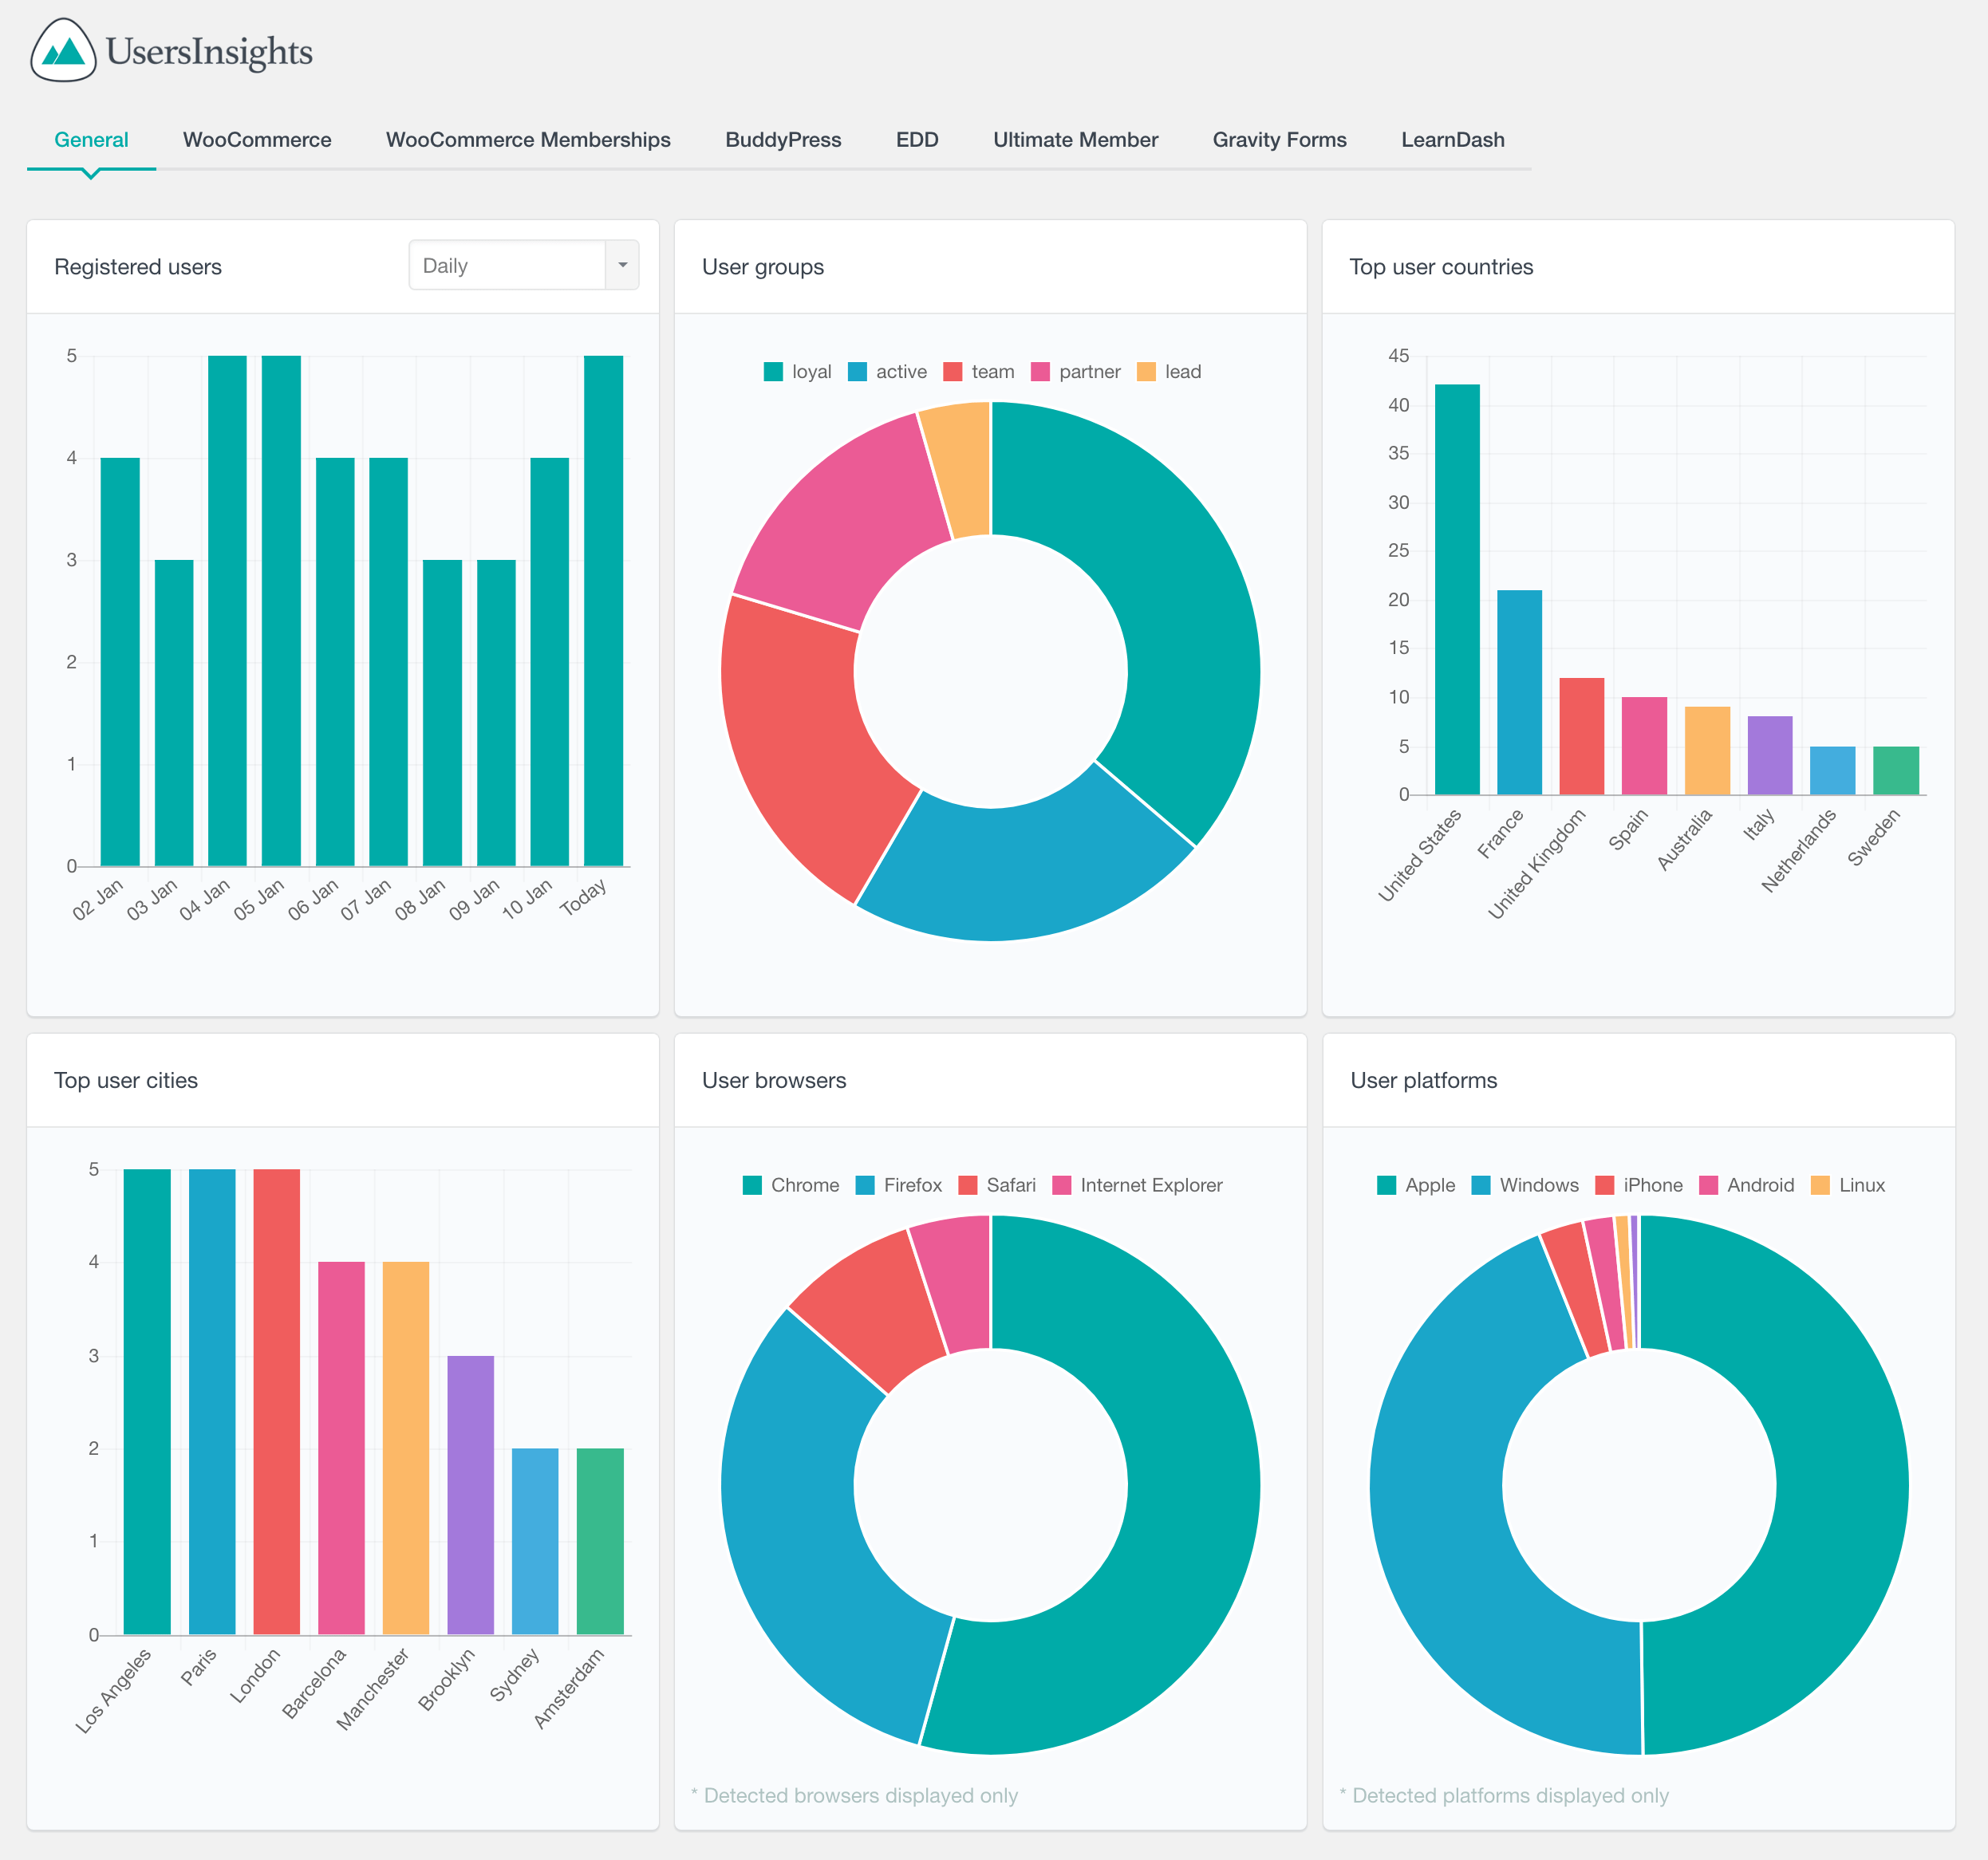
Other WordPress user reports
Besides the Gravity Forms reports described above, Users Insights also includes other user-based reports. For example, the General reports section includes user reports, such as user registration tracking (registered users over time), Gravity Forms views, or user location reports based on the Users Insights Geolocation module. Users Insights also includes reports for most of its 3rd party integrations, such as WooCommerce (automate sales reports, business reports etc.). To learn more about all of the available Users Insights reports, you can visit the Reports page.
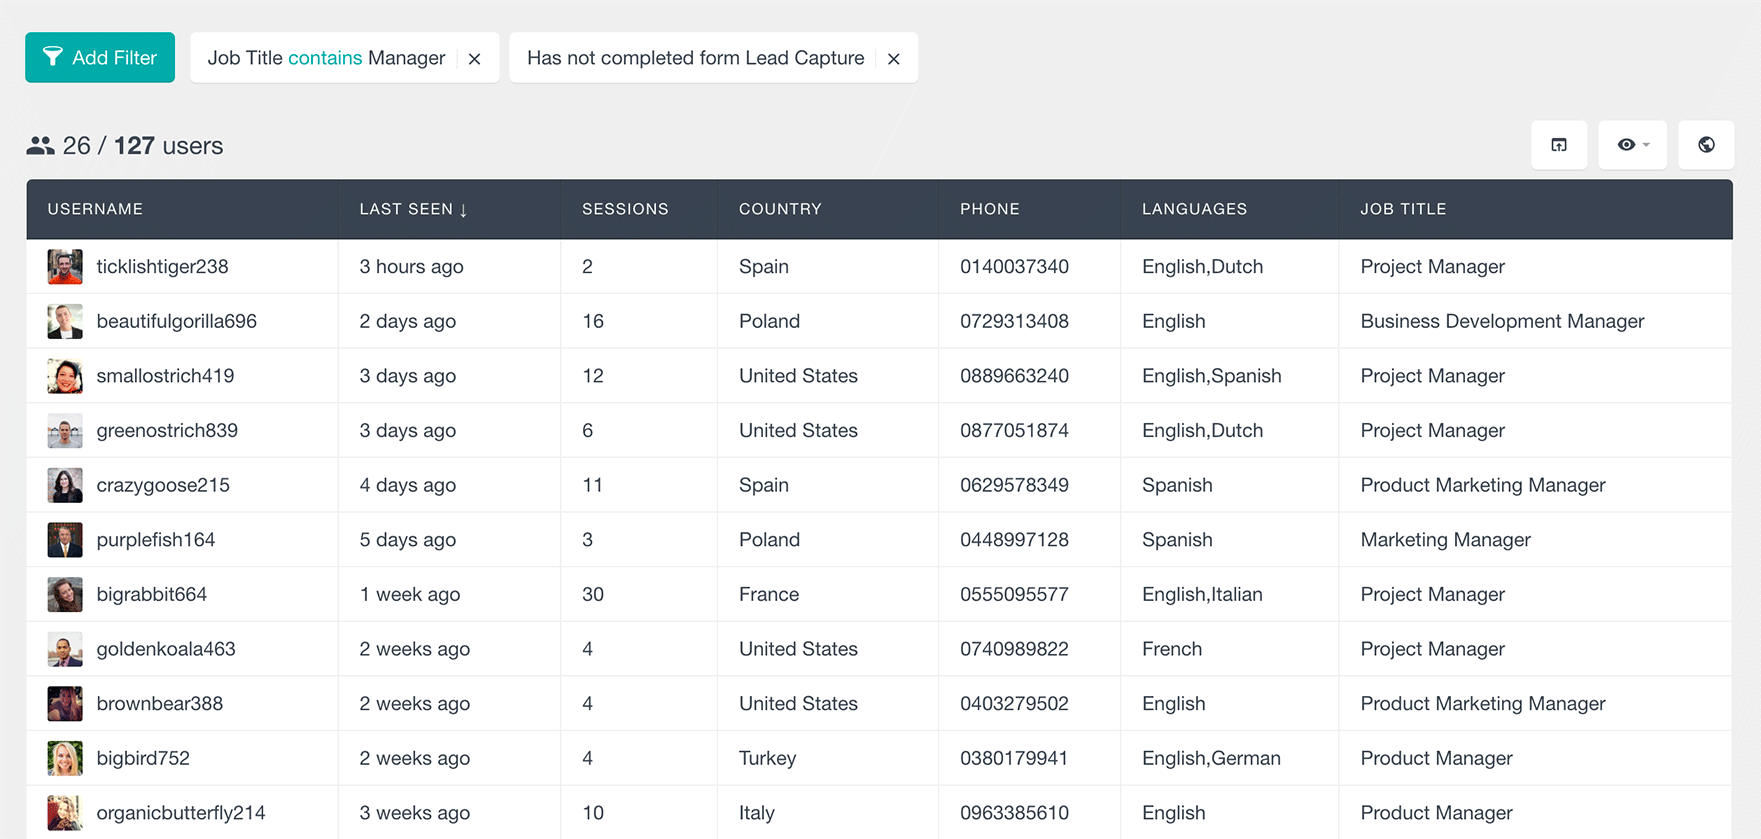
Searching the Gravity Forms user data
In addition to the reports that can help you visualize your user data, you can also search your WordPress users based on this data. This can be accomplished with the help of the Users Insights table and filters. The user table detects the Gravity Forms user data automatically and makes it easy to search by using advanced filters. This page also includes a detailed user profile section for each user, where you can view all the data available, such as the Gravity Forms user data, activity, etc. For more information, head over to the Gravity Forms page.