How to use customer surveys to optimize your WooCommerce store
In this article we are going to look into how you can combine different tools to gather knowledge through surveys. We’ll see all the steps that you can take to create WooCommerce customer surveys. By the end of the day you’ll be able to use WooCommerce, Users Insights and Gravity Forms in combination to get invaluable customer information.
Creating customer surveys may not be an easy task. There are many different components you need to control in order to make it work. That’s why we have created this step by step guide with all the information you need to pull this off.
There are many advantages in surveying your customers. You may get to know what they like or dislike in your store. You can also gather more knowledge about how your products are used and you will surely understand your audience a little bit better. And sometimes you don’t even know what information exactly you’ll get.
That’s the beauty of it.
We are going to show you how you can create focused surveys, but this also for open-field explorations. So you’ll just send out the questions and then afterwards you’ll get the information you need from them. That’s great when you have a big decision to make and need information to support it.
Our main topics for today are:
- Planning your questions
- Selecting the users to survey
- Setting up Gravity Forms
- Building a questionnaire
- Sending out emails
- Reading your results
Let’s get right into it!

Planning your questions
The first step is defining your main goals with your survey. Keep in mind that it isn’t good to keep bugging your customers for feedback constantly. Therefore, we need to extract the maximum information possible in each survey, with no unnecessary questions.
For example, we know your customer address, their ordered products, the number of orders they’ve made. These are all questions you don’t need to ask at all.
Some good topics to have in mind when preparing a survey are:
- Product satisfaction
- Company satisfaction
- Product usage
- Service / support satisfaction
- Demographics (that can’t be collected, such as company size, industry)
- Branding (brand recognition)
Whenever possible, try to create some questions that can be used for future decisions. For example product requests, common problems and new ideas.
Selecting the users to survey
Just sending out a big survey to all users isn’t a good idea. If you have a product survey, for instance, make sure you only send it to people who bought that product.
The same goes the other way around, if you are surveying potential customers, make sure you select only users with no orders.
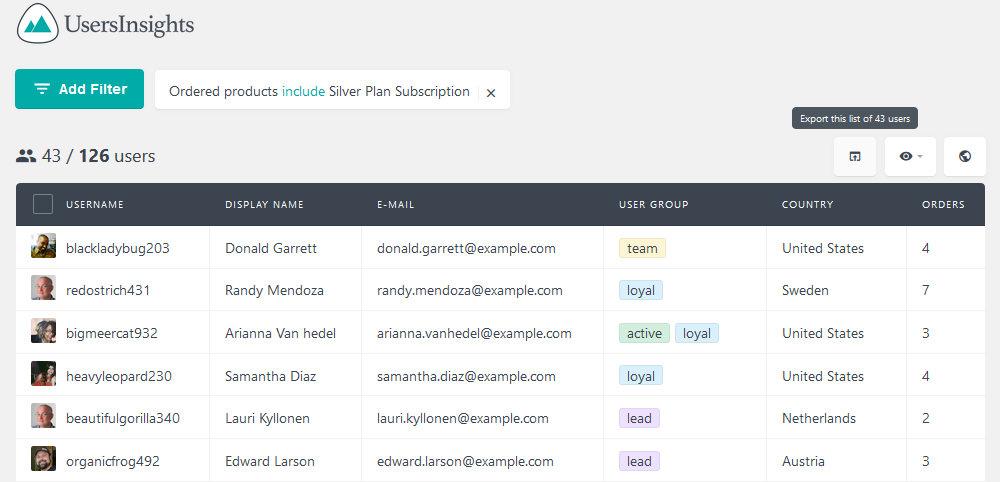
This all can be done with Users Insights and its filters. You just need to apply the filters you want and then export that user selection.
Don’t be afraid to filter out users and make sure only the ones you want will get these surveys. If you have multiple user sets, you can create multiple lists in your mailing software and survey them separately.
Setting up Gravity Forms
Before creating the forms, we need to make sure our information is going to be stored correctly. That’s why we recommend Gravity forms with the User Registration Add-On enabled.
This is good in multiple ways, since this data is going to be tied to your users and not a general custom post type. When you enable Gravity with this Add-On the form submissions create custom user fields. This way it’s much easier to read and manipulate your results using plugins such as Users Insights.
There’s no further action needed in your setup, just make sure you have both plugins enabled.
Building a questionnaire
Now it’s time to actually create your questions into a form builder. As an example we’ll create a simple satisfaction survey. You can use the Gravity Forms builder for this:
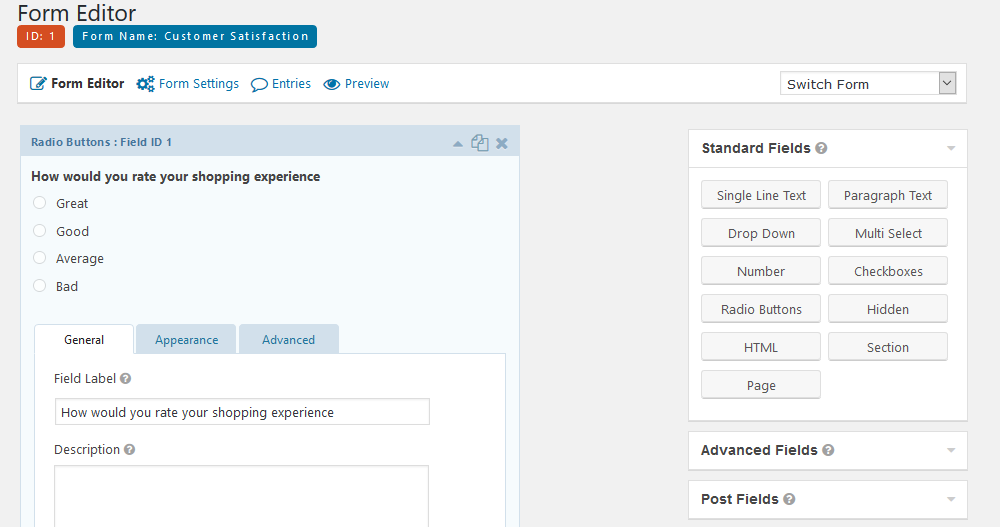
When it comes to the form itself there aren’t any restrictions. It’s just better if you put your questions in a way you can easily compile the results later on. So prefer selects / radio buttons over open text fields as they are much easier to make sense of.
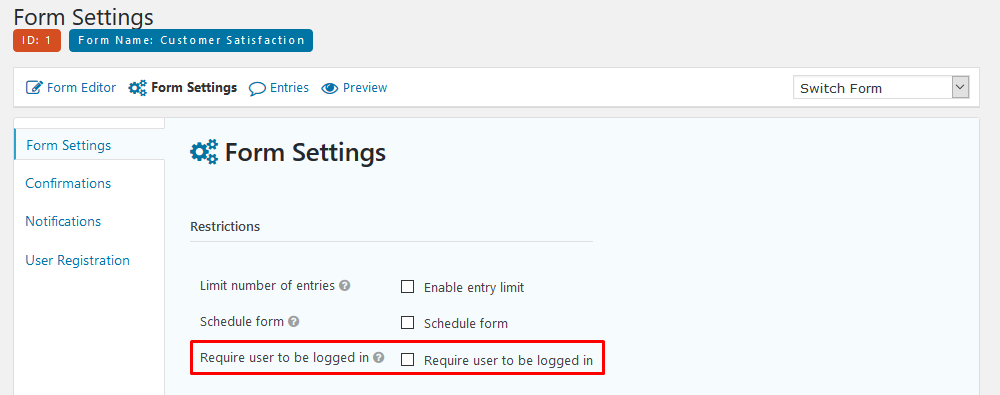
Also, if you want a customer-only form you’ll need to allow only logged in users to view it. That’s done under Form Settings > Restrictions > Require user to be logged in:
After this you’ll need to insert this form in a page so you can send this link to your users. You can add it to any page you want to, just make sure the shortcode is working by visiting it.
Sending out emails
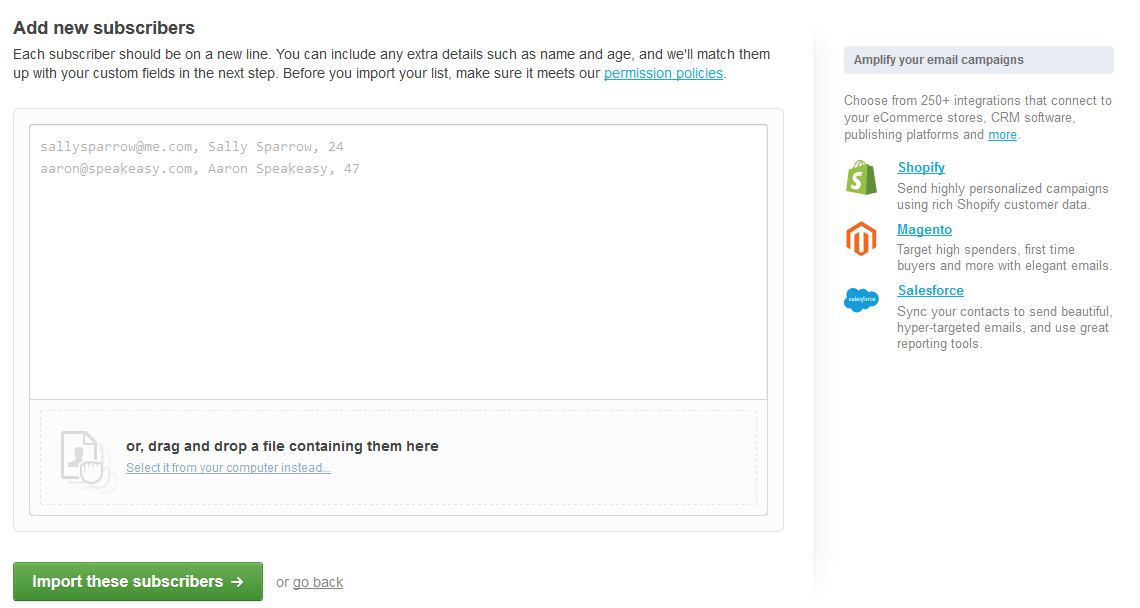
Once you have everything set up, it’s time to send your link to your users. For that we’ll rely on a mailing software such as MailChimp or Campaign Monitor. We do have guides on how to use both. You can check how to import WordPress users to MailChimp and how to import WordPress users to Campaign Monitor and choose which one better suits your needs.
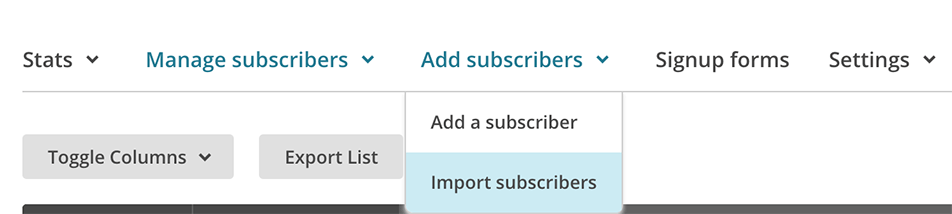
Overall you’ll need to get the exported list of users you’ve got (step #2) and import it into your mailing software. For MailChimp it’s done under Add Subscribers > Import Subscribers
And in Campaign Monitor you can do this when creating a new list or selecting an existing one. You’ll see the import option under “Add subscribers to list”:
And that’s it. Just create an email, hit send and wait for a while so you get some results.
Reading your results
Usually it will take a couple of days until all list members have checked their emails. Once you have a good amount of replies you are ready to process your results.
It’s time to get creative and find all the relations you want. The exact filters you’ll use depends on the survey you are running. But let’s explore some ideas.
We can check how likely a user is to recommend your store based on the product they’ve bought. So, for example, among users who bought the Silver Plan how likely they are to recommend our store?
To get this number, restricting only users who bought the Silver Plan, we’ll divide the number of users who would recommend us by the total (who would recommend + who wouldn’t).
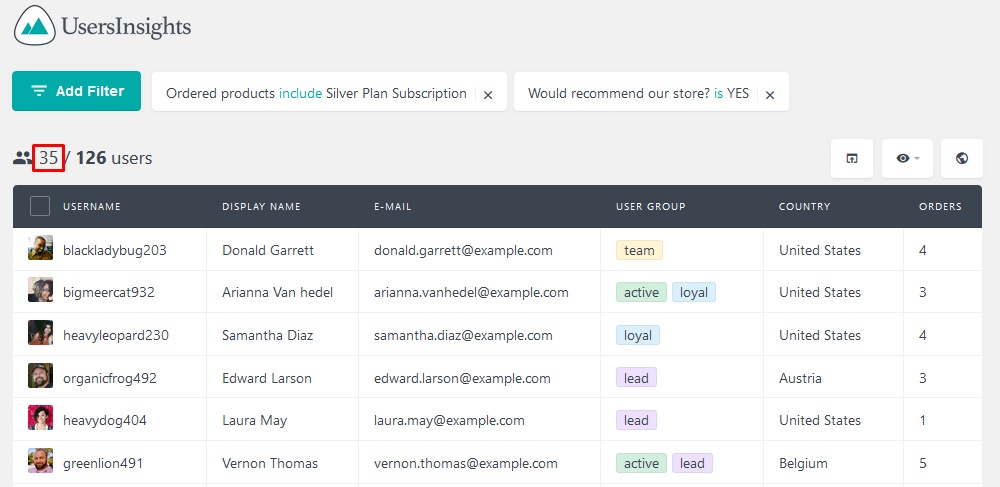
Now we’ll get the total amount of survey replies within users who bought the Silver Plan. This is needed to make sure you are only calculating the percentage for users who actually completed your survey. If you looked for users who bought the product in general you would get everyone, including the ones who didn’t even reply.
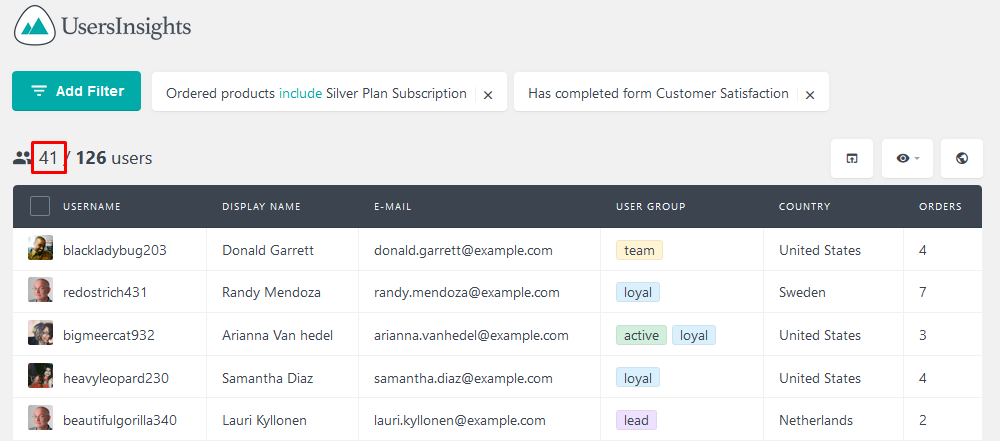
In our example this ratio is 85.37% (35 / 41).
You can figure out many other ratios beyond the basic reply numbers.
Another idea is checking the satisfaction rates for each country. This will tell us where we are doing good, and where we aren’t. For this ratio you can use a similar technique than what you’ve seen above. The only difference is filtering by each country instead of product.
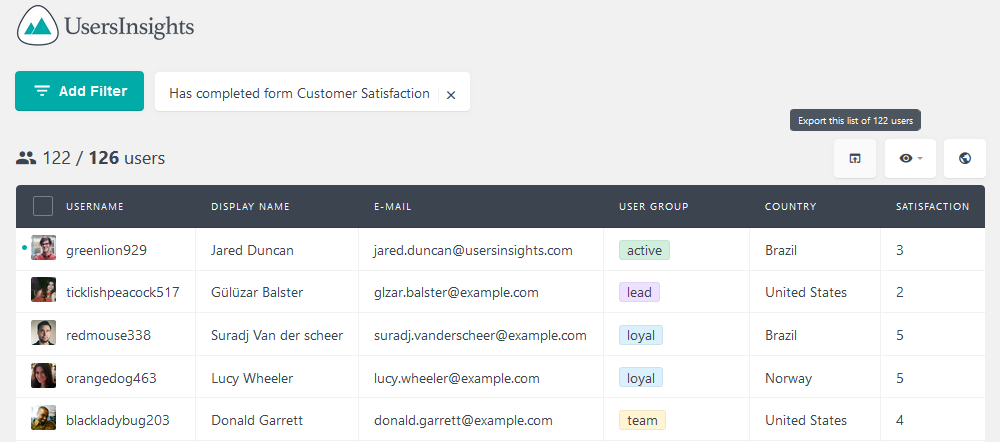
But there’s a shortcut. You can get all values for all countries at once. For that, we’ll need to make sure we have the satisfaction rating and country as visible columns. If you don’t have them click the eye icon.
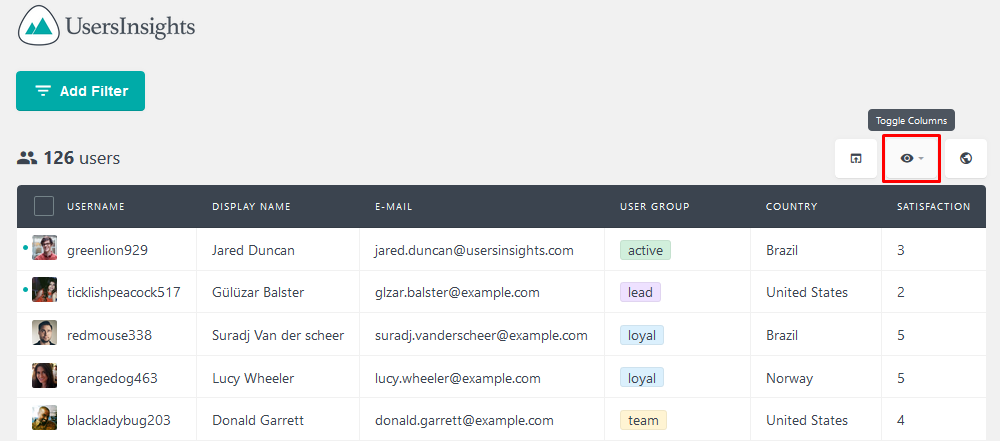
After this filter out only users who have replied to your survey, and we’ll export them all.
The logic behind this now is that we’ll count the total satisfaction per country. Then we’ll count the total customers in that country. The average satisfaction for each of them can be calculated by dividing the total rating by the number of users.
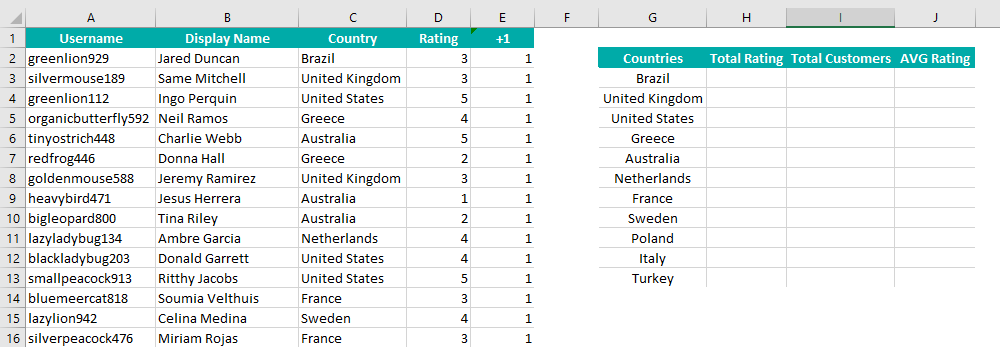
Let’s play with Excel to get this. There are 2 adjustments we need to make. The first one is rather simple, just add another column besides your users named plusOne and add the value 1 for all your rows. This is required for the SUMIF function, later on.
For the second adjustment, we’ll add a new table with our countries, listing each of them. Then we’ll have columns for the total ratings, total customers and average rating for each of your countries. This is where our results are going to be presented.
This is how our adjusted file looks like:
We can now use the SUMIF function to get all ratings and the total number of customers. In our example the SUMIF function will compare the country name from the users with our secondary table. If it’s a match it’ll either sum the rating or the plusOne column for counting customers.
When adding to the TOTAL RATING column, we’ll sum the rating that user have added to our store (Rating Column for his row). When adding to the TOTAL CUSTOMERS, we’ll add one to the current customers count (PlusOne column for his row, which is always one).
This is how the ratings formula will look like:
=SUMIF($C$2:$C$127,G3,$D$2:$D$127)
And this is the formula for the total customers count:
=SUMIF($C$2:$C$127,G3,$E$2:$E$127)
These formulas should get you the ratings and customers count as we want. Then just a simple division and voilà, there we have all ratings at once:
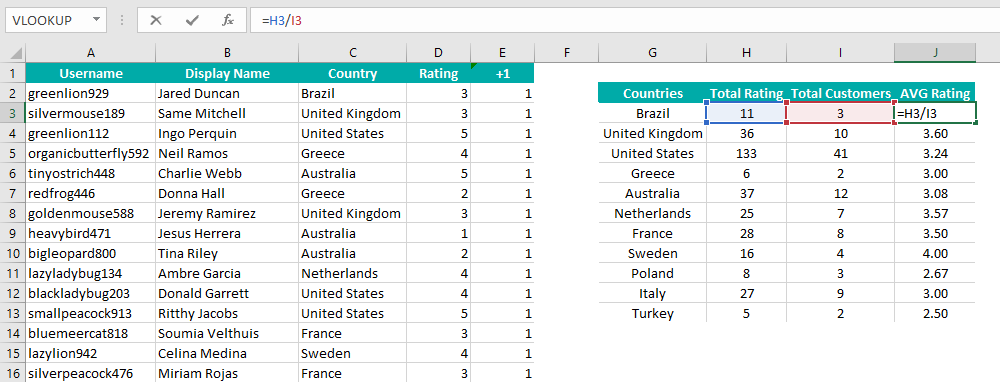
This is great because you can see all figures at the same time. You can easily see which countries are performing better, and in which you have more survey replies.
Of course, this is just a starting point, and you can use this technique for any of your survey points.
Conclusion
Today we saw a step by step guide on how to create surveys for your site. From start to finish, from planning to processing results, we’ve got everything covered here.
We also showed you some tips regarding the tools you can use to gather this data. By the end of the day you should be able to use this knowledge not only for your surveys, but for your data in general.
We should also mention that surveys can be done over multiple times. This can help you understand how your business is evolving.
We hope you enjoyed this article, and see you again next time!