Top 10 user statistics to pay attention to on your WordPress website
User engagement is one of the most important area of online business and there are many metrics that may help you measure your user engagement and better understand your users. Today we’ll talk about some of them, their importance and how you can gather these WordPress user statistics in your website.
It’s always important to know more about your users, members, forum users, customers, admins, authors, editors. Usually tracking your user engagement will tell you how well designed your site is, or how interesting your content is. They already have a connection with your site, so it’s time to use this in your favor. The problem is that there a lot of different metrics to measure. How would you know which ones are the best to get the information you are looking for?
Today we’ll look into some of the most common WordPress user statistics you should take into account. We’ll also discuss why these statistics and metrics are important and we’ll check as well out how to improve each of them.
Our topics for today are:
- Sessions or visits
- Pageviews & Pages per session
- Visit time
- New users
- Returning users
- Traffic sources
- Comments posted
- Posts created
- Top searched keywords
- Conversion rates
Let’s get right into it!

User sessions or visits
This is the most basic number to keep track of, which is the total amount of logged in visits your site has got. Each of these will create a session in your server and it’s possible to measure that for your WordPress site.
It’s really important to keep track of this metric as it shows your overall user engagement and performance. If you have an online store, you need traffic and if you have an ad-based site you need traffic as well. Overall the bigger your number of visits, the better.
If you have the Users Insights plugin installed you can get this number by tracking all users with the last activity within the past 30 days:
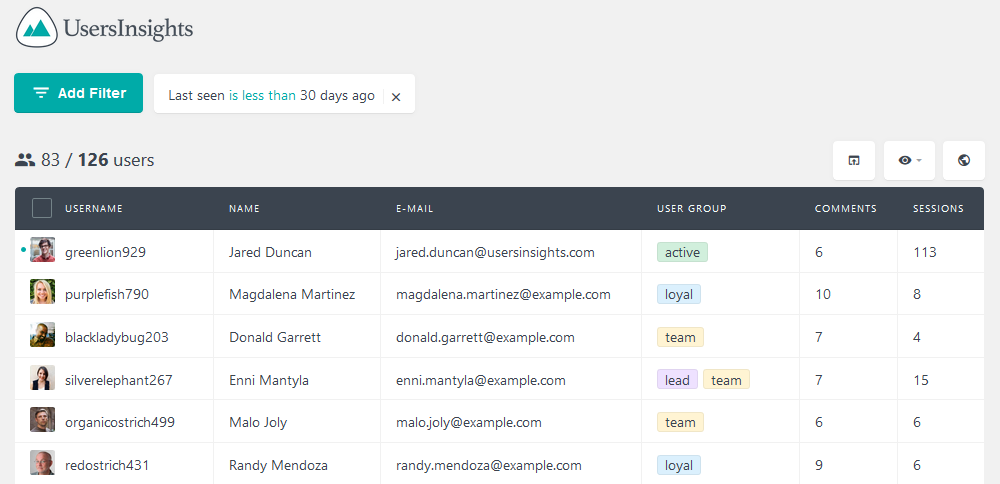
This figure can be improved though marketing. So be it ads, SEO, or just by having great products / content you need to bring something good for your users.
Pageviews & pages per visit
This is an even broader view of your audience. In short, every single page loaded is counted as a pageview. This means that if a user checks 10 pages within a single session you’ll see 10 extra pageviews in your stats.
The Pageviews will be used as a way to measure other important stats such as the user engagement. If you get users that check multiple pages in each visit this usually means that your site is engaging to them.
You can increase the pageviews and pages per visit in many ways. The best one is by linking to similar content in a single page. So, if you have a blog, consider adding other good reads with nice thumbnails after your current article. You could also add links in your text itself, as that will not only be beneficial for SEO but also to your user retention metrics.
Visit time
The visit time measures how long it took for your user to leave your site. This metric will help you understand others better as well, as it tells you if the user actually spent some time discovering your site or if they were just clicking at random.
For example, if a user visits your site but spends no more than 15 seconds, it’s very unlikely that they did anything meaningful. But the same goes the other way around, your user may have spent 15 minutes in a very long article, so this means that they probably read it.
You can improve your stats on visit time by improving your site readability and usability overall. So even if your user has to click a few times to find the information they want, they are very likely to actually read and engage in action.
New users
It’s very important to check how your user base is growing. This metric will tell you how many new users you’ve got within a period.
More registered users means that you can achieve your goals, be it for a store (sales) or a blog (readers). Additionally, registered users are incredibly valuable as you can get in touch with them in the future. You know that they are interested in what you have to show.
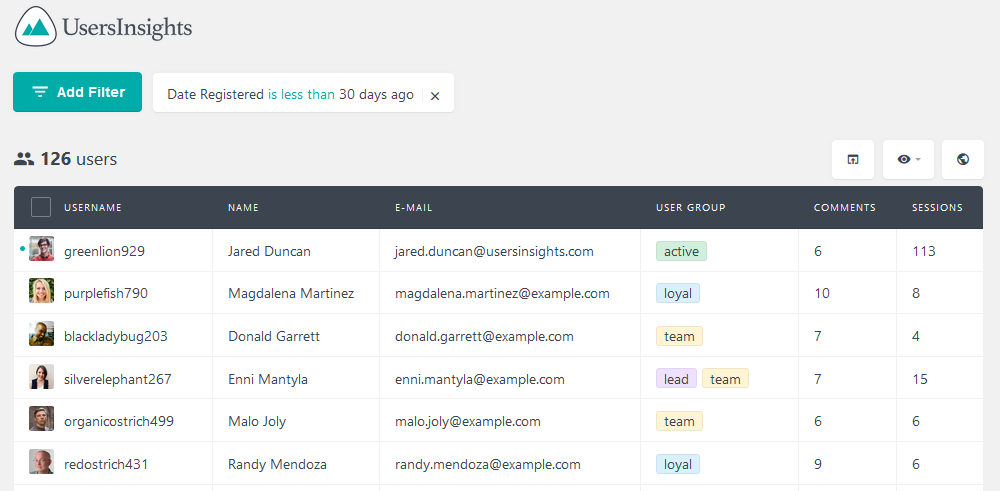
For Users Insights users you can get this number using the date registered filter:
Returning users
This metric usually comes as a proportion. To get the value of this statistic, just divide the number of users that visited your site more than once by the total number of users.
This metric will help you to better understand if your site is growing along with your user retention. This also can be used to modify and understand segmented user behaviors. Usually returning users spend more time on your site, and visit more pages. So you can segment the other WordPress user statistics we’ve seen so far in order to better understand your audience.
It’s possible to improve this metric using relationship marketing concepts. You could, for example, create daily content, or have discounts for returning customers.
When using the Users Insights plugin you can see the returning users by filtering the number of sessions your users have. If they have more than one session they have multiple visits instead of just one.
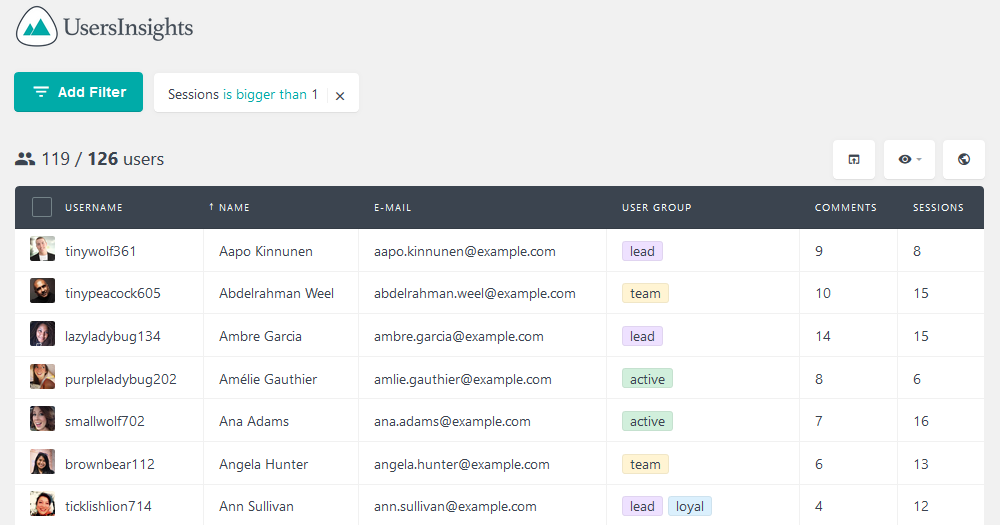
Now you just need to divide this by the total number of users you have and you’ll get the returning users percentage.
This can be used as a modifier of other user statistics, when you analyze the lifetime value of a returning user, for example, it’s very likely to be different from the users with a single visit.
Traffic sources
Now it’s time to get to know where your users are coming from. The traffic sources will tell you what kind of traffic you have, and which market efforts are paying off. Regularly we divide the traffic sources as:
- Direct – users that type your URL in the address bar of the browser or click on a bookmark
- Organic search – traffic from search engines, counting only the free traffic sources
- Paid search – traffic from search engines, via paid ads and campaigns
- Referrals – any site that is linking to your site
- Other – it’s either traffic that couldn’t be identified or traffic from other campaign types (such as newsletters)
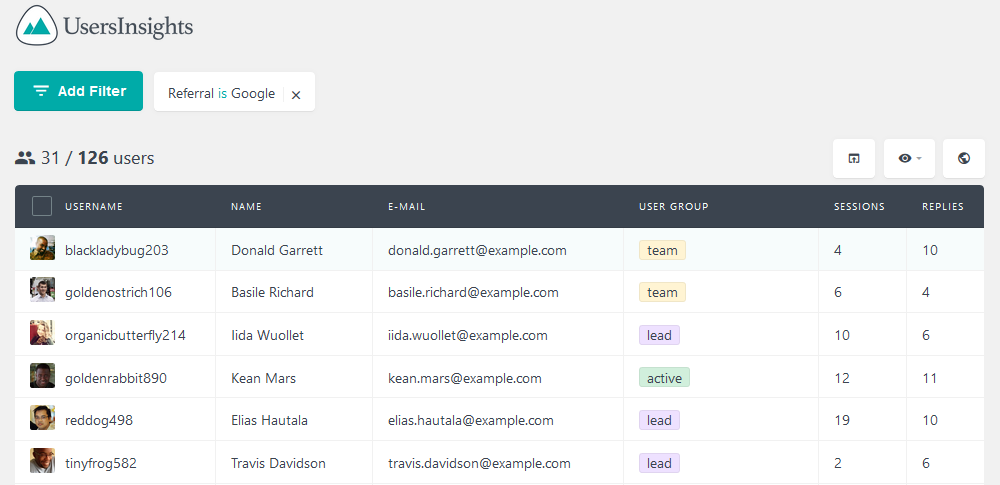
But in order to measure this for registered users you need to actively ask them for it. So you can use a plugin such as ACF Pro to add new fields to your register form. We also have a guide on How to Create custom User Profile Pages with ACF (free).This way you can ask for the referral (be it a specific site or broader choices such as Google).
This way you can measure the traffic sources using the Users Insights plugin to read that custom field:
Comments posted
The number of comments posted usually means that you are talking about an interesting or controversial topic. But looking at the users’ point of view, when they register to post a comment it tells you that they are very interested in that subject.
So you can not only check the number of comments on individual posts but also check which are the users with the highest number of comments. That tells you the most interesting topics but also the most engaged users.
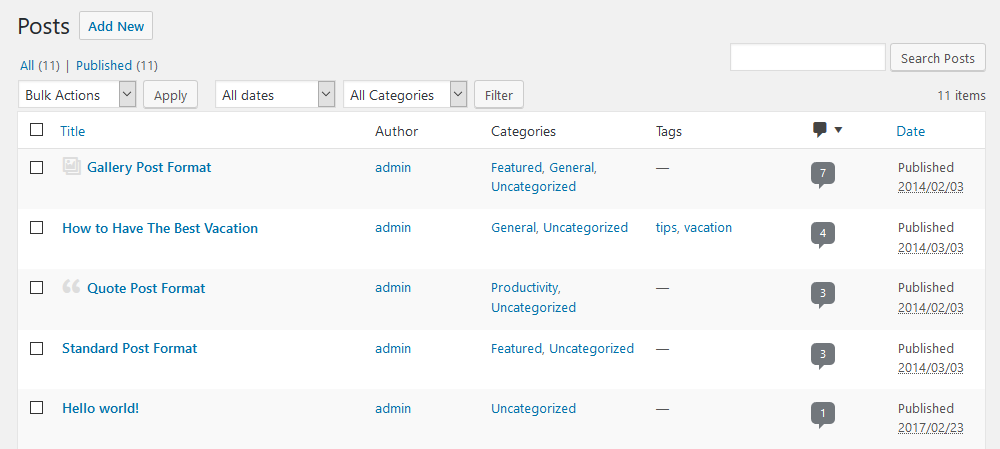
You can check the most commented posts with no plugins. Just go to the WordPress Dashboard > All Posts and click the comment icon twice. The first click will order them in ascending order, second will order them in descending order. Now you can just browse through them
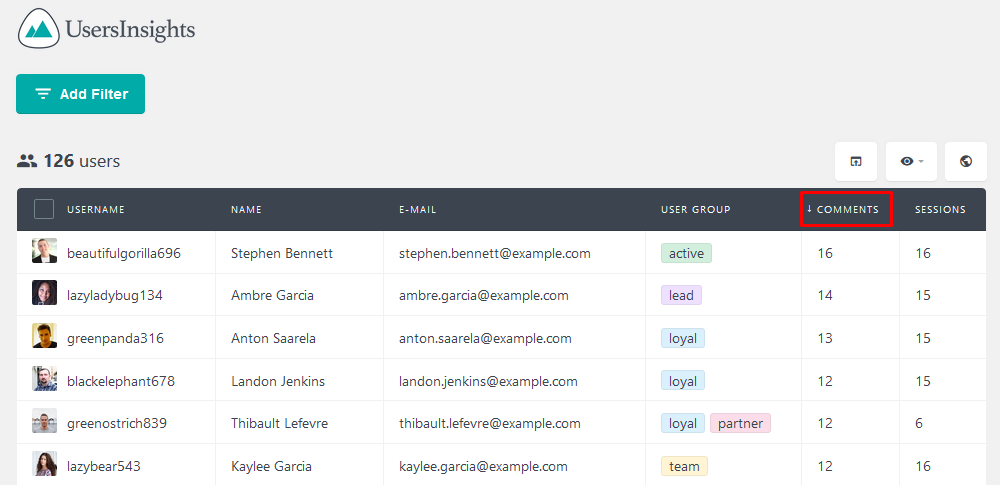
As for the top users, you can use the Users Insights plugin to order all your users by comments:
You can act on this metric by trying to spread what is special about these top pages to your other pages. Also, you can try to better understand these top users and see how you can grow that into other users as well.
Posts created
If you have a site with multiple contributors, or a site where users can create content it’s very important to know which are the most active users. This is great if you have a forums system, or even a social site where custom post types are created by users. Understanding your top contributors is key to replicating that on the other users as well, or focusing your marketing efforts on that user demographics.
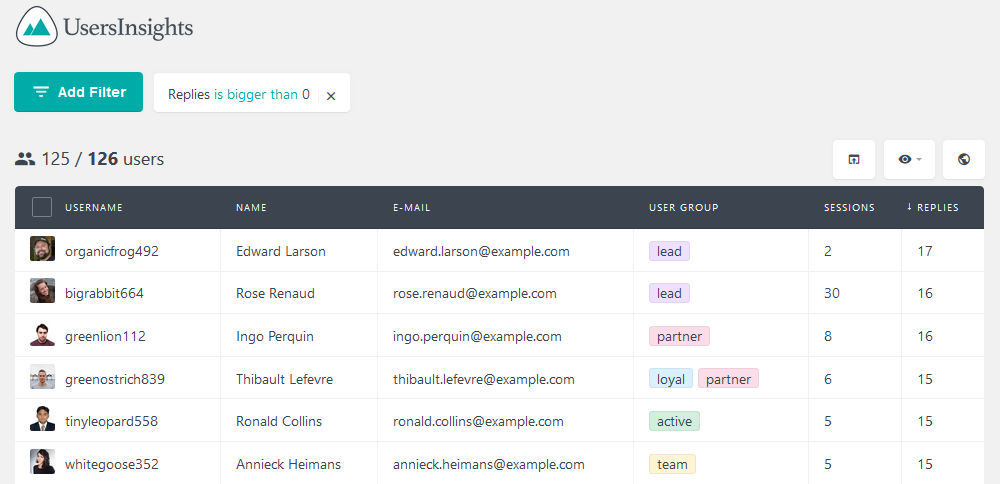
You can get this metric with Users Insights. Depending on the plugin you are using to create these posts you may just use one of its modules (such as the bbPress module). If your plugin doesn’t have a module you just need to activate that Custom Post Type under Users Insights > Custom Post Types. Once you’ve done that you just need to order users by the number of posts created. In this example we’re ordering by topic replies, coming from bbPress:
Top searched keywords
The top keywords metric shows you what are the search queries your users perform. This way you’ll know the most relevant keywords for registered users.
You can also measure how successful your users are in these searches. This can be done with plugins such as Search Meter or Search Keywords Statistics. These plugins applies to all users but you can use some custom code or a different search function for logged in users and measure that as well.
Conversion rates
The conversion rates measure how many users are performing a certain task. Usually this is measured by the number of users who buy a certain product, or subscribe to a newsletter.
In general, it’s better if you measure your conversion rates in pages with a specific goal. So, articles or tutorials may not be the best place to do that. On the other hand, a landing page for list building is a great place to measure it.
You may also want to compare different conversion rates for different versions of the same page. A / B testing is really powerful and even simple things such as changing your button color can change your results.
Conclusion
Today we looked into multiple metrics you can use to improve your understanding of your registered users. These WordPress user statistics will help you build a better website. Once you understand your audience, you can act on it and improve your performance.
We hope you enjoyed it, and see you next time!