How to track and measure User Engagement in WordPress
User engagement metrics are incredibly important to measure success. They paint a better, deeper picture than simple visits or sales. In this article, our goal is to better understand how and why to track user engagement. In addition, we look into tools and methods to collect this data, and how to get valuable insights from it.
It may seem weird to think about it, but unique visitors aren’t the best metric for sites in general. Of course, they are important. And it is great when they are increasing. But these metrics alone won’t tell us much about the future.
In addition, sales and visits may hide bigger silent issues. As users won’t always know how to perform tasks with your product, they may give up. Therefore, you can have customers, who bought your products and who could get a lot of value from it. But they aren’t, simply because they aren’t using it. This is true from the simplest products to the more complex services.
We all have stories from products that we bought and didn’t use, including online products. And it’s very likely that we simply won’t buy them again.
That’s the problem: Sales and traffic show our current state, but engagement tells our future.
Sales and traffic show our current state, but engagement tells our future.
When you measure user engagement, you know immediately when there’s something wrong with your products. And the beauty of online products or services is how easy it is to create relevant metrics. While it’s impossible for a pencil brand to measure usage, an online to-do list can do that in a heartbeat.
Therefore, we can create metrics to measure what we need using active and passive data collection. And we can use plugins such as Users Insights to make sense of this data.

What user engagement metrics are?
The dictionary definition is quite simple. User engagement metrics are assessments we make regarding usage of products or services over time. And this doesn’t need to be digital. You could even create your own personal engagement model, for example. Here are some online and offline examples for clarity:
- Pages read per day of a book
- Time spent watching lessons for an online course
- How many times the app was launched per day
- How many actions (like, share, comment, scroll to load more) made in a social media site
- Clicks on the newsletter link
- Pages visited and time spent per page
It is important to notice that often these metrics assess value as well. Therefore, we are not simply counting user actions, we measure actions the user take that have value for them. This is important to measure important interactions, not simply interactions.
For instance, in our book example, we could count how many times the reader has picked it up. After all, the act of picking up the book is an interaction, isn’t it? Well, but our user could be just moving that book around. And if we measure that we end up with a skewed metric that doesn’t give the real value of our product.
And that’s when things get harder.
Since we measure value, the actual metric depends on what you do. For some, “pages visited” may be a good customer engagement metric, such as in a blog. For others, like an online game, page visits mean little, and “time spent” or “actions done” are more important.
In addition, there are different user engagement strategies and metrics that are vital. For example, user cancelation, downgrades, updates, and sales are at the top of our list. And they are even more important, as they can be used as a reference for other metrics. It’s possible to track down customer engagement and actions prior to these events. Then we can figure out why they are happening, and how to prevent (or increase for sales).
For example, you may have a membership site. And you know that once a user is interacting with less than 3 lessons per month, there’s a 90% chance of subscription cancelation. Now you can take action as soon as users start to watch fewer lessons and prevent that.
How to measure and increase user engagement
Frequently, we just want a good starting point to test the waters. Therefore, if you don’t know which metrics you should measure, it is good to simply look at the industry standards. In addition to a simple framework, you have a point of comparison to measure your performance.
There are standard measures for sites. Here are some and a short explanation:
- Page visits per session – This measures how many different pages a user has visited in a single session
- Sessions per period – This metric is how many different sessions a user has in a given month, week, semester…
- Content created – This measures the user interaction via comments, posts, topics, questions or any other form of user content creation
- Products ordered – Sales for a single user, which is important to show your repeat buyers
- Entry sources – This can be used to measure engagement with other media formats. For example, if that user’s entry source is mainly your newsletter, it means that they are engaged to it. Same for social media sites, partners and others
Measuring these can be easy if you are using WordPress. You can use the custom user fields and a simple plugin to add this information to your users. The downside is that this works mostly for logged in users.
No doubt that individual user metrics are important. But we need to measure aggregate metrics as well. You can do that by averaging the metrics you have above and by creating site-wide metrics.
For that, the DAU, WAU, and MAU are the most common user engagement metrics. They are simply acronyms for Daily Active Users, Weekly Active Users, and Monthly Active Users. Essentially, the point here is how you define “active user”. It could base based on user sessions, comments, orders, software actions.
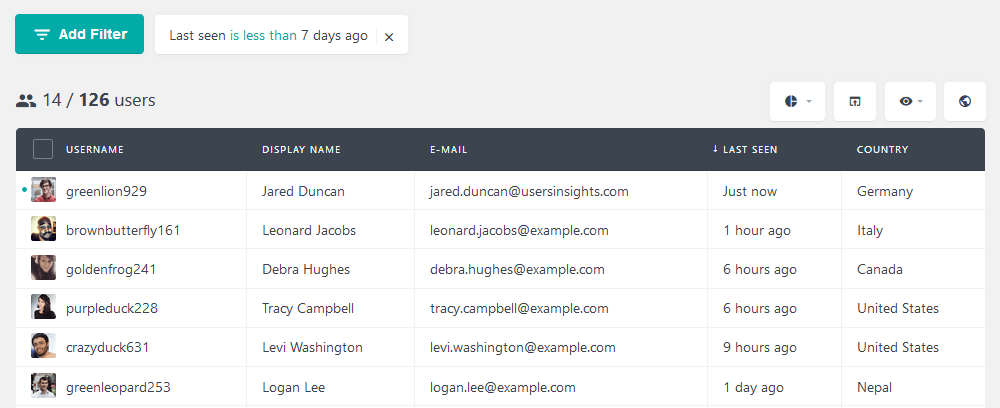
It is easy to generate reports for DAU, WAU, and MAU with Users Insights once you have that defined. For instance, if our key action is simply user login we can filter users based on “last seen”:
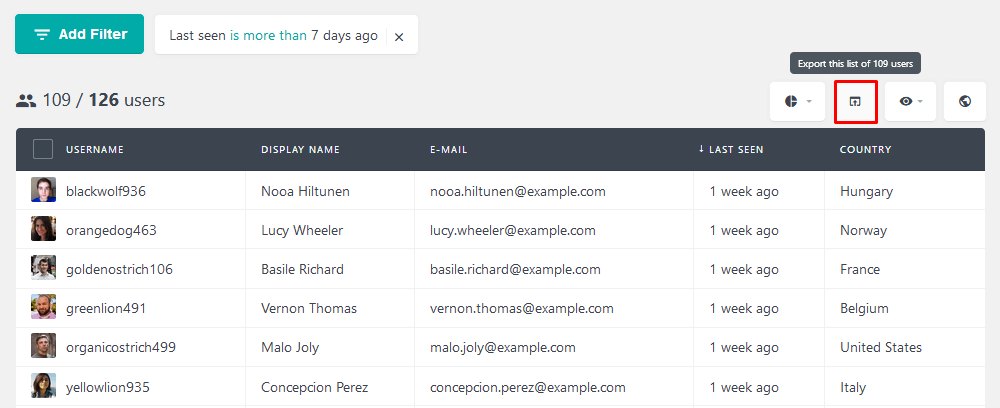
You can generate the opposite report as well. With it, it’s simple to get in touch with users and try to get them engaged again. You can export the not-WAU and get in touch with them using MailChimp.
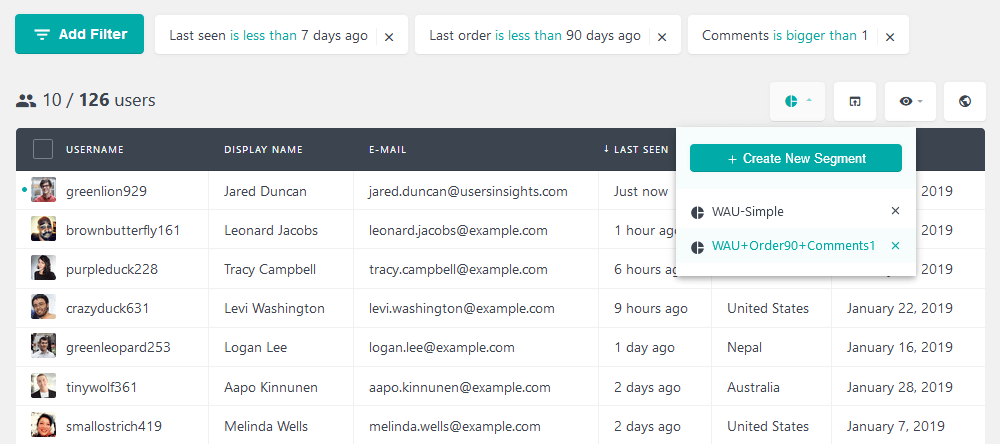
Since our goal is to generate these reports often, the segments feature is a lifesaver. With it, we can save our current search and apply it again with a single click. As a result, complex activity filters can be applied quickly. If your activity is based on login, comment, and orders, for example, you can save this for later use
How to understand the metrics and make decisions based on them
Although it is impossible to showcase all possible actions, here we show you some common metrics and actions to take.
The first step is surely defining your metrics, and if possible, write down why they are important as well. If you noticed that users who post X comments without replies stop posting, it is important to write that. This is good to define yet another vital point of your metrics, your thresholds.
Your user engagement metrics thresholds define when you need to take actions for individual users, and for your site.
Acting on individual users is a great opportunity to fix the exact actions you want. Some users may be commenting too little, while others may have too little lessons completed.
In addition, understanding your funnel and workflows is important. If you know that after X days of their purchase users log in, you can contact them and fix this should that not happen.
Furthermore, there are external actions that affect your site. For example, sites like Airbnb allow users to invite others in exchange for discounts for both. It’s certainly a good idea to track down highly engaged users to offer them these programs. That’s because you’d turn an already good advocate, into a better one. In addition, they may bring in other users with the same mindset.
Conclusion
Today we saw what User Engagement is, and how to use this in your site. In addition, we looked into different ways to track and create reports. By the end of the day, you should be able to create your customer engagement strategy, based on your metrics.
We hope you enjoyed and see you again next time!