Creating advanced LearnDash and bbPress user activity reports
We all know that WordPress has a great ecosystem. Lots of great plugins, and lots of great solutions for many problems. But the real magic happens when we can use these products in combination to solve even bigger problems. That’s the case for LearnDash and bbPress.
When you register your users for online courses it’s always good to give them a good platform for learning, asking questions and sharing their thoughts. That’s why LearnDash and bbPress are great for each other. While LearnDash will help you create awesome courses, bbPress allows you to create forums and help your users to ask questions and learn even more.
Today we’ll better understand how you can use these two tools in combination, and also how you can use the Users Insights plugin to make sense of all your user data that is sometimes hidden in these platforms.
Our main topics for today are:
- LearnDash and bbPress synergy
- Understanding your LearnDash users
- Filtering your bbPress user data
- How to combine bbPress and LearnDash user activity data
So, let’s get started!

LearnDash and bbPress synergy
When it comes to online courses, LearnDash is king. It’s the #1 choice for Fortune500 companies, it’s easy to use and flexible. We may think of it as the equivalent to the classroom environment. It allows the teachers to connect with the students. It’s great on its purpose, but it won’t always work the other way around when it comes to connecting the students with the teachers or even connecting students with other students.
And that’s where bbPress shines. It allows a simple way of creating forums, replying to topics and registering user profiles for certain subjects/forums. LearnDash has also an integration module for bbPress, which allows you to restrict forums to enrolled students or particular courses.
This completes the cycle, but still leaves a lot of questions unanswered. Both plugins aren’t aimed for understanding your user data, or filtering trough your users. Now we’ll see how Users Insights can be used to extract information from from these two plugins combined.
Understanding your LearnDash users
After installing LearnDash and Users Insights you need to activate the LearnDash Module under Users Insights > Module options:
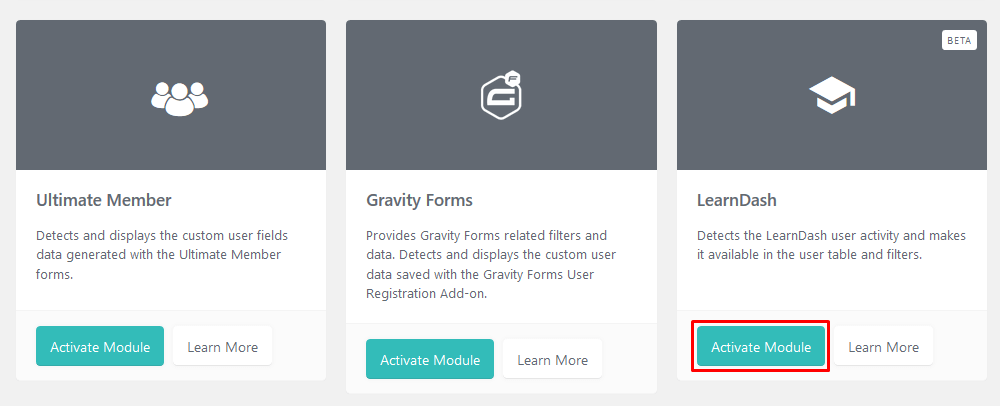
This creates a lot of custom filters and formats so you can read LearnDash data correctly with no further actions needed. Otherwise, you’d need to “translate” serialized fields, date fields and so on.
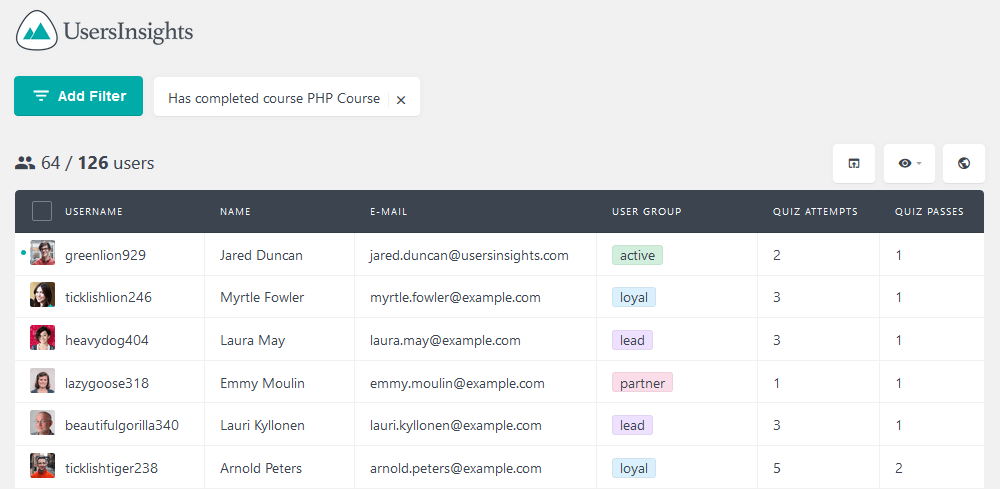
Once you’ve activated the module you can extract and filter your registered users. You can, for example, filter users by a certain course completion:
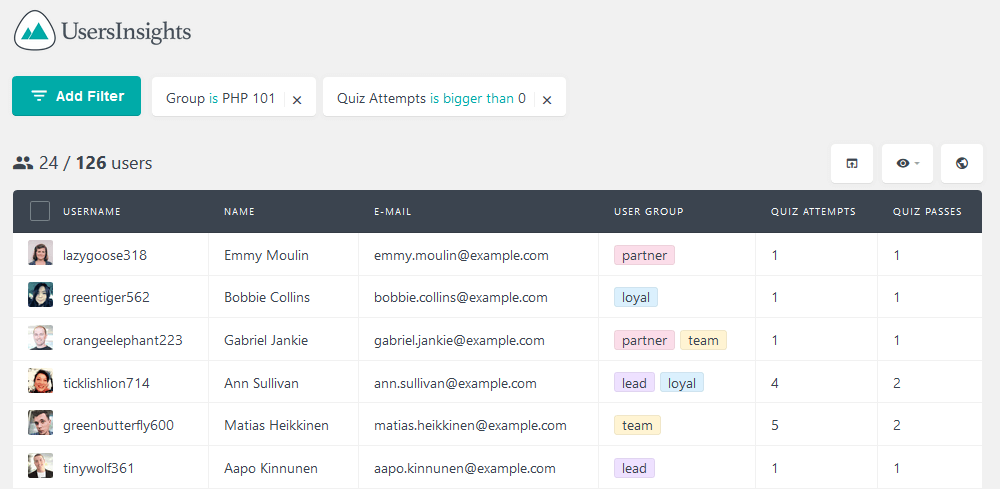
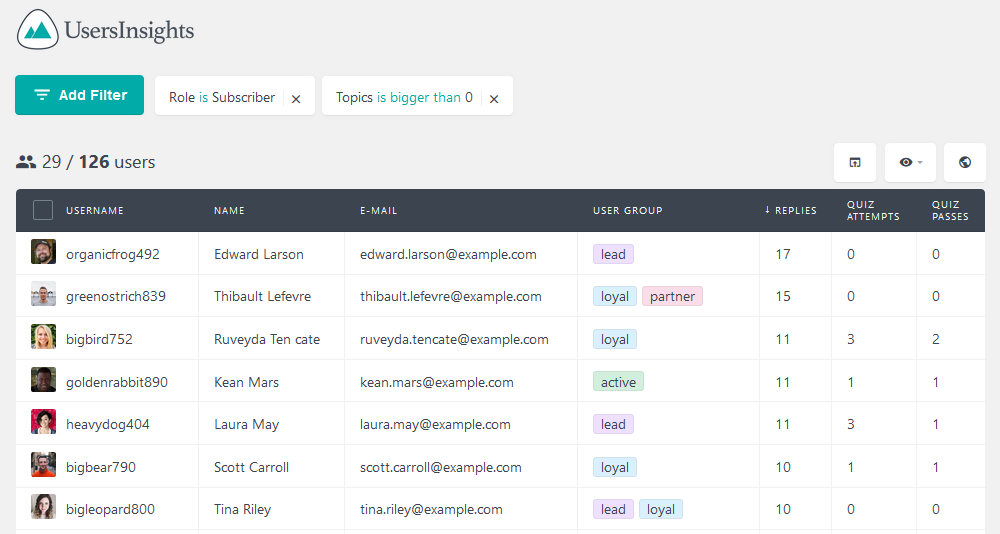
You can also filter the users by a certain group (course) and check which ones have attempted a quiz:
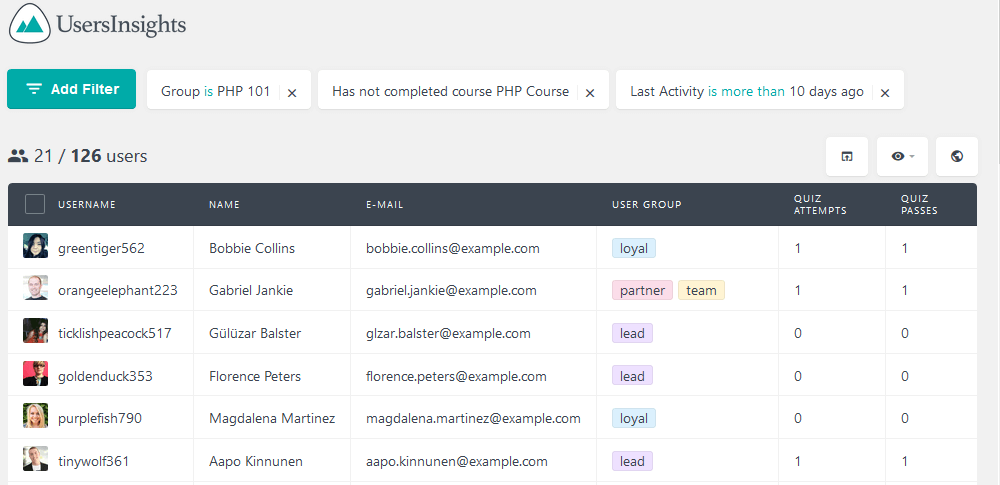
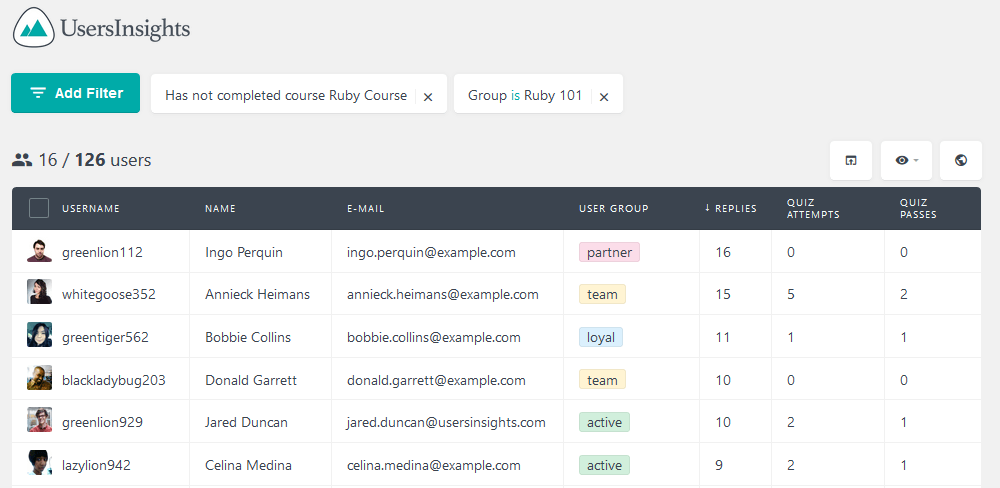
Another idea is finding the inactive LearnDash users who have or haven’t completed a course. In this way you can follow up and offer some help for those who haven’t completed the course or offer new and more advanced courses for the ones who have completed it.
Here is a list of possible LearnDash filters (and more can be added at any moment):
- Lessons Completed is / is bigger than / is smaller than (number)
- Topics Completed is / is bigger than / is smaller than (number)
- Courses Completed is / is bigger than / is smaller than (number)
- Quiz Attempts is / is bigger than / is smaller than (number)
- Quiz Passes is / is bigger than / is smaller than (number)
- Last Activity is less than / is more than / is exactly (number) days ago
- Last Activity is after / is on / is before (date)
- Last Activity is set / is not set
- Has completed course (course name)
- Has not completed course (course name)
- Has passed quiz (quiz name)
- Has not passed quiz (quiz name)
- Group is / is not (group name)
All these filters can be used in combination with each other to create searches exactly as you need them to be. For more information on the LearnDash module, visit the LearnDash Features page.
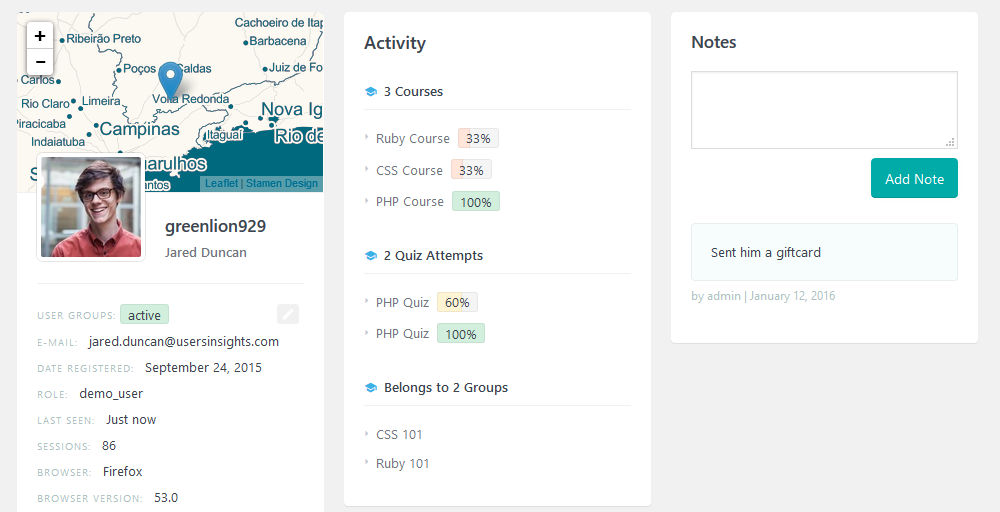
Additionally, when you click the username you’ll see on their profile an overview of their LearnDash activity:
Filtering your bbPress user data
When it comes to user activity in forums the overall experience is much simpler. For now, we have just 3 metrics to follow in bbPress:
- Forums created
- Topics created
- Replies created
You can, for example, filter the users by their roles to list the students only. You can also use the number of bbPress topics or replies created to track the users who are asking questions – that would be the users with a high number of topics created. On the other hand, the users who have a high number of replies and low number of topics created would be the ones that are helping other users.
How to combine bbPress and LearnDash user activity data
Now we’ll dive into how you can combine your stats from bbPress with the comprehensive data from LearnDash to create advanced reports regarding your user activity data.
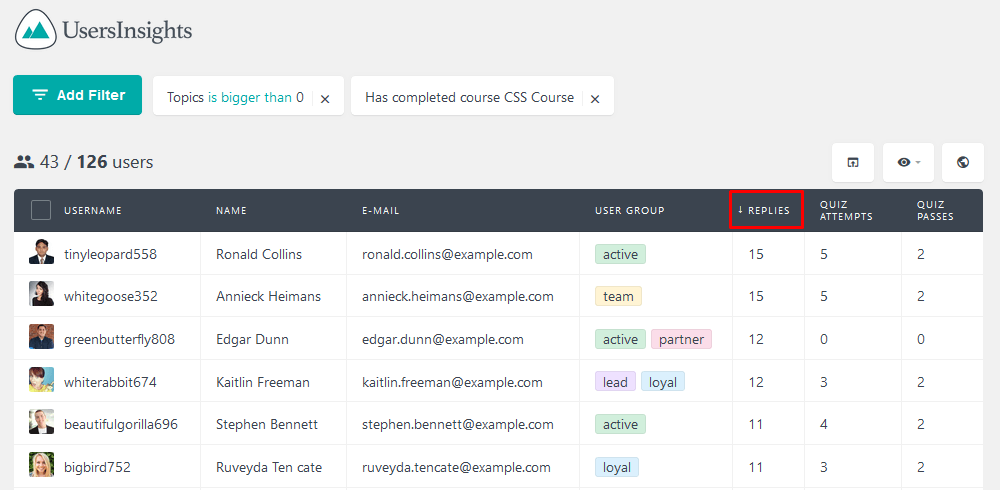
First, let’s look at the relation between course completion and replies. This will help us identify the users who ask for help, help others or just discuss ideas in general.
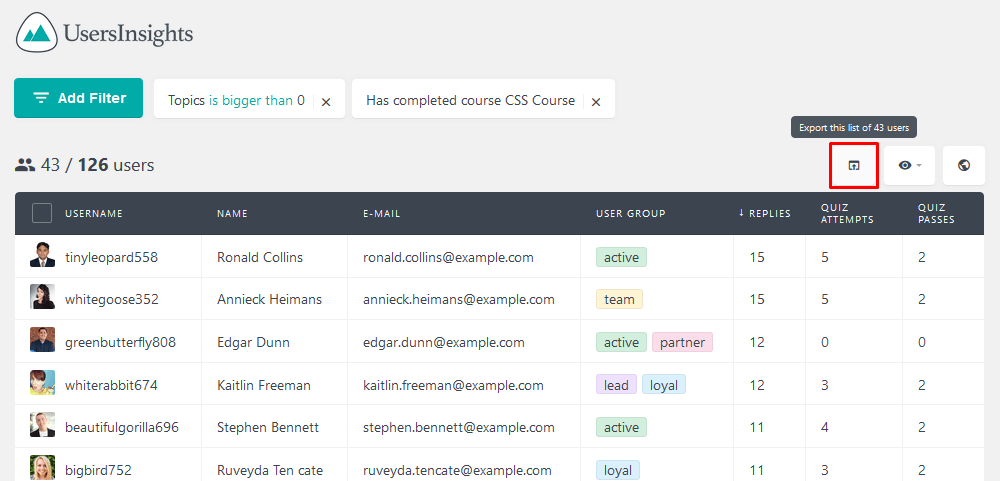
You can export all this data to do some further analysis – for example, the average number of replies for the ones who have and who haven’t completed a course.
When checking the number of users who haven’t completed a LearnDash course make sure to restrict to users of a certain group so you will get all users enrolled to that course. Otherwise, you’ll see users who have enrolled in completely different courses (and that’s why they haven’t completed the current course you are looking into).
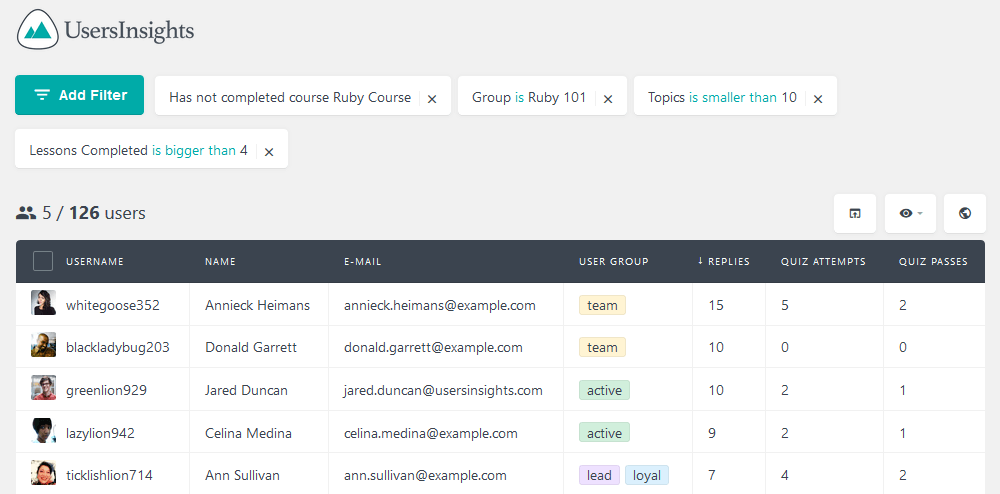
You can do a similar analysis for bbPress topics created and the LearnDash lessons completed. Users with the most lessons completed will probably have a higher amount of topics created since they are further down the course and probably had more questions to ask.
This allows you to interact with users who are a bit shy. For example if in general users by the 4th lesson have created 10 topics (questions) you can identify users who haven’t posted yet, and prevent them from having a hard time further on the course:
Another possible analysis is to check the overall replies by users from certain groups. Keep in mind that users from multiple groups will be counted twice on this kind of analysis.
This allows you to check groups that are better in communicating with each other and check out why this happens. Keep in mind that most of these reports will give you the tip of the iceberg, the interesting numbers. It isn’t possible for these reports to give you the reason behind them, so you will still have some fun looking into these.
Advanced analysis – finding correlations
Now on to the last idea of our current guide, you can check the percentage of a certain stat for your users, in relation to another. For example, you can check the relation between the number of replies of your users and their pass ratio on their quizzes.
This will help you identify trends and correlation and act to improve these stats. For example, you can affect the “pass ratio” with incentives to more replies if there is a clear correlation between these two in your data set.
In order to get this working correctly, we’ll need to export our data and use a spreadsheet manipulation software such as Excel.
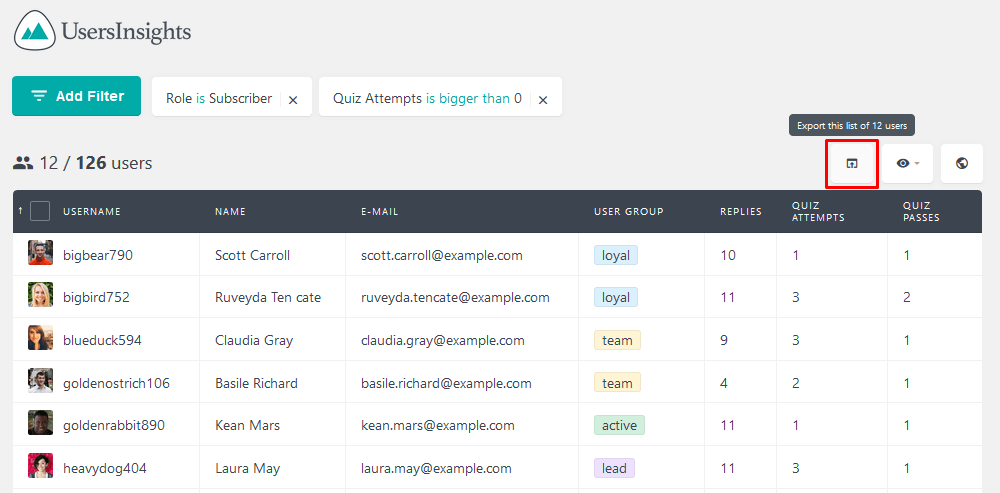
Therefore you need to export our data and for that, you need to make all the required columns visible and click the export button. For our example, we need the bbPress Replies, LearnDash Quiz Attempts and LearnDash Quiz Passes columns. We’ll also going to limit the user list to subscribers to remove our admins. And finally we’ll filter out the users who have no quiz attempts to remove users who just got started with their courses.
Now you have a CSV file with all this data and you can work with it. Our first variable created will be the pass ratio, which is the quiz passes divided by the quiz attempts (which includes the passes and fails).
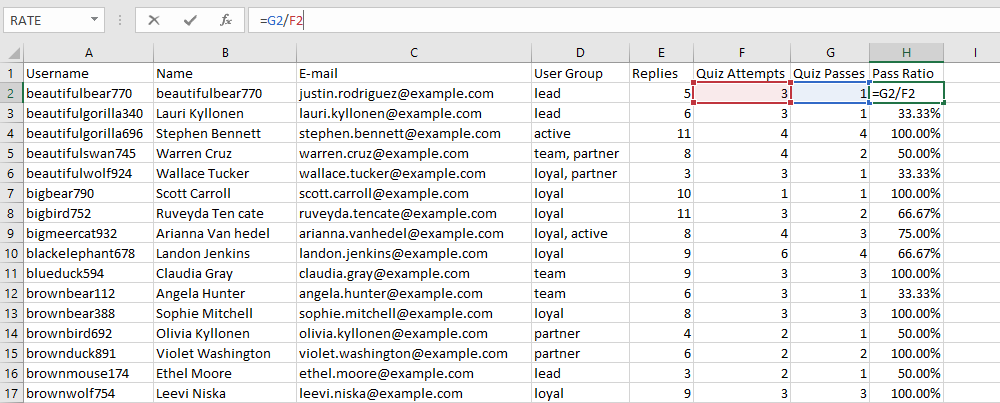
Now it’s easy to check now how successful each student is in their quiz attempts. We want to understand why this happens.
The next step is finding the bbPress replies to LearnDash quiz attempts ratio, so we can weight correctly how many topic replies each user is adding per each quiz. Otherwise, users that have more courses or are more advanced in a certain course will cause distortions in your data set since they inherently have more replies on the forums.

That’s it, we have our data set processed in a way that we can see the accuracy for each user, and how much they have discussed the topics on average per each attempt.
Since we want to know how much each reply contributes to a higher accuracy, we need to find the correlation between these two. This can be done with the CORREL function in excel, which will define the statistical correlation between variables and give us a score from -1 to +1 of how two variables are correlated.
For this function the +1 means perfect correlation, so as X goes up Y will go up and -1 means perfect negative correlation, so as X goes up Y goes down. On the other hand, a score close to zero means no defined correlation, so X will not directly affect Y.
For the CORREL function to work you need to activate the Analysis ToolPack. To do that you need to go to File > Options > Add Ins, select the Analysis ToolPack and click Go. On the next screen just check the Analysis Toolpack and click OK.
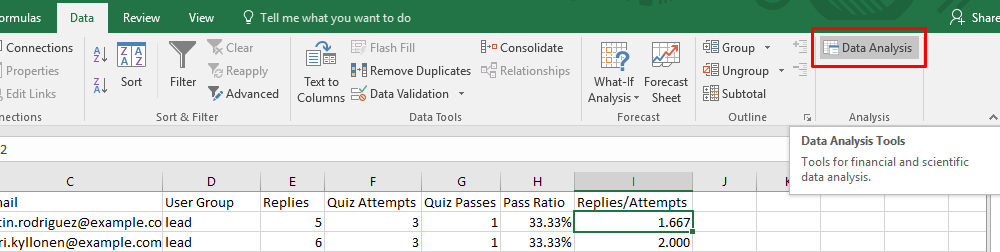
Now select the option under Data > Data Analysis:
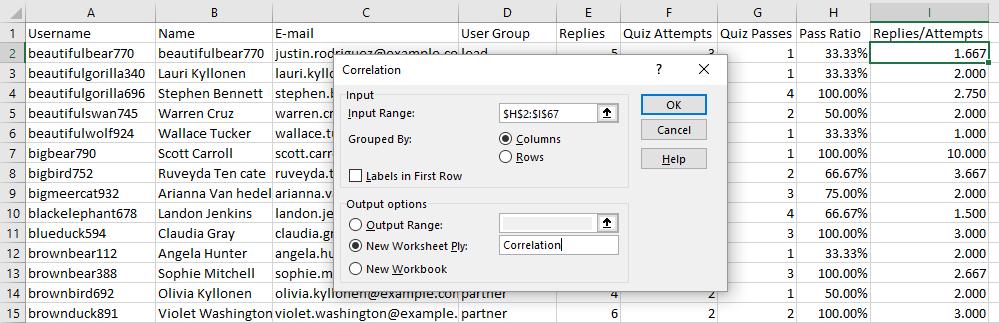
Then select the correlation function on the next screen of your dataset and output options (we recommend using a new spreadsheet)
Then you’ll see a table of the correlation results
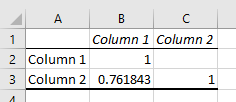
In our case, it means that the reply-ratio and the accuracy-ratio have a correlation of 0.762. This means that there is a strong correlation between these two variables. As a rough reference here is how you can interpret your coefficients:
- -1 : Perfect negative correlation
- -0.7: Strong negative correlation
- -0.5: Moderate negative correlation
- -0.3: Weak negative correlation
- 0: No linear relationship
- +0.3: Weak positive correlation
- +0.5: Moderate positive correlation
- +0.7: Strong positive correlation
- +1: Perfect positive correlation
It’s worth a really important disclaimer: correlation does not mean causation. So once you’ve found, for example, a correlation between your replies ratio and your accuracy ratio you need to dig deeper and find out if there is really a direct causation or if these two are related to yet another metric.
This was just an example that can be tweaked to better suit your needs, but hopefully, this will give you an idea on how you can create your own indexes and reports and how to weight accordingly your user data to avoid distortions in your metrics.
Conclusion
Today we learned how you can use LearnDash, bbPress and Users Insights to create advanced reports about your registered WordPress users and students. We saw how each plugin works individually, and how they work nicely when combined.
We also dived into some basic statistics concepts to create your own indexes and we saw how you can further extend this for your own personal analysis.
We hope you enjoyed it and see you next time!