WooCommerce Product Sales Reports can be a great way to track your sales and product performance over time. In addition to the general WooCommerce reports and WooCommerce customer analytics, Users Insights also includes a dedicated product reports feature. The plugin provides various tools to help you generate reports for specific products, customers, or dates. By default, Users Insights will generate a report for each product sold, which includes WooCommerce sales details, frequently bought together products, variation reports, and more.
The WooCommerce integration of Users Insights comes with the following reports and analysis tools, including:
- WooCommerce Product Reports (on this page)
- General WooCommerce Reports
- WooCommerce Product Category Reports
- WooCommerce Customer Table, Filters and Profiles
To access this feature, visit the Users Insights -> Reports -> WooCommerce Products section and select the product that you wish to analyze.

Once the product is selected, a set of detailed product reports will be displayed on the page. These reports reflect both registered user and guest order data.
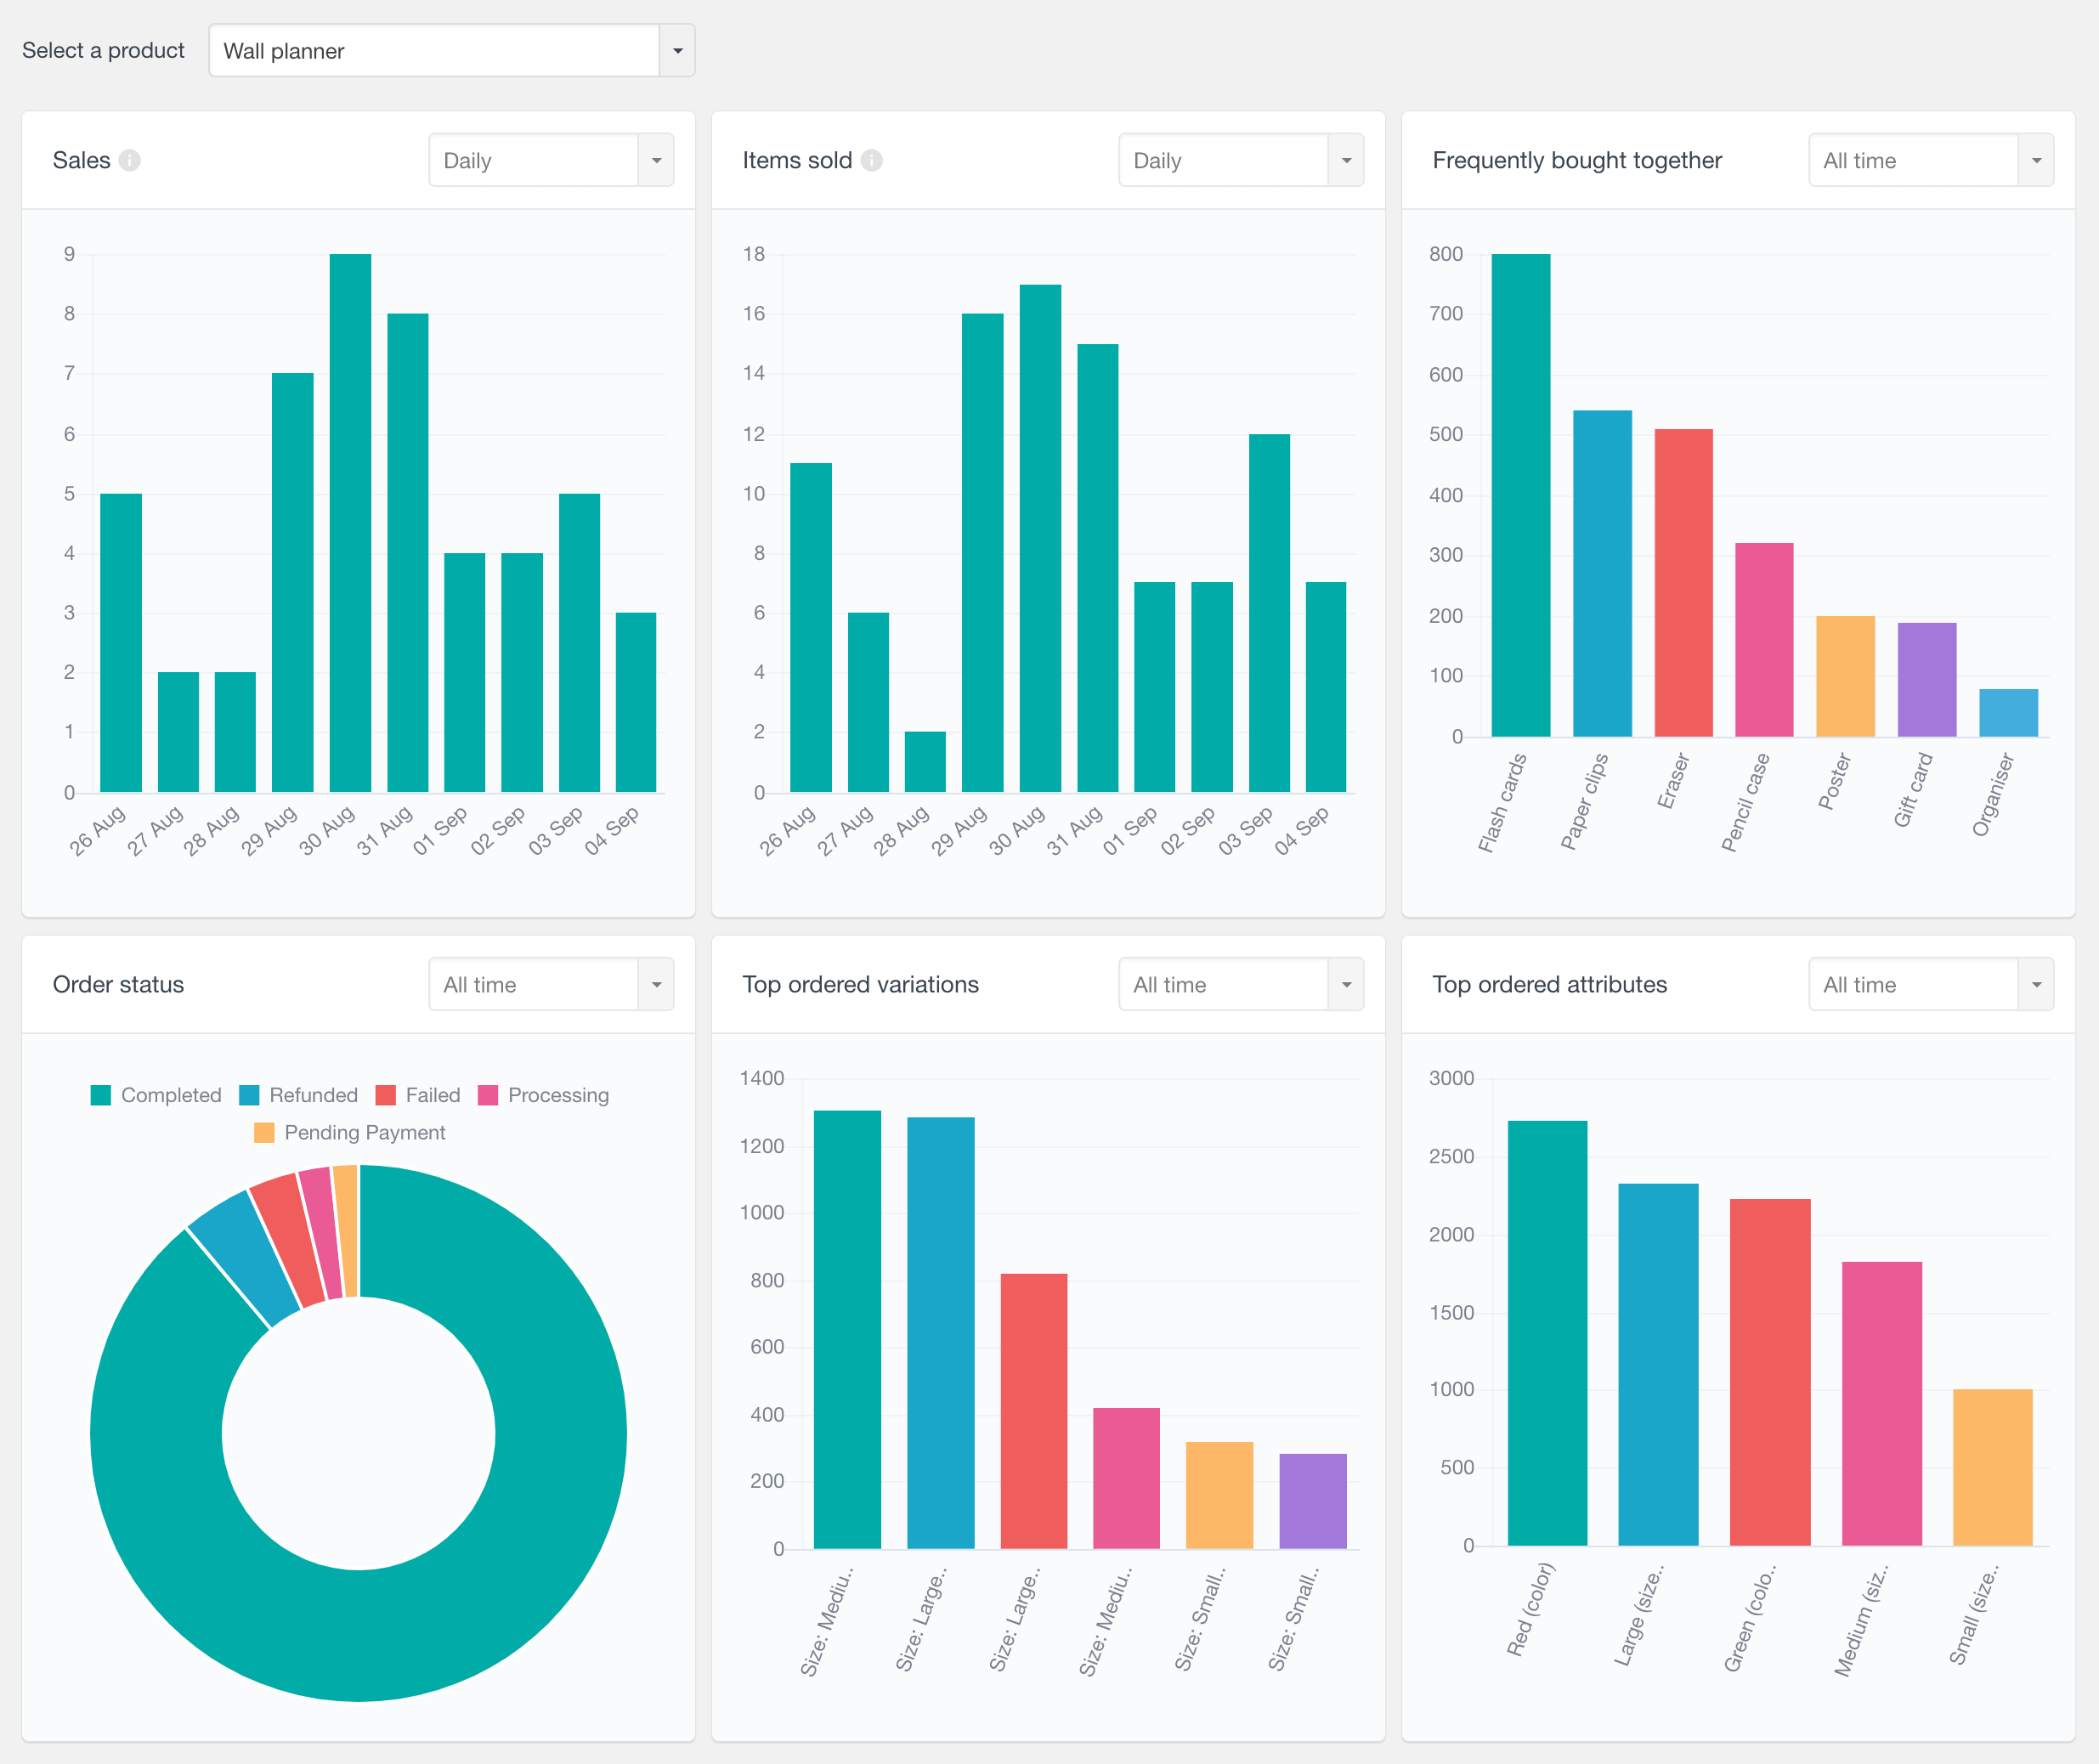
Product Sales Report for WooCommerce
The WooCommerce product sales report shows the number of sales orders over time containing the selected product. A sale (similar to gross sales) is any order with the status completed, processing, or on hold, however, if you wish you can change these statuses using the Users Insights filter hooks. These WooCommerce report sales by product feature support monitoring sales performance for daily, monthly, weekly, and yearly periods and allows moving back in time.


WooCommerce Product Items Sold Report
The Items Sold report shows the number of items purchased in sale orders (orders with status completed, processing, and on hold). This WooCommerce sales report can provide you with a more accurate indication of your product sales, as customers often purchase multiple items of the same product. By comparing this report with the Sales report, you can analyze the average quantity purchased per order. Additionally, it can provide information for daily, weekly, monthly, or yearly periods, and give you the option to view sales data from a previous time period.


Product Items Sold Value Report
The Items sold total report shows the total value of the items sold over time. This sales analysis report can be used as an indication of how much revenue each product generates in your WooCommerce store. With this reporting tool, you can see the total value of items sold in a daily, weekly, monthly, or yearly view, and just like the rest of the time-based reports, you can go back in time to explore previous periods. Please note that partial refunds are not reflected in this report.


Product Cost of Goods Sold (COGS) Report
When the Cost of goods sold feature is enabled under WooCommerce > Advanced > Features, this report provides COGS information specific to the selected product. It includes values from sale orders with status Completed, Processing, or On hold (does not account for partial refunds). Data is available for orders placed after a cost of goods sold amount has been set for the product. This allows you to assess the product’s cost performance over time and identify periods where margins may vary.

WooCommerce Frequently Bought Together Report
The Frequently Bought Together report shows the top products that are most often ordered along with the selected product. This report can be very useful in many ways. For example, you can email the customers who have purchased the selected product a discount code for the top other frequently bought products. Or you can find product combinations that you could bundle together and potentially generate more revenue. This report by default shows the all-time data, however, with the custom report settings, it can be also filtered to show the results for a custom date range. This report counts the number of WooCommerce orders where each product is purchased along with the selected product (regardless of the order status).


Top Order Origin Types and Top Order Origin Sources
The Top Order Origin Types and Top Order Origin Sources charts in Users Insights provide detailed insights into where your WooCommerce orders originate, specifically for a selected product. These reports gather and visualize data based on orders that include the selected product, allowing you to analyze trends over different timeframes, such as the last 30 days, 12 months or a custom period.
- Top Order Origin Types categorizes traffic sources driving orders, such as direct visits, organic search, or referral links.
- Top Order Origin Sources goes further to identify specific channels or campaigns, such as UTM tags, referral URLs, or specific ad campaigns.
These reports can help you assess the effectiveness of your marketing channels, pinpoint high-performing traffic sources, and optimize efforts to maximize conversions.


WooCommerce Top Ordered Variations Report
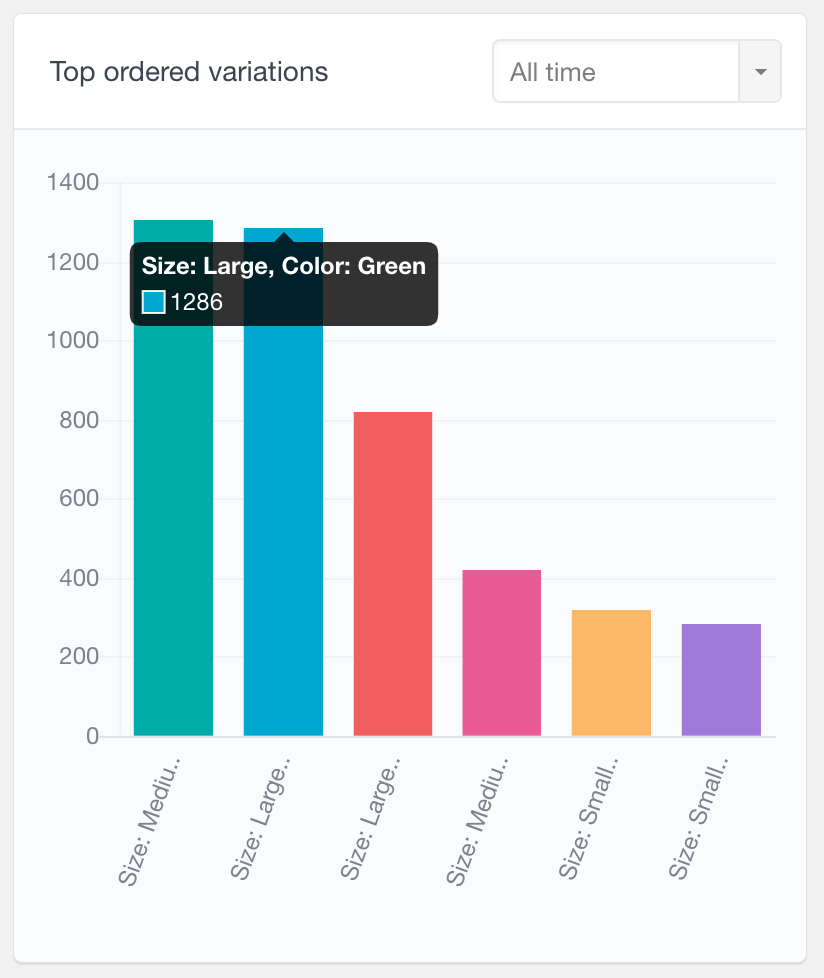
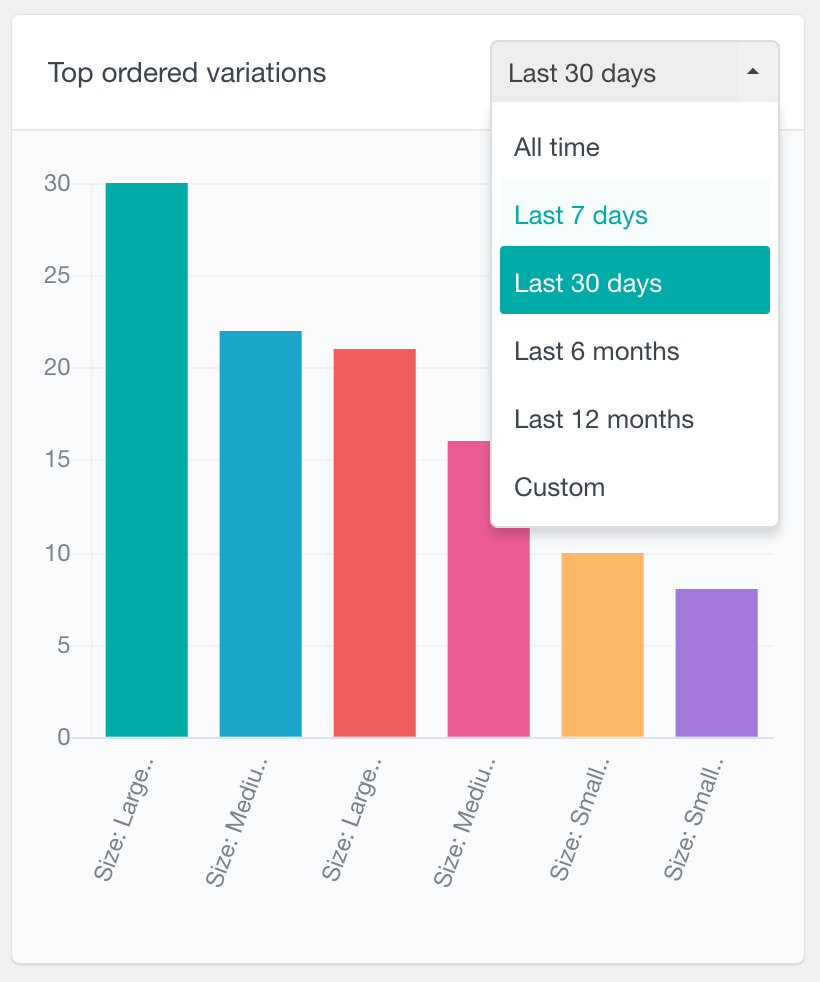
If you have variable products, this report can help you to understand which variations of your product are most popular among customers. Additionally, this report can help you identify any potential trends in ordering behavior, so you can adjust your inventory accordingly. Hovering over each bar in the chart shows the name of the product variation and the number of orders where that variation appears. Similarly to the other reports, this report can be further customized to show the results for a specific period.
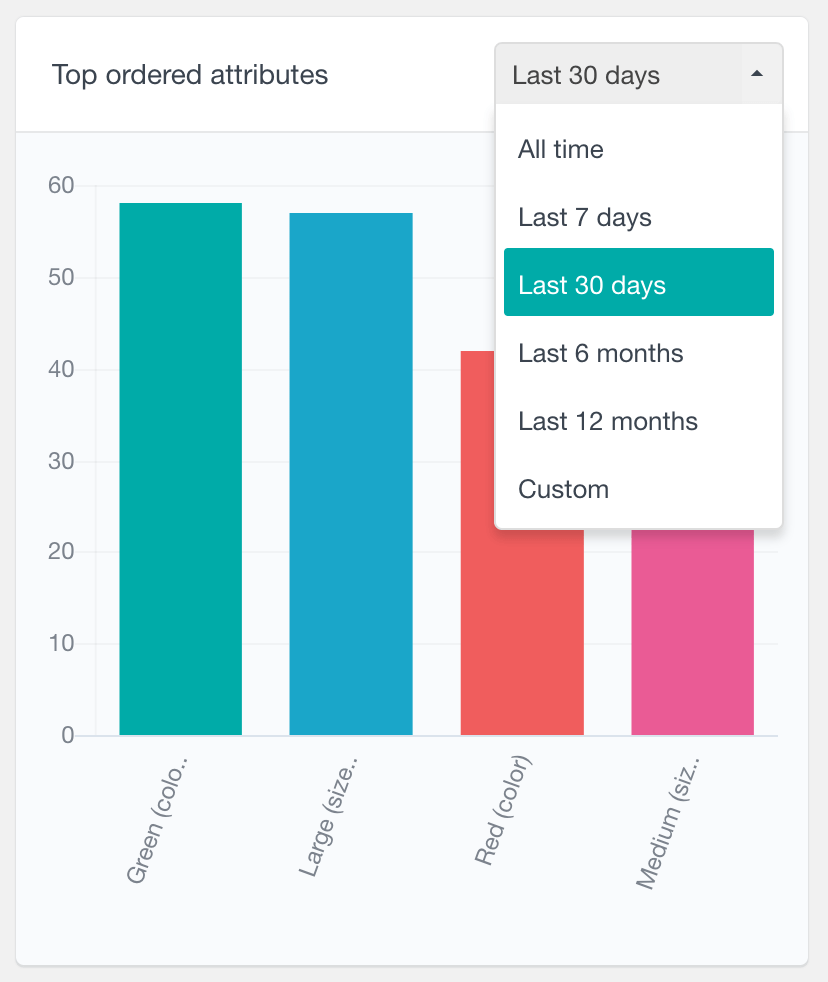
WooCommerce Top Ordered Attributes Report
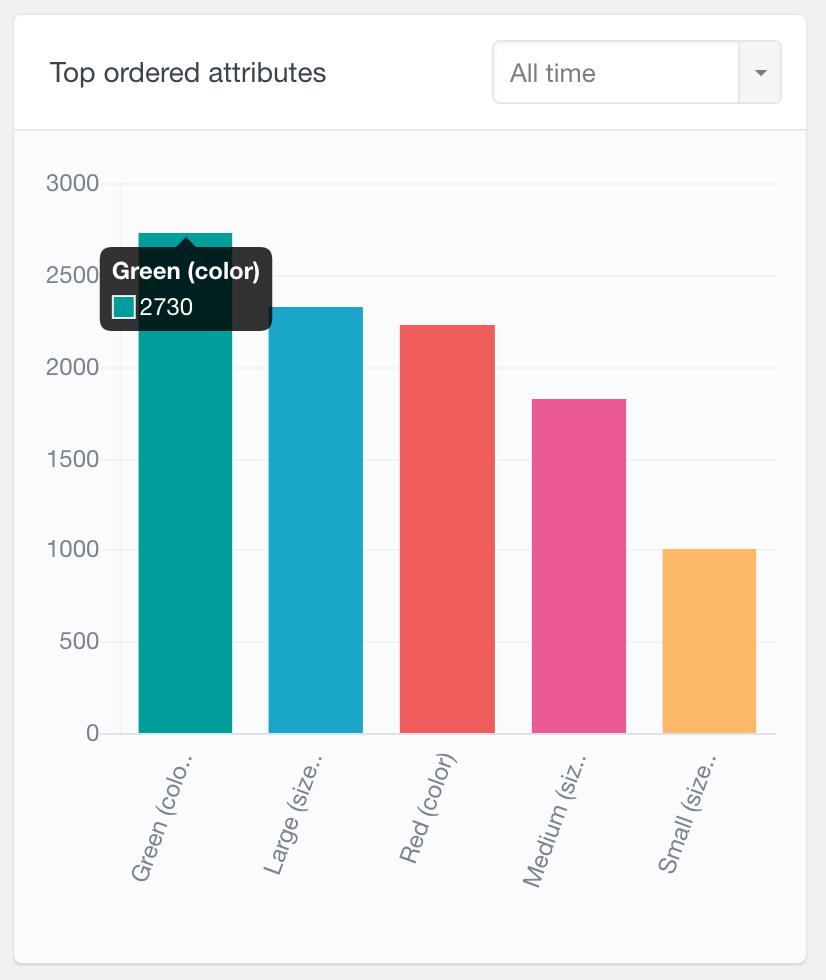
With this report, you can further analyze the performance of your WooCommerce variable products. It detects the top ordered variation attributes separately, counting the number of orders in which each attribute appears. Looking at variation sales alone can help you find the most popular variations, and this report on the other hand can be a good reporting tool to help you analyze your customers’ overall preferences. For example, if your product variations consist of two attributes – color and size, and you have many different variation combinations of all colors and sizes, with this report you will be able to clearly see which color and which size are most popular individually. The report by default displays the all-time data, but it can be further filtered by a date range.
WooCommerce Product Orders by Status report
The Orders by status report categorizes orders containing the selected WooCommerce product, using colors to visually represent the status of each order. It is a periodic report, providing daily, weekly, monthly and yearly intervals. Additionally, you can choose to hide any of the statuses just by clicking on its corresponding label. In this way, you can explore the trends within a specific group of statuses.


Product Order Status Report
Another tool allowing you to analyze the order statuses for the selected product is the “Order Status” report. It is visualized as a pie chart, where hovering over each slice shows the number of orders that exist with the corresponding status. It shows all-time data, however it can be also filtered to show the results for the last several days, months, or a custom period. The order status report can be useful for monitoring customer satisfaction for the selected product just by checking the number of refunded orders over time.


WooCommerce Product Performance Comparison Report
The Product Performance Comparison chart allows you to compare the performance of orders containing the selected product for the most recent periods versus the previous period. It provides number of orders, sales and refunds for periods like last 7 days, last 30 days, last 6 months and last 12 months, along with a comparison with the previous period. This report can be a a valuable tool for tracking the growth and trends of your store.


More Advanced WooCommerce Reporting
The Users Insights report plugin also provides some general WooCommerce analytics and reports to help you further analyze your store’s sales performance. Find your most popular and most refunded products, explore customer billing locations, coupon usage, and much more. Visit the WooCommerce Reports page to find out more, and for other general WordPress reports, including other plugin reports, visit the WordPress reports page.

Customer Report by Product
In addition to the visual chart reports, you can also use the Users Insights plugin to generate a customer report by product and create your own WooCommerce customer analytics report to monitor metrics like customer spending and WooCommerce sales by customer. Users Insights provides various filters allowing you to search your WordPress user data, including an option to filter by the products that they have purchased right from the WordPress dashboard. To learn more, visit the WooCommerce page.

