The Tutor LMS module in Users Insights has a range of visual chart reports to help you analyze student activity and course performance. These reports give you the data to make informed decisions about your eLearning platform. All reports are found in the Users Insights Reports section under the Tutor LMS group.
Tutor LMS New students report
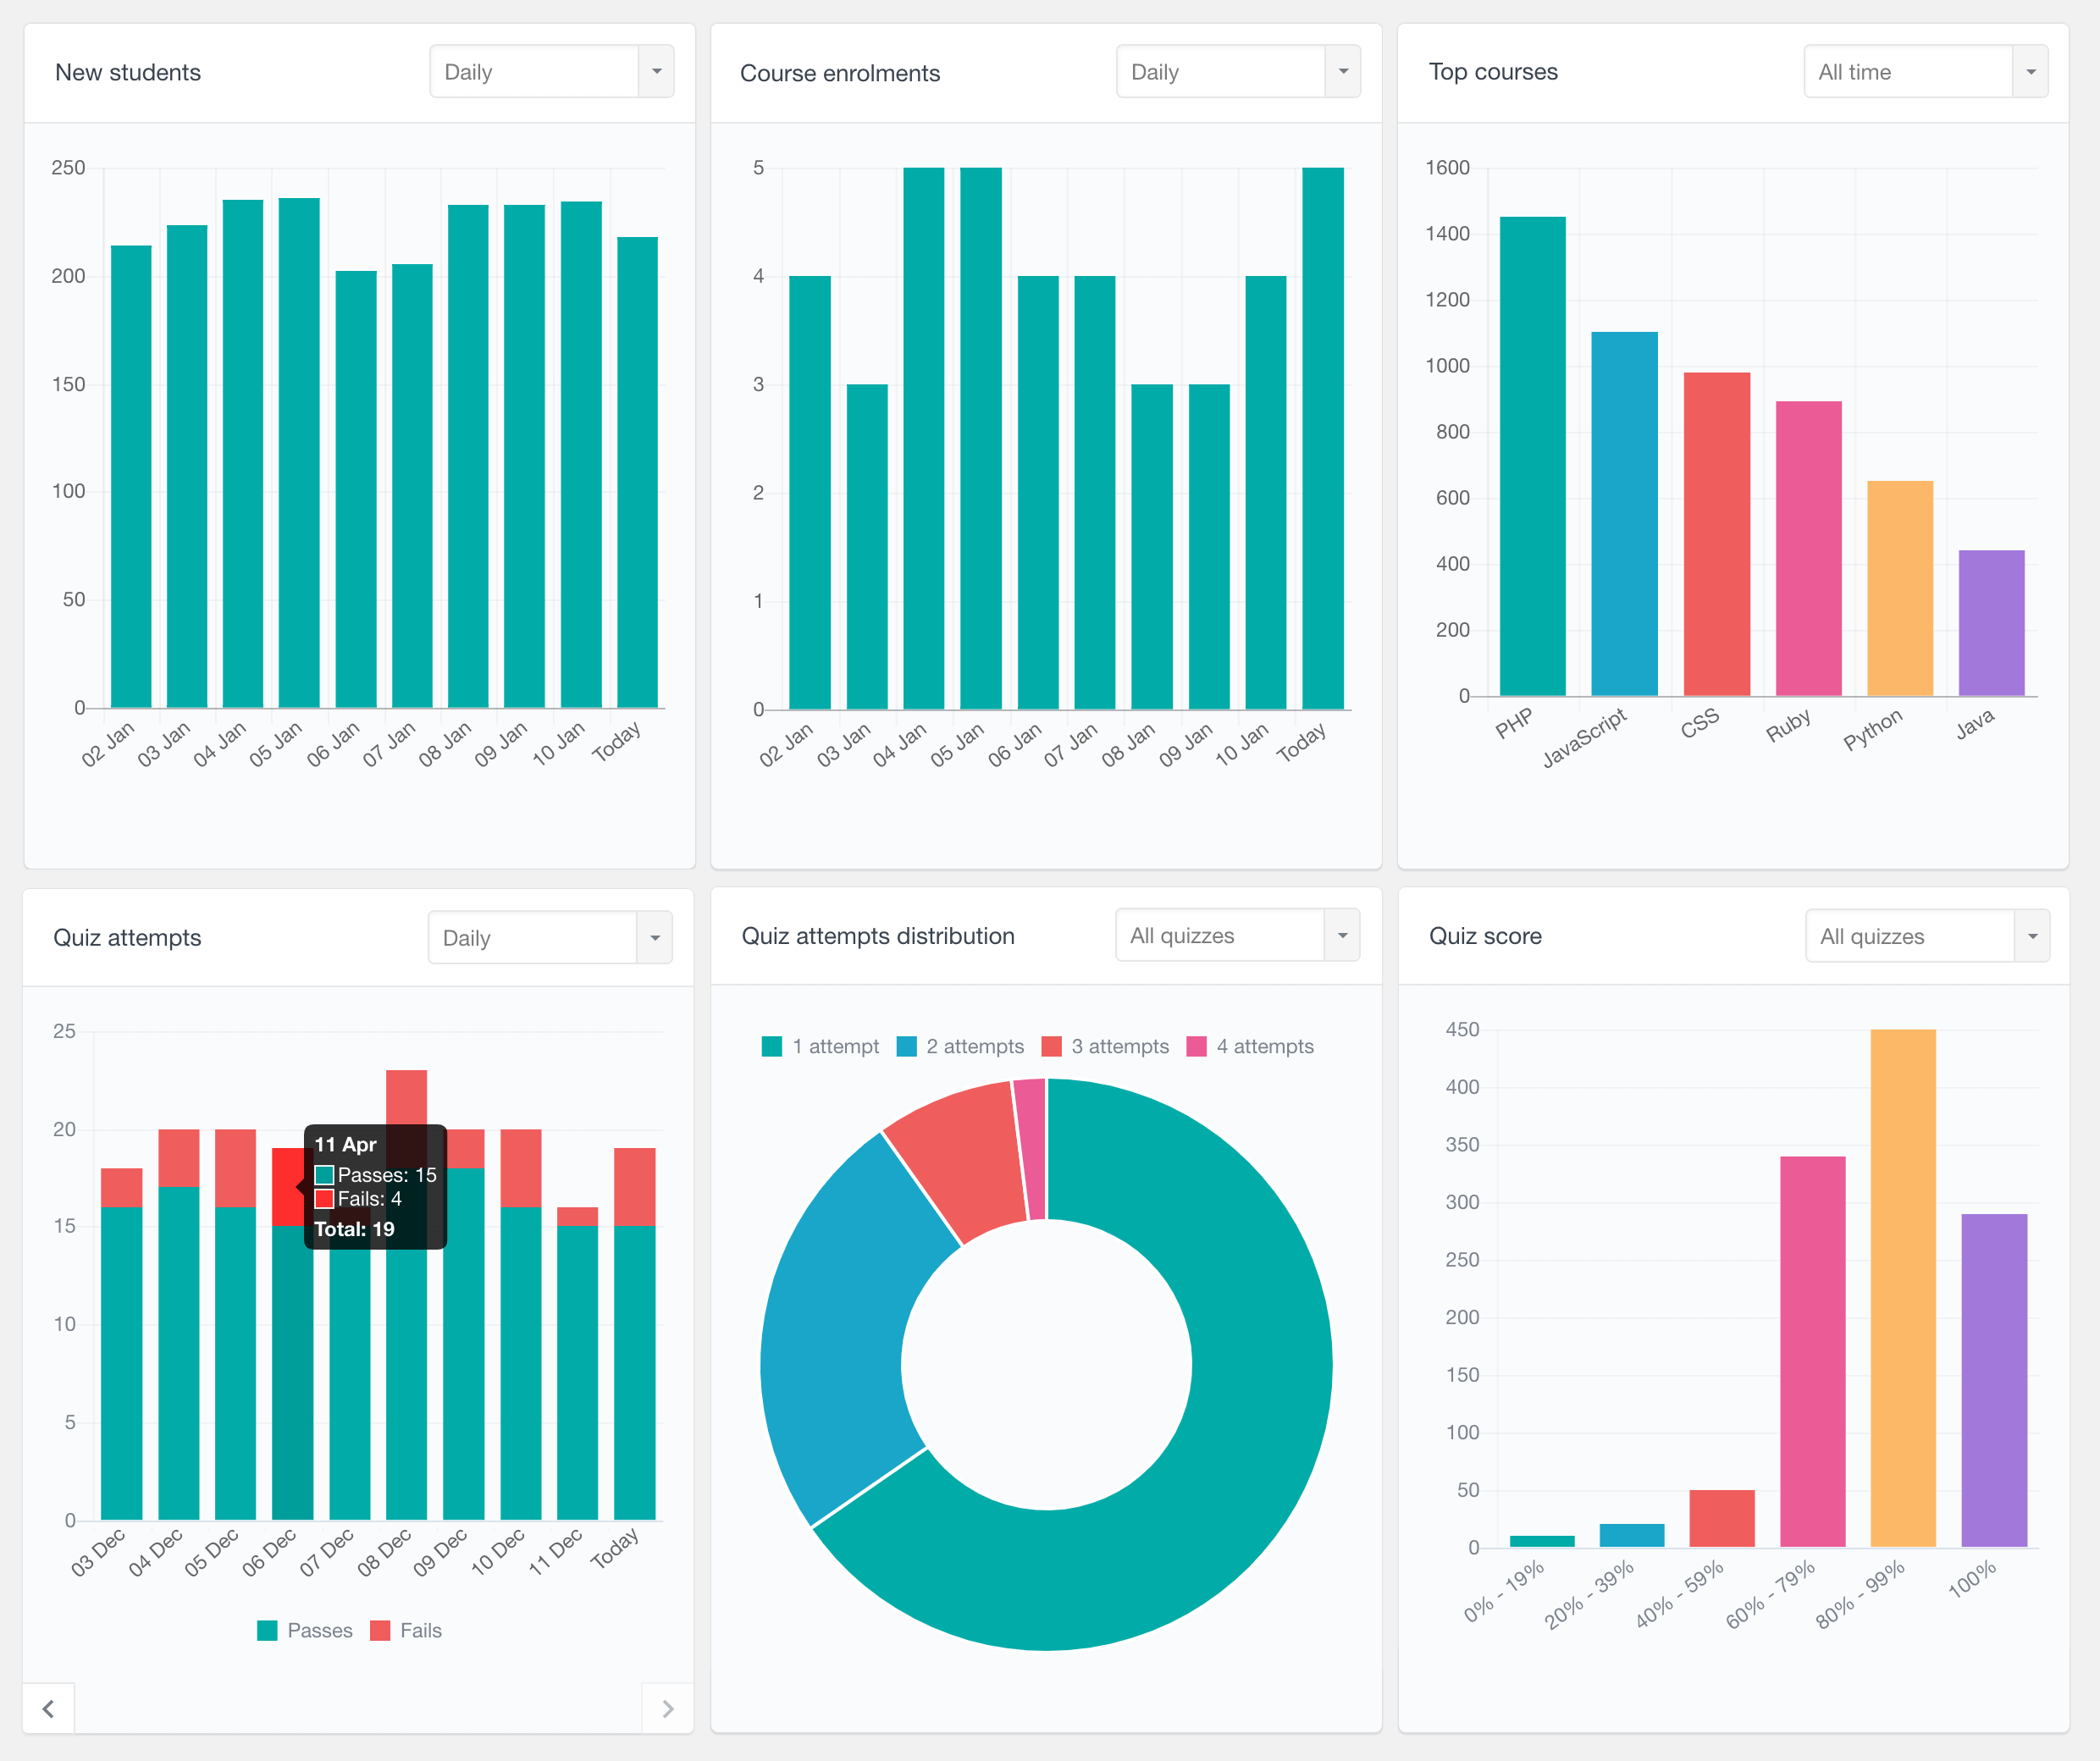
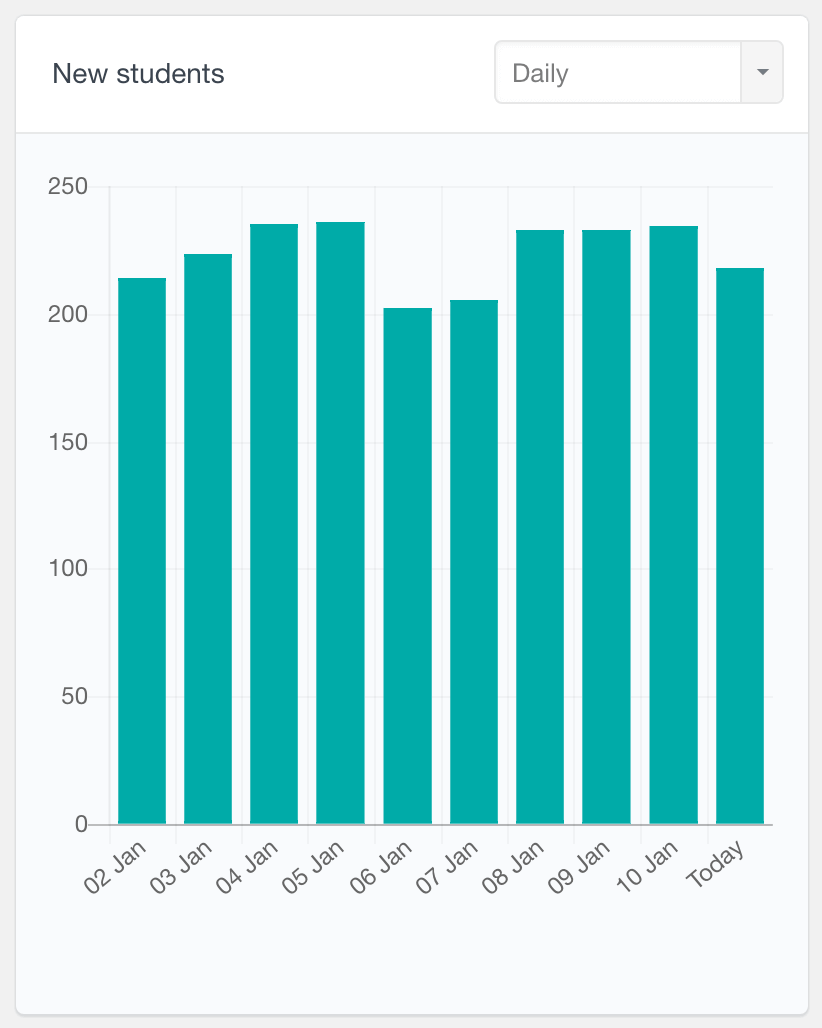
This report shows the number of new students over time. A student is counted as “new” when they enrol to their first course. The report helps you track your student growth trends. You can view the data for different time periods – daily, weekly, monthly and yearly.
Tutor LMS Course enrollments report
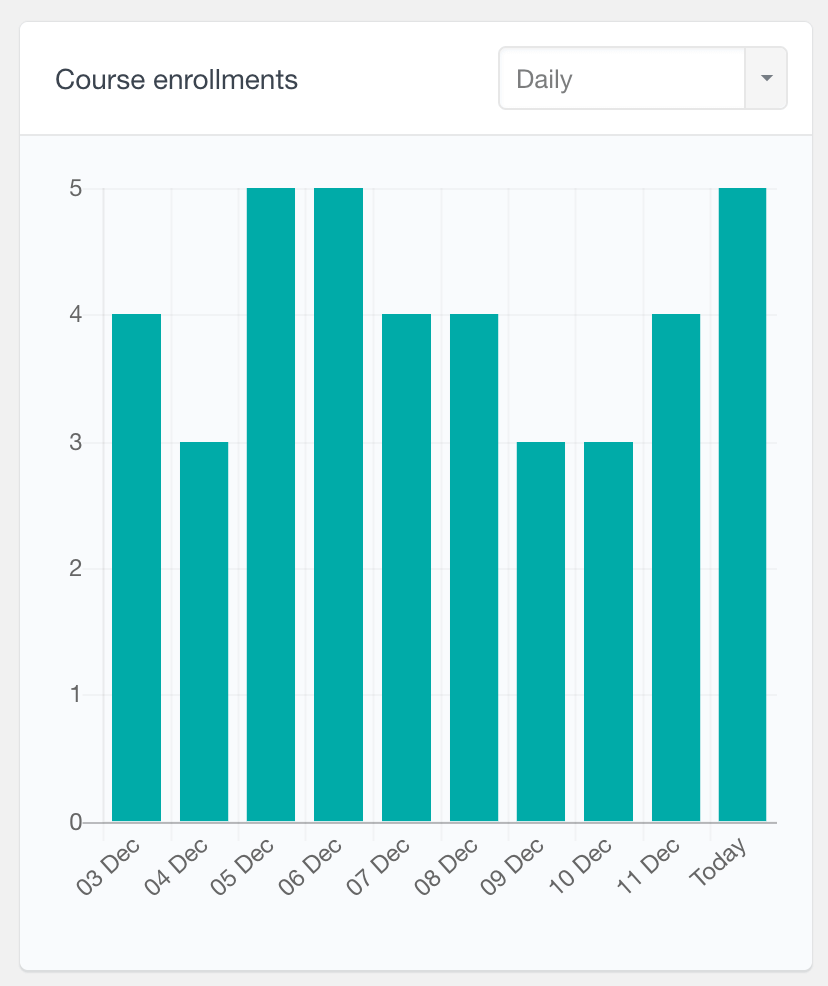
The course enrollments report shows the total number of course enrolments over time. Unlike the new students report which only counts first enrolments, this report includes all course enrolments, even when existing students enrol in additional courses. This gives you a complete picture of course registration activity on your platform.
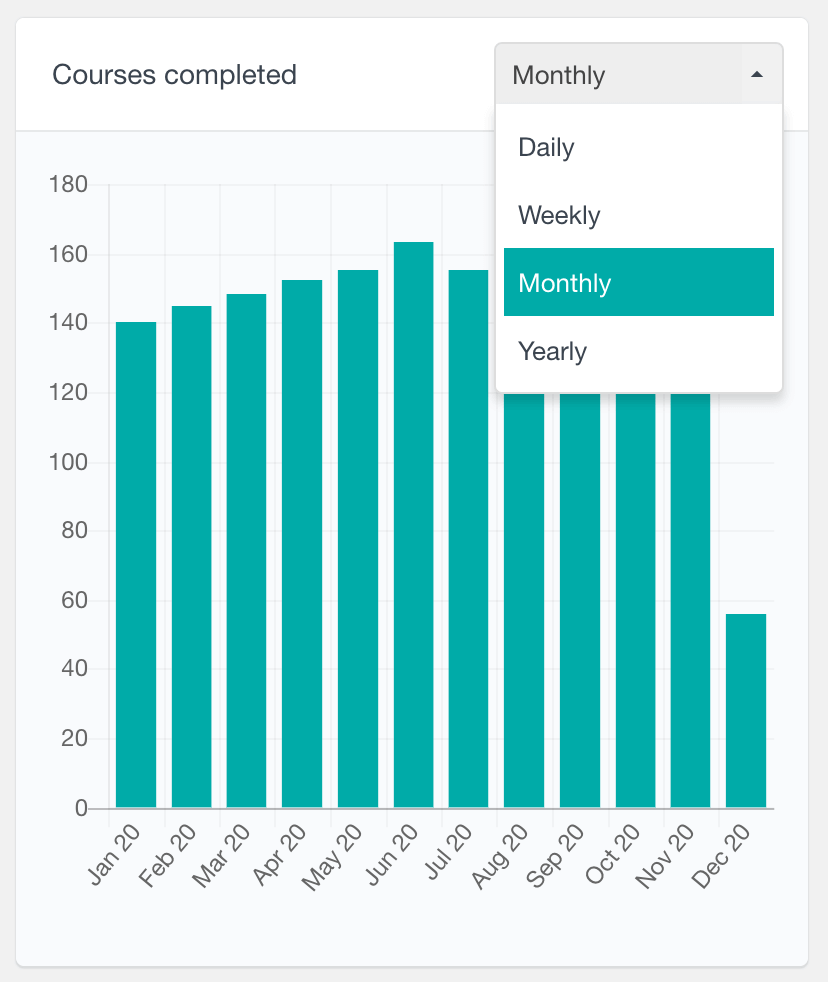
Tutor LMS Courses completed report
This report shows the number of courses completed over time. It helps you see how many students are finishing their courses and overall engagement levels. A good completion rate means students find your courses valuable and are motivated to complete them.
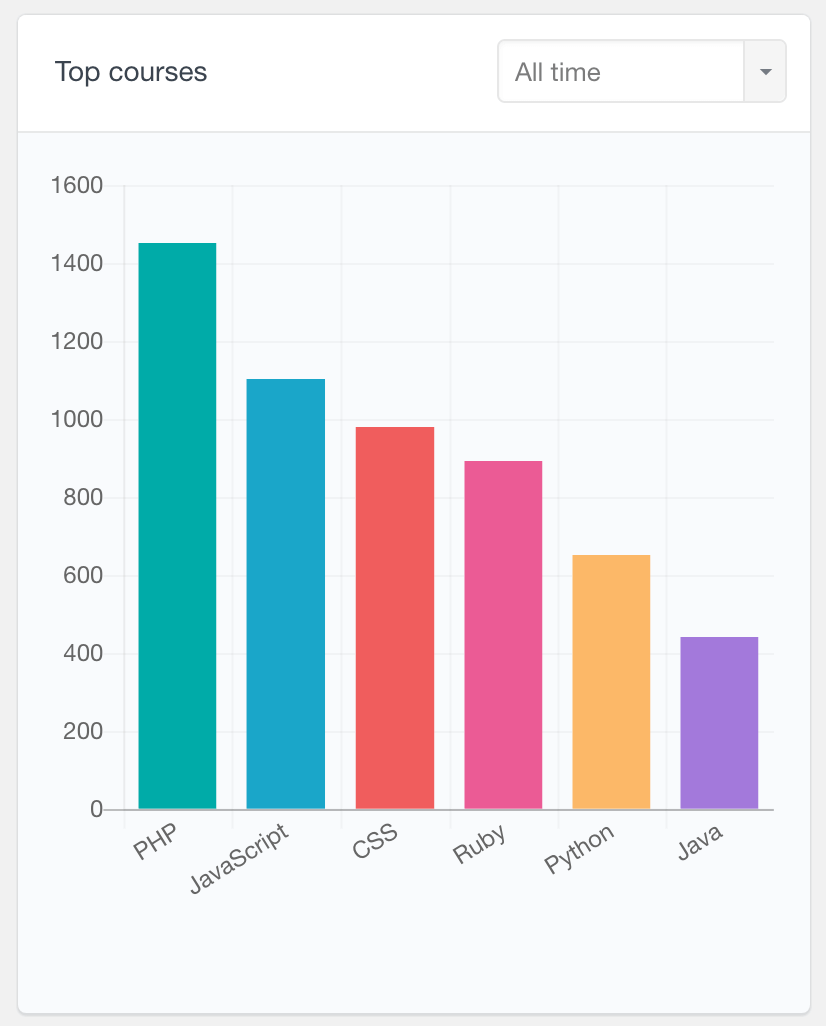
Tutor LMS Top courses report
The top courses report shows a bar chart of your most popular courses by student enrollment. This report has a date filter so you can analyze course popularity for a specific time period or view all-time data. You can use this report to see which courses are getting the most students and which may need more promotion or improvement.
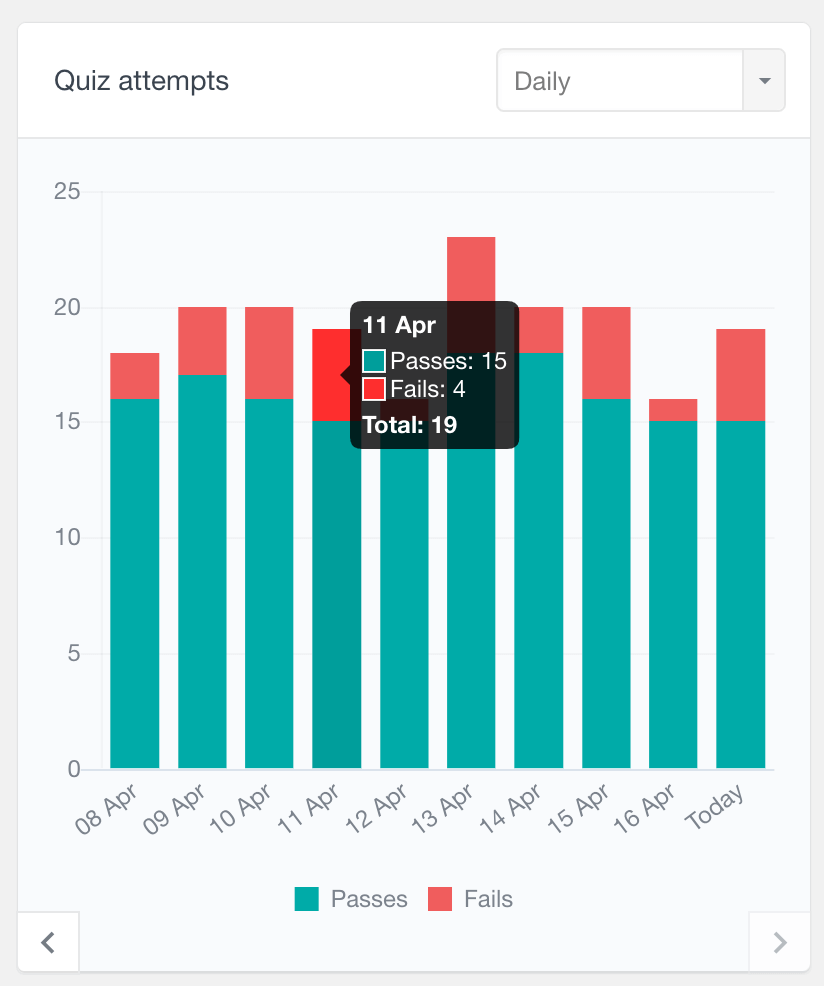
Tutor LMS Quiz attempts report
This Quiz attempts report is a stacked period report that lets you easily see the student quiz activity over time. This report includes a color-coded breakdown making it easy to view the passes vs fails. From that, you can quickly get a sense of what’s going on with quiz activity and where students might be falling short. And, you can easily switch between different time periods to get a better feel for how student behaviour changes.
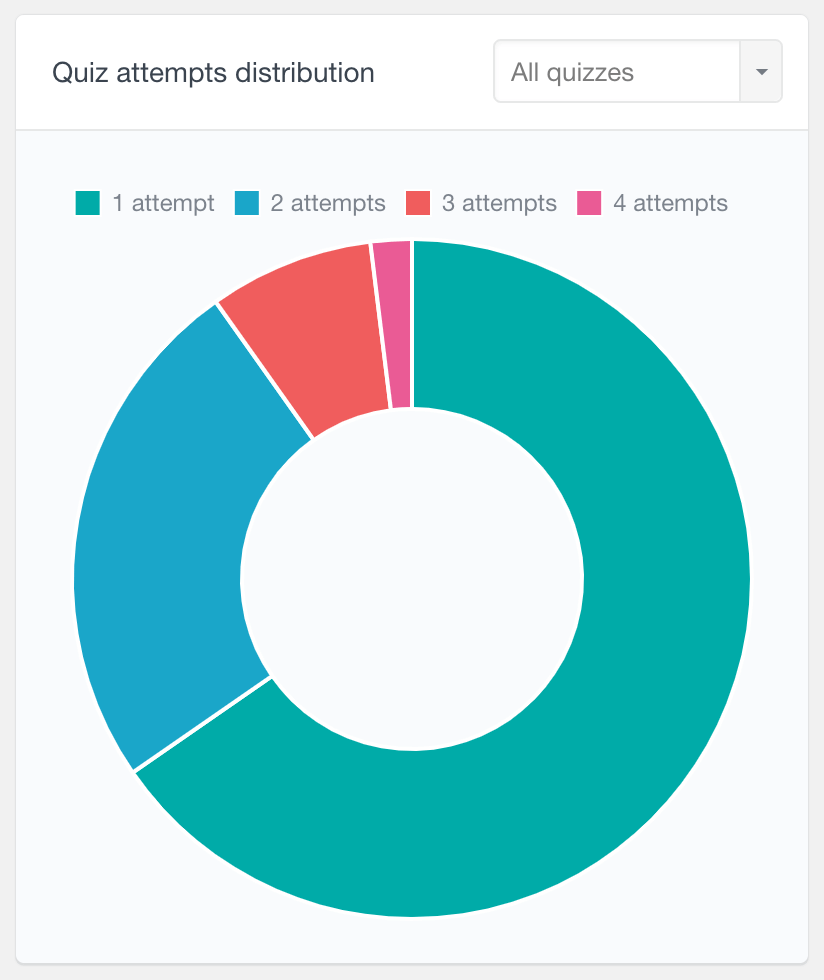
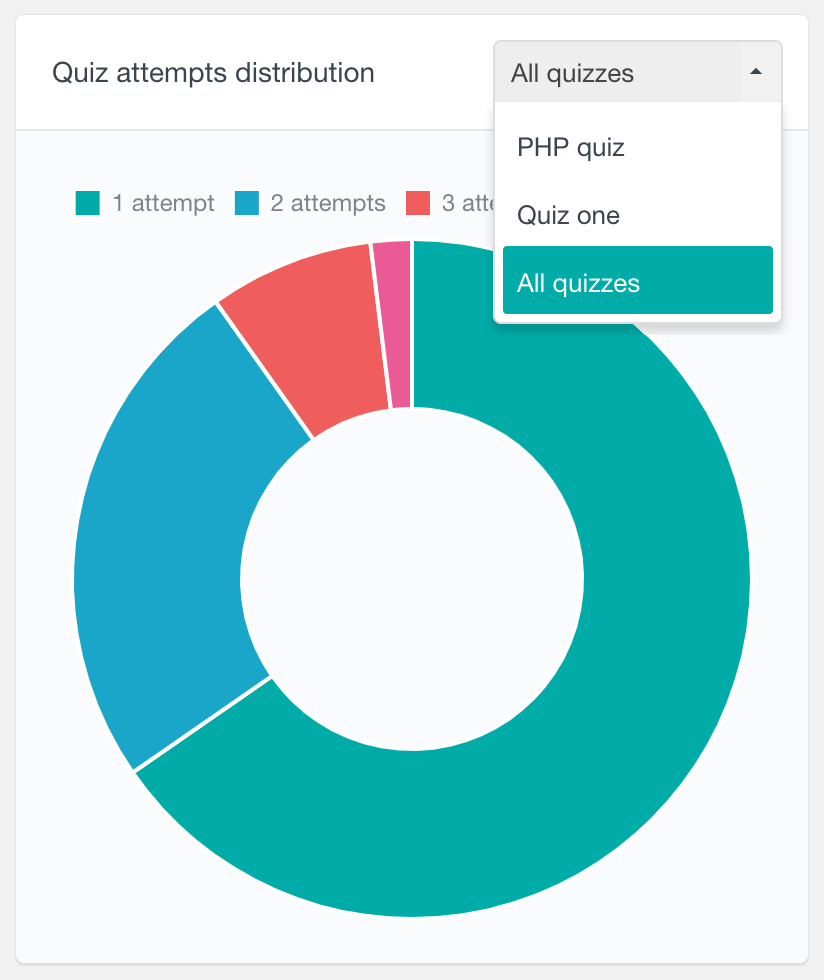
Tutor LMS Quiz attempts distribution report
The Quiz Attempts Distribution report shows how many times students attempt each quiz. This can be helpful in getting a sense of what’s going on with quiz difficulty. You can use filters to explore all quizzes or just one particular one – and that gives you some insight into whether a quiz is maybe too easy or too hard. If most students are passing first time round, it might be just right. But if they’re all having multiple goes, then it’s probably a bit more of a challenge.
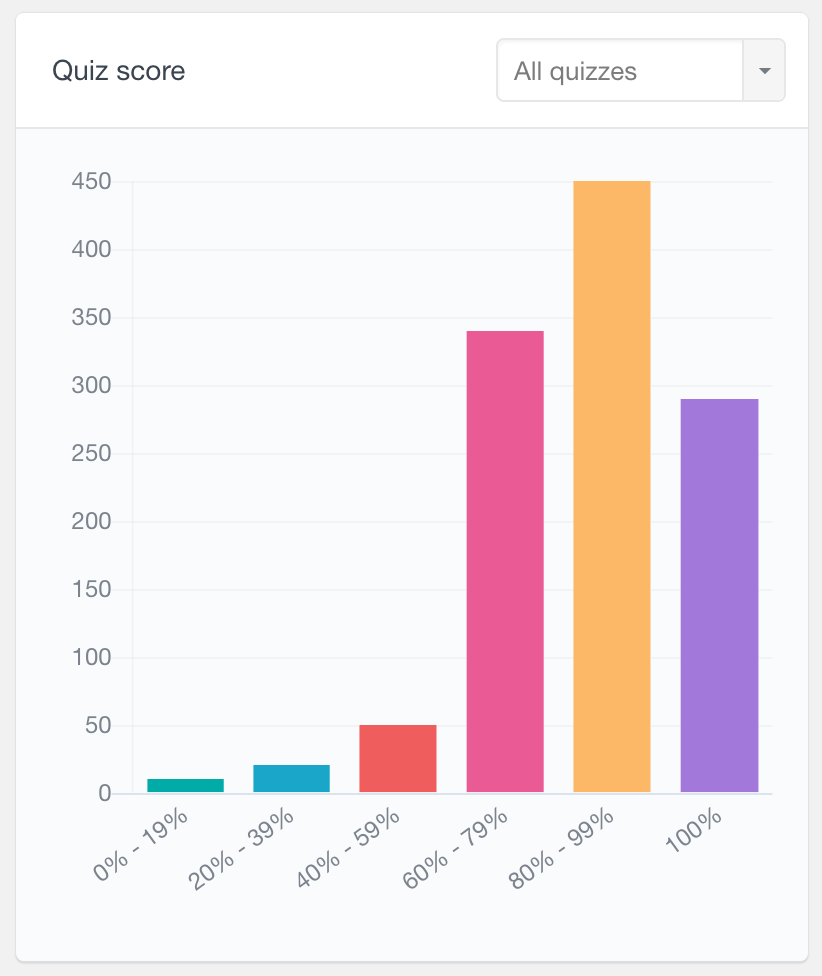
Tutor LMS Quiz score report
This report shows how quiz scores are spread out across different score buckets, which should give you a an overview of how well students are performing in quizzes in general. You can explore the overall scores or select a specific quiz, which can help you work out if there’s a particular area where students are struggling.
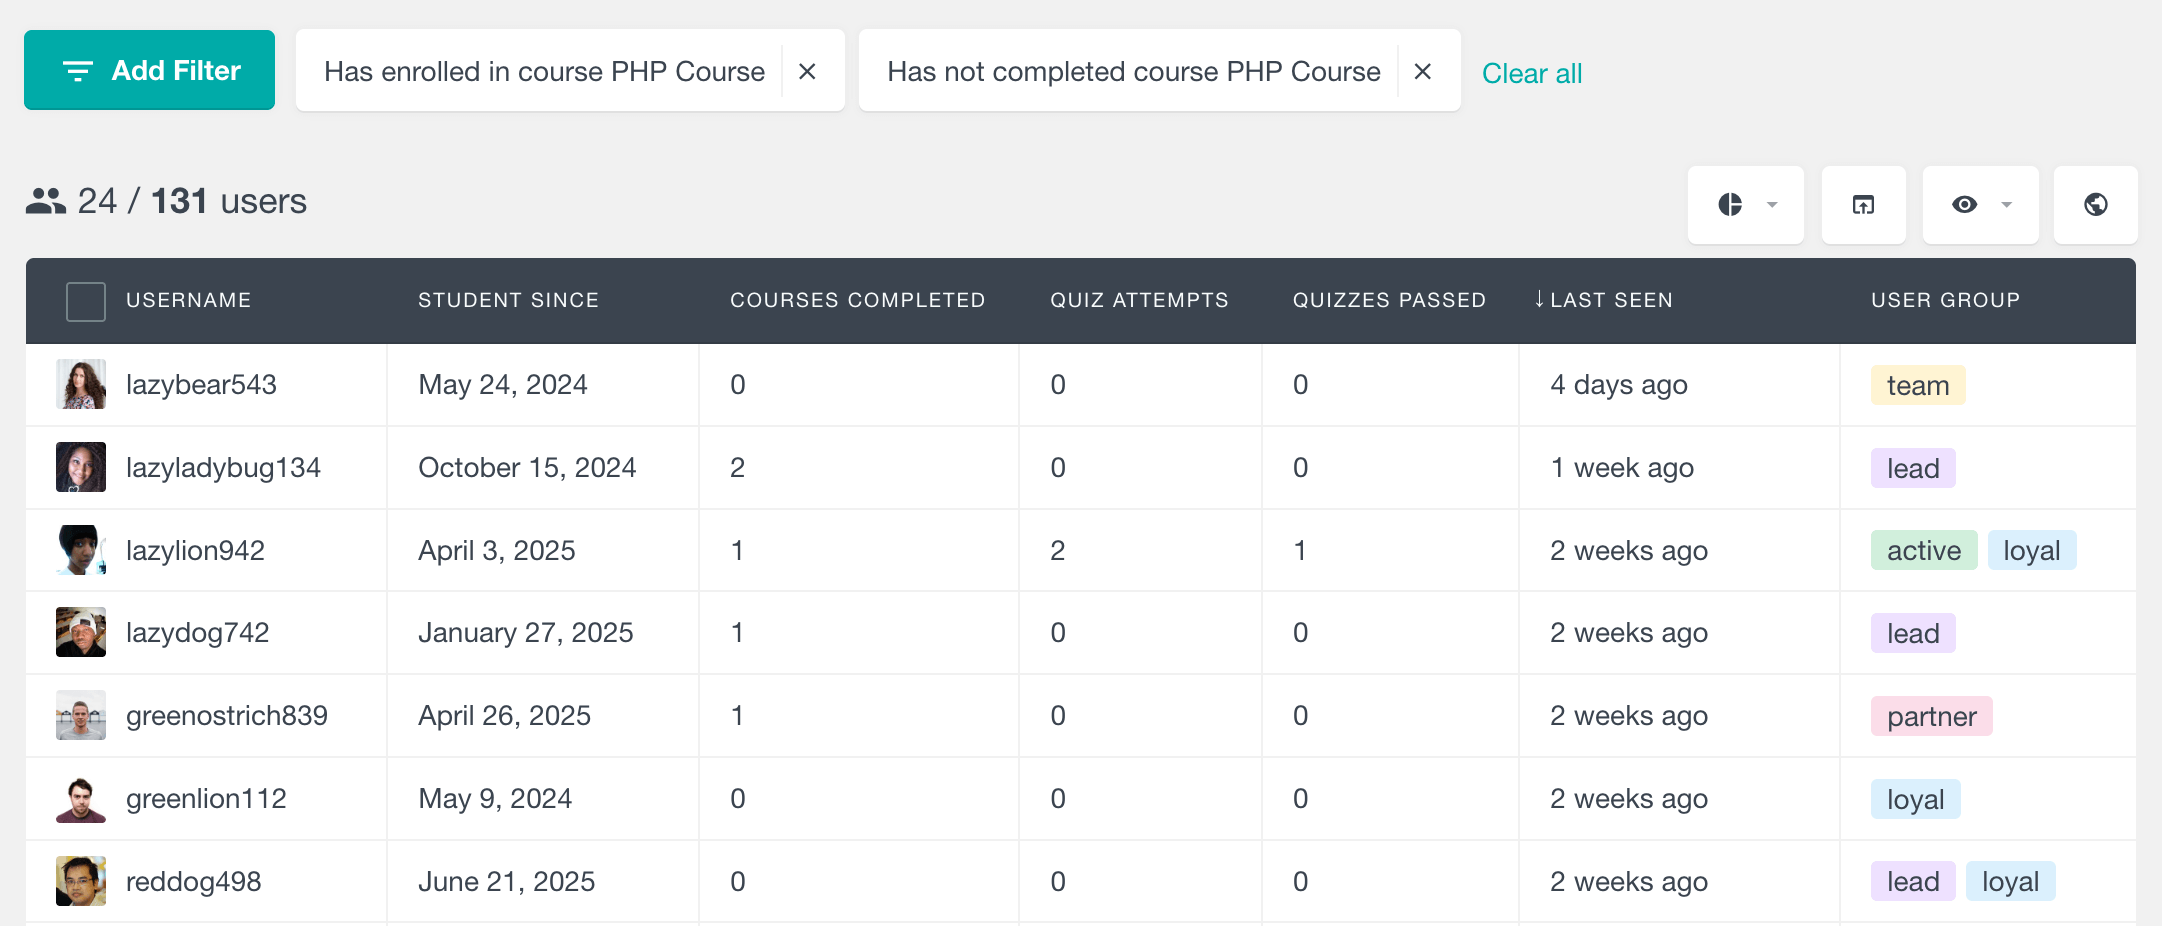
Advanced Tutor LMS filters
Beyond the built-in Tutor LMS reports, Users Insights gives you flexible tools to explore and segment your student data. You can filter learners by their course participation and quiz results, and you can access an individual profile view that brings together all of their Tutor LMS activity in one place.
If you’d like a deeper look at the student-focused functionality, the Tutor LMS feature page provides a full breakdown.