New WooCommerce and LearnDash reports in Users Insights 4.6
Users Insights 4.6 is now available, featuring new WooCommerce and LearnDash reports. For WooCommerce, we’ve added detailed reports including new vs returning customers, a breakdown of order statuses over time, abandoned cart analytics, and a new product category reports section. In LearnDash, we now offer distinct sections for Course and Quiz reports, providing insights into activities based on the selected course or quiz.
New WooCommerce features
Filtering customers by product category purchased
The user table now provides an option to filter users by the product category that they have purchased, as part of the “Placed an order” filter. To use the filter, just select the “Placed an order” filter, then select the “product category” option and choose one of the available categories. Once you apply the filter, you will see all users who have purchased a product from the selected category and its subcategories.
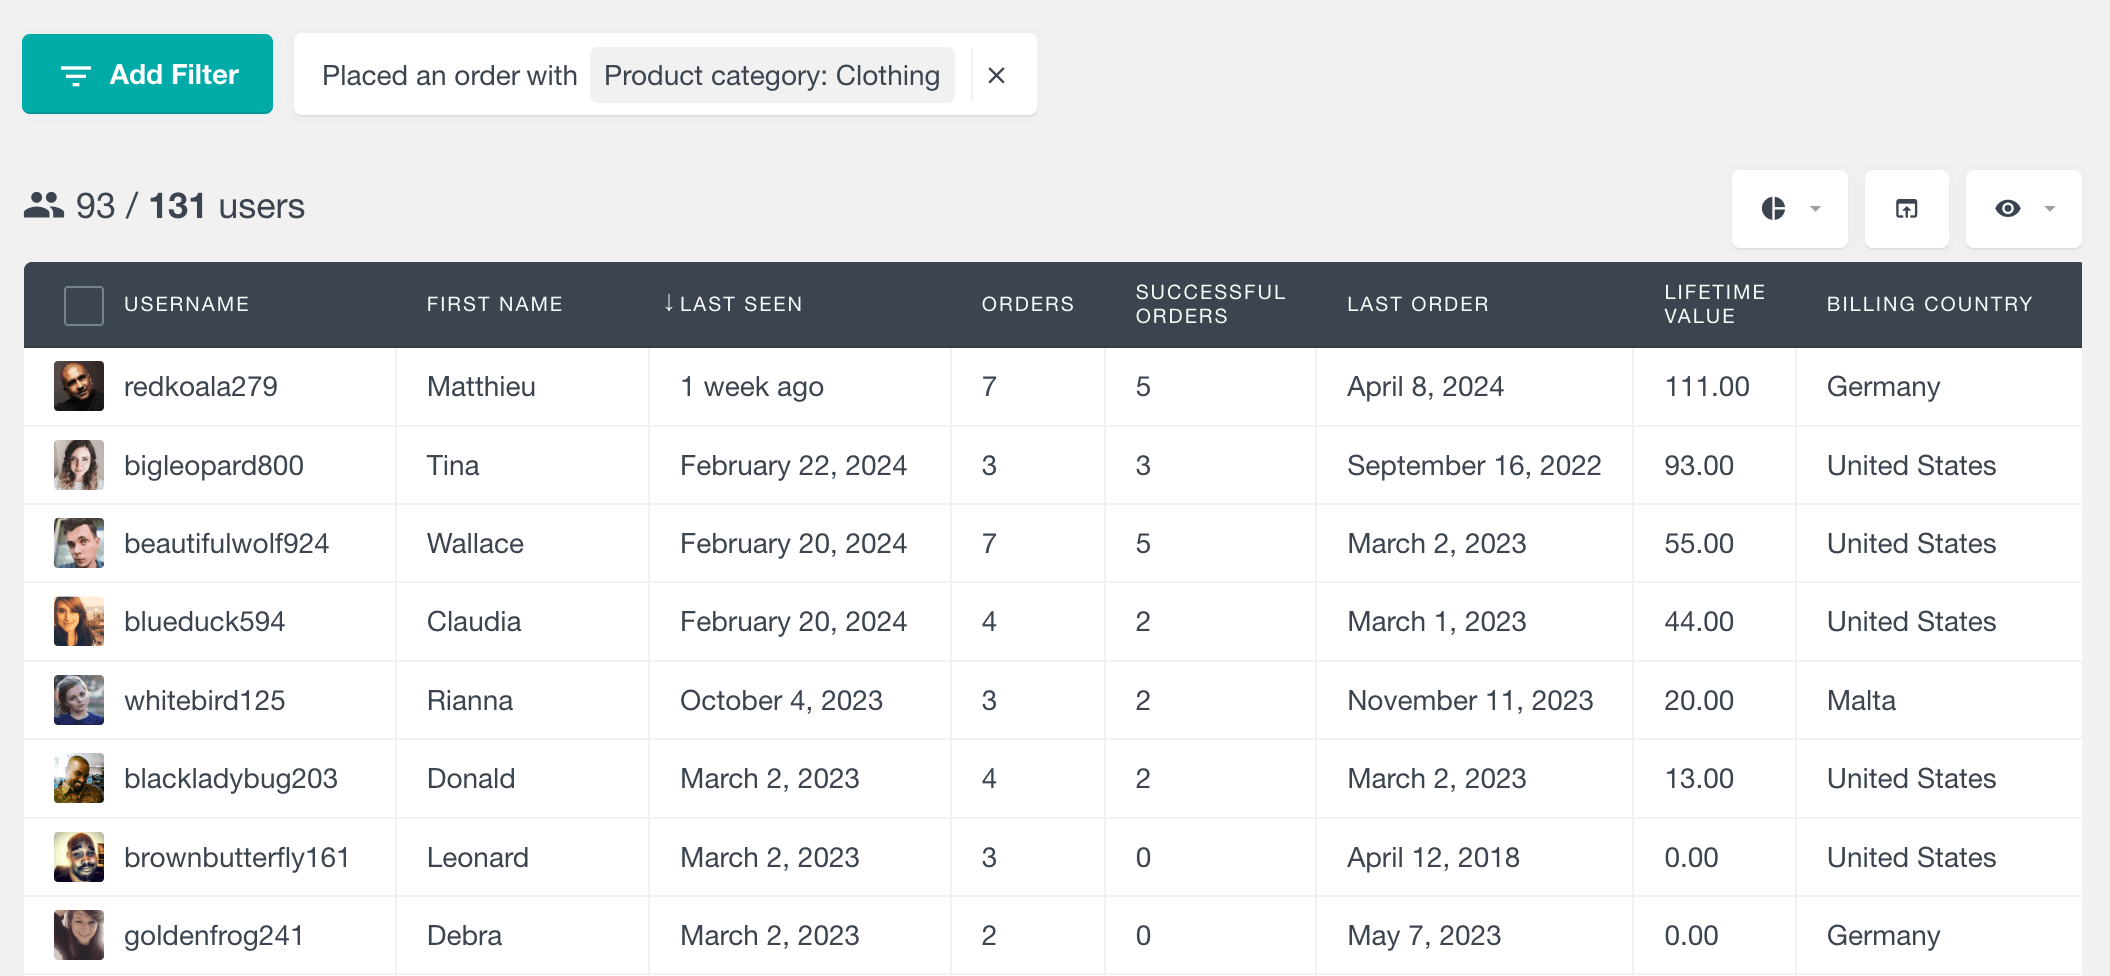
You can additionally use all other filter options, so for example, you can easily find the customers who have purchased a product from the selected category in a given period and their order status is completed:

New vs returning customers
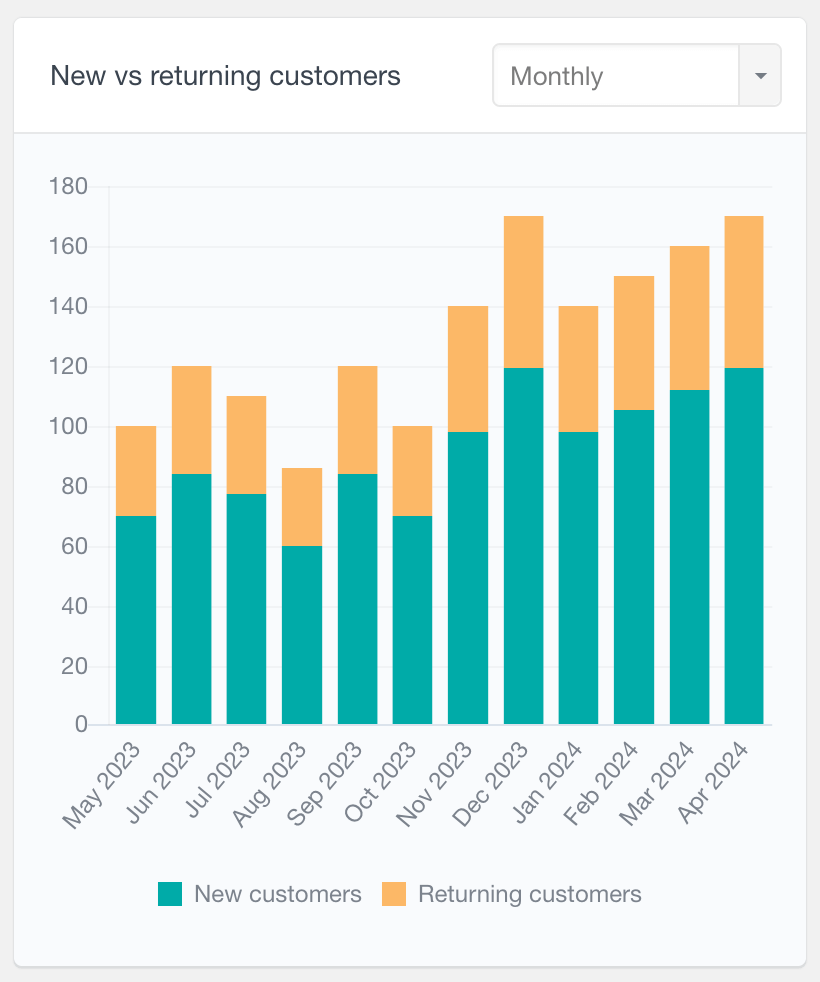
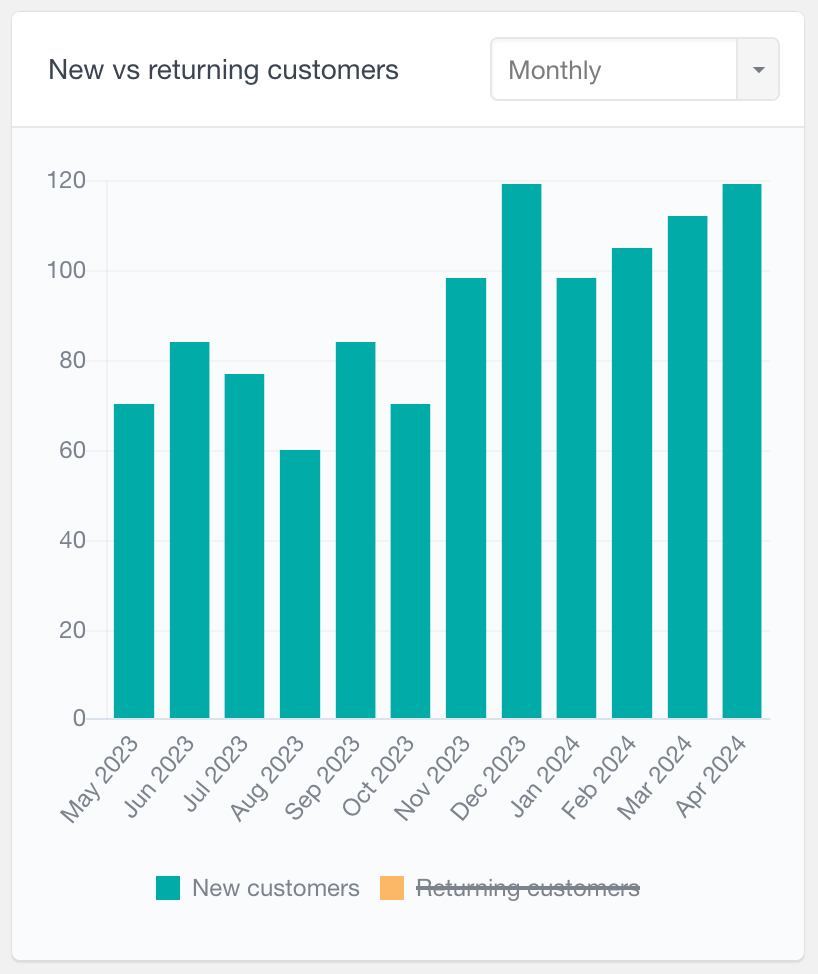
The “New vs returning” customers shows the total number of customers over time, with color-coded segments identifying how many are new and how many are returning customers. This report replaces the “New customers” report, however if you still would like to see new customers only, just click on the “Returning customers” label to disable it.
Orders by status report
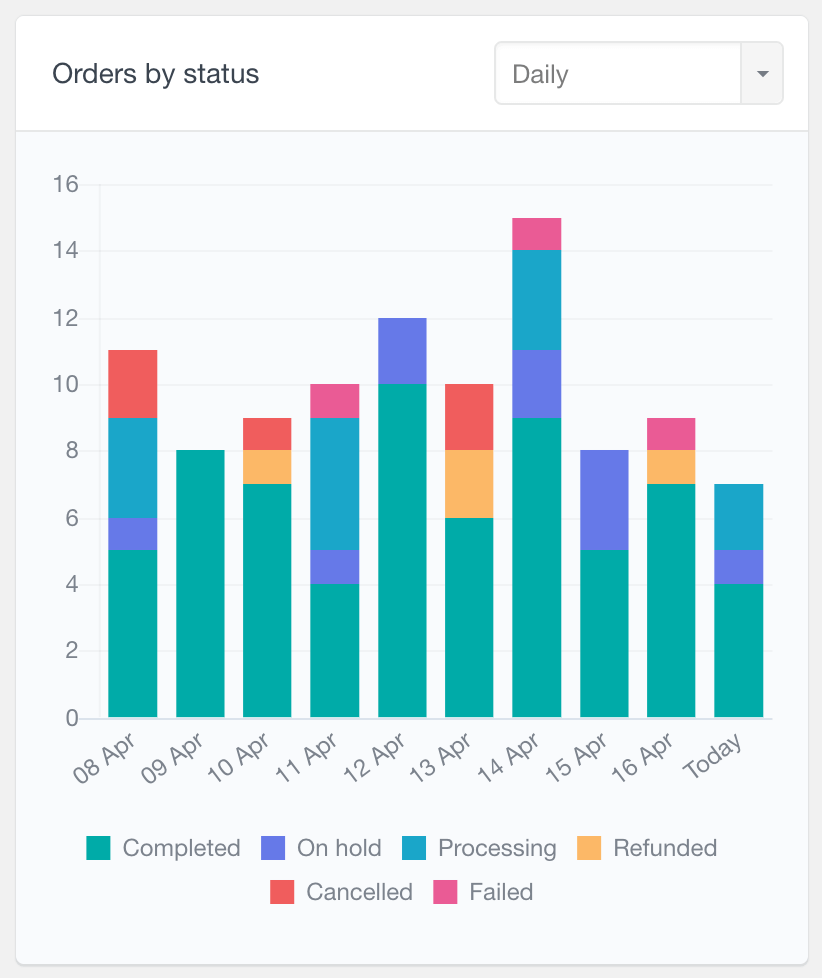
The “Orders by status” report shows the distribution of order statuses over time with color-coded segments. This report is available in the general WooCommerce reports section for all products, as well as in the per-product and per-category reports sections. The report can be viewed in daily, weekly, monthly, or yearly intervals, all of which can be scrolled through to access historical data.
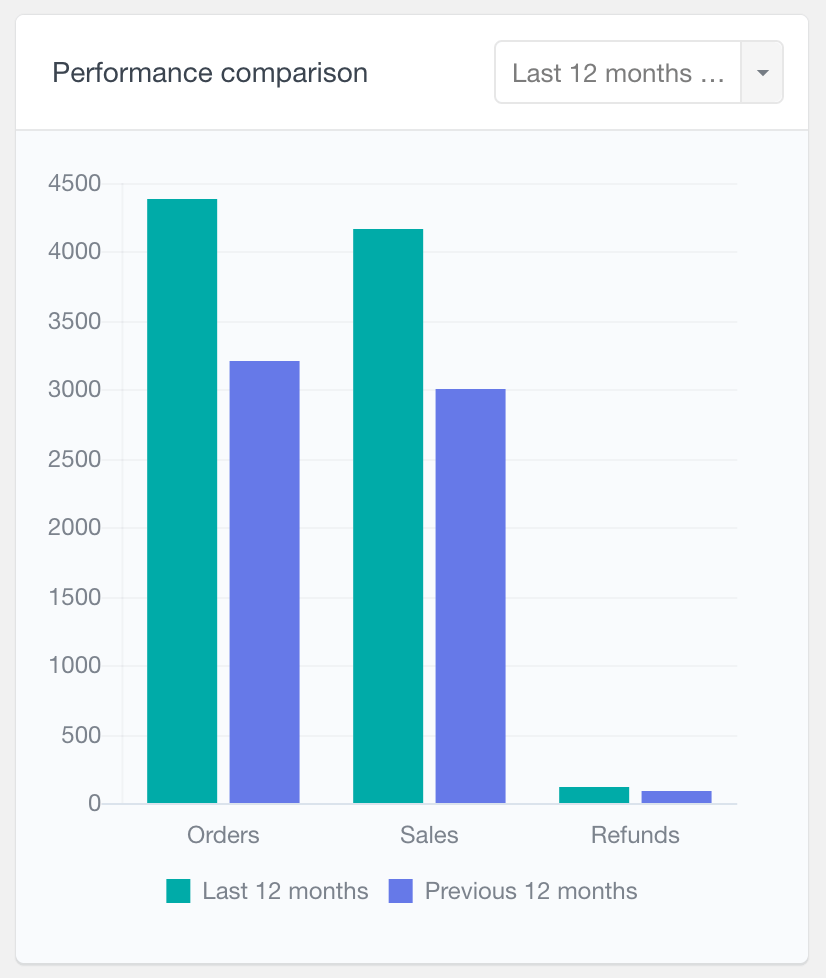
Perfomance Comparison report
The “Performance comparison” report compares the number of orders, sales, and refunds for a selected recent period (last 7 days, 30 days, etc.) against the corresponding previous period. This feature is available in both general WooCommerce reports and per-product reports.
Abandoned carts report
The “Abandoned Carts” report outlines the number of shopping carts abandoned by logged-in users across different time intervals. Abandoned carts are detected when the WooCommerce persistent cart feature is enabled. Available in daily, weekly, monthly and yearly periods.
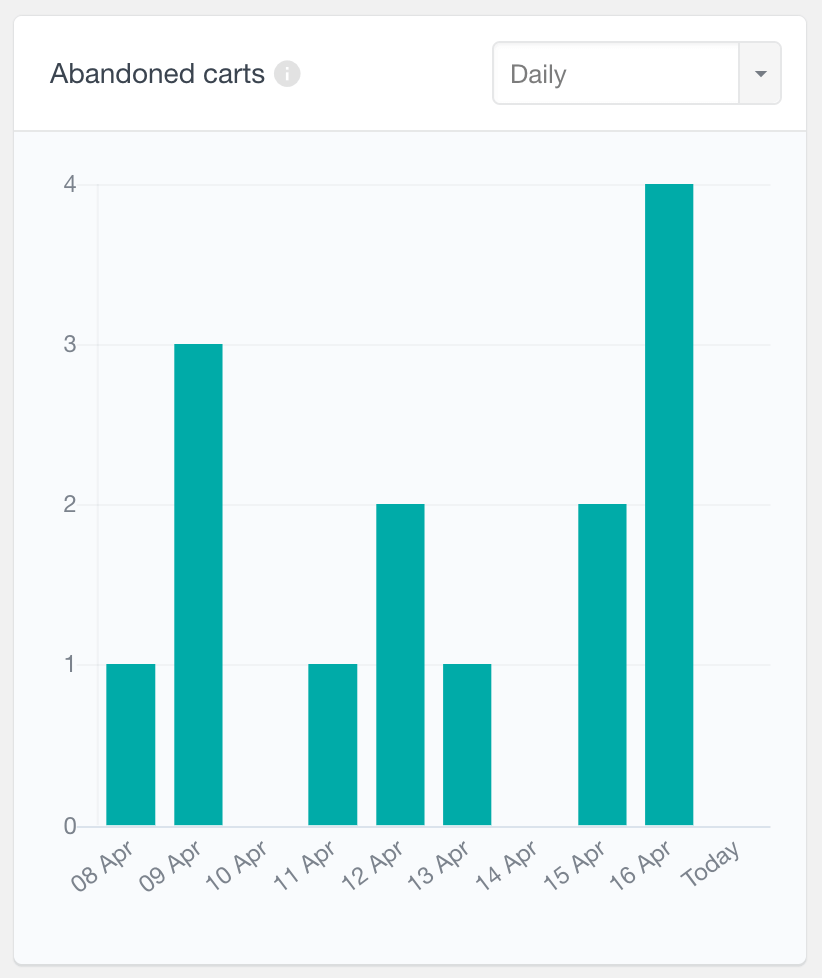
For more information, visit the WooCommerce reports page.
Product category reports
The new update also introduces a new WooCommerce Product Category reports section which provides various detailed reports for a selected category.
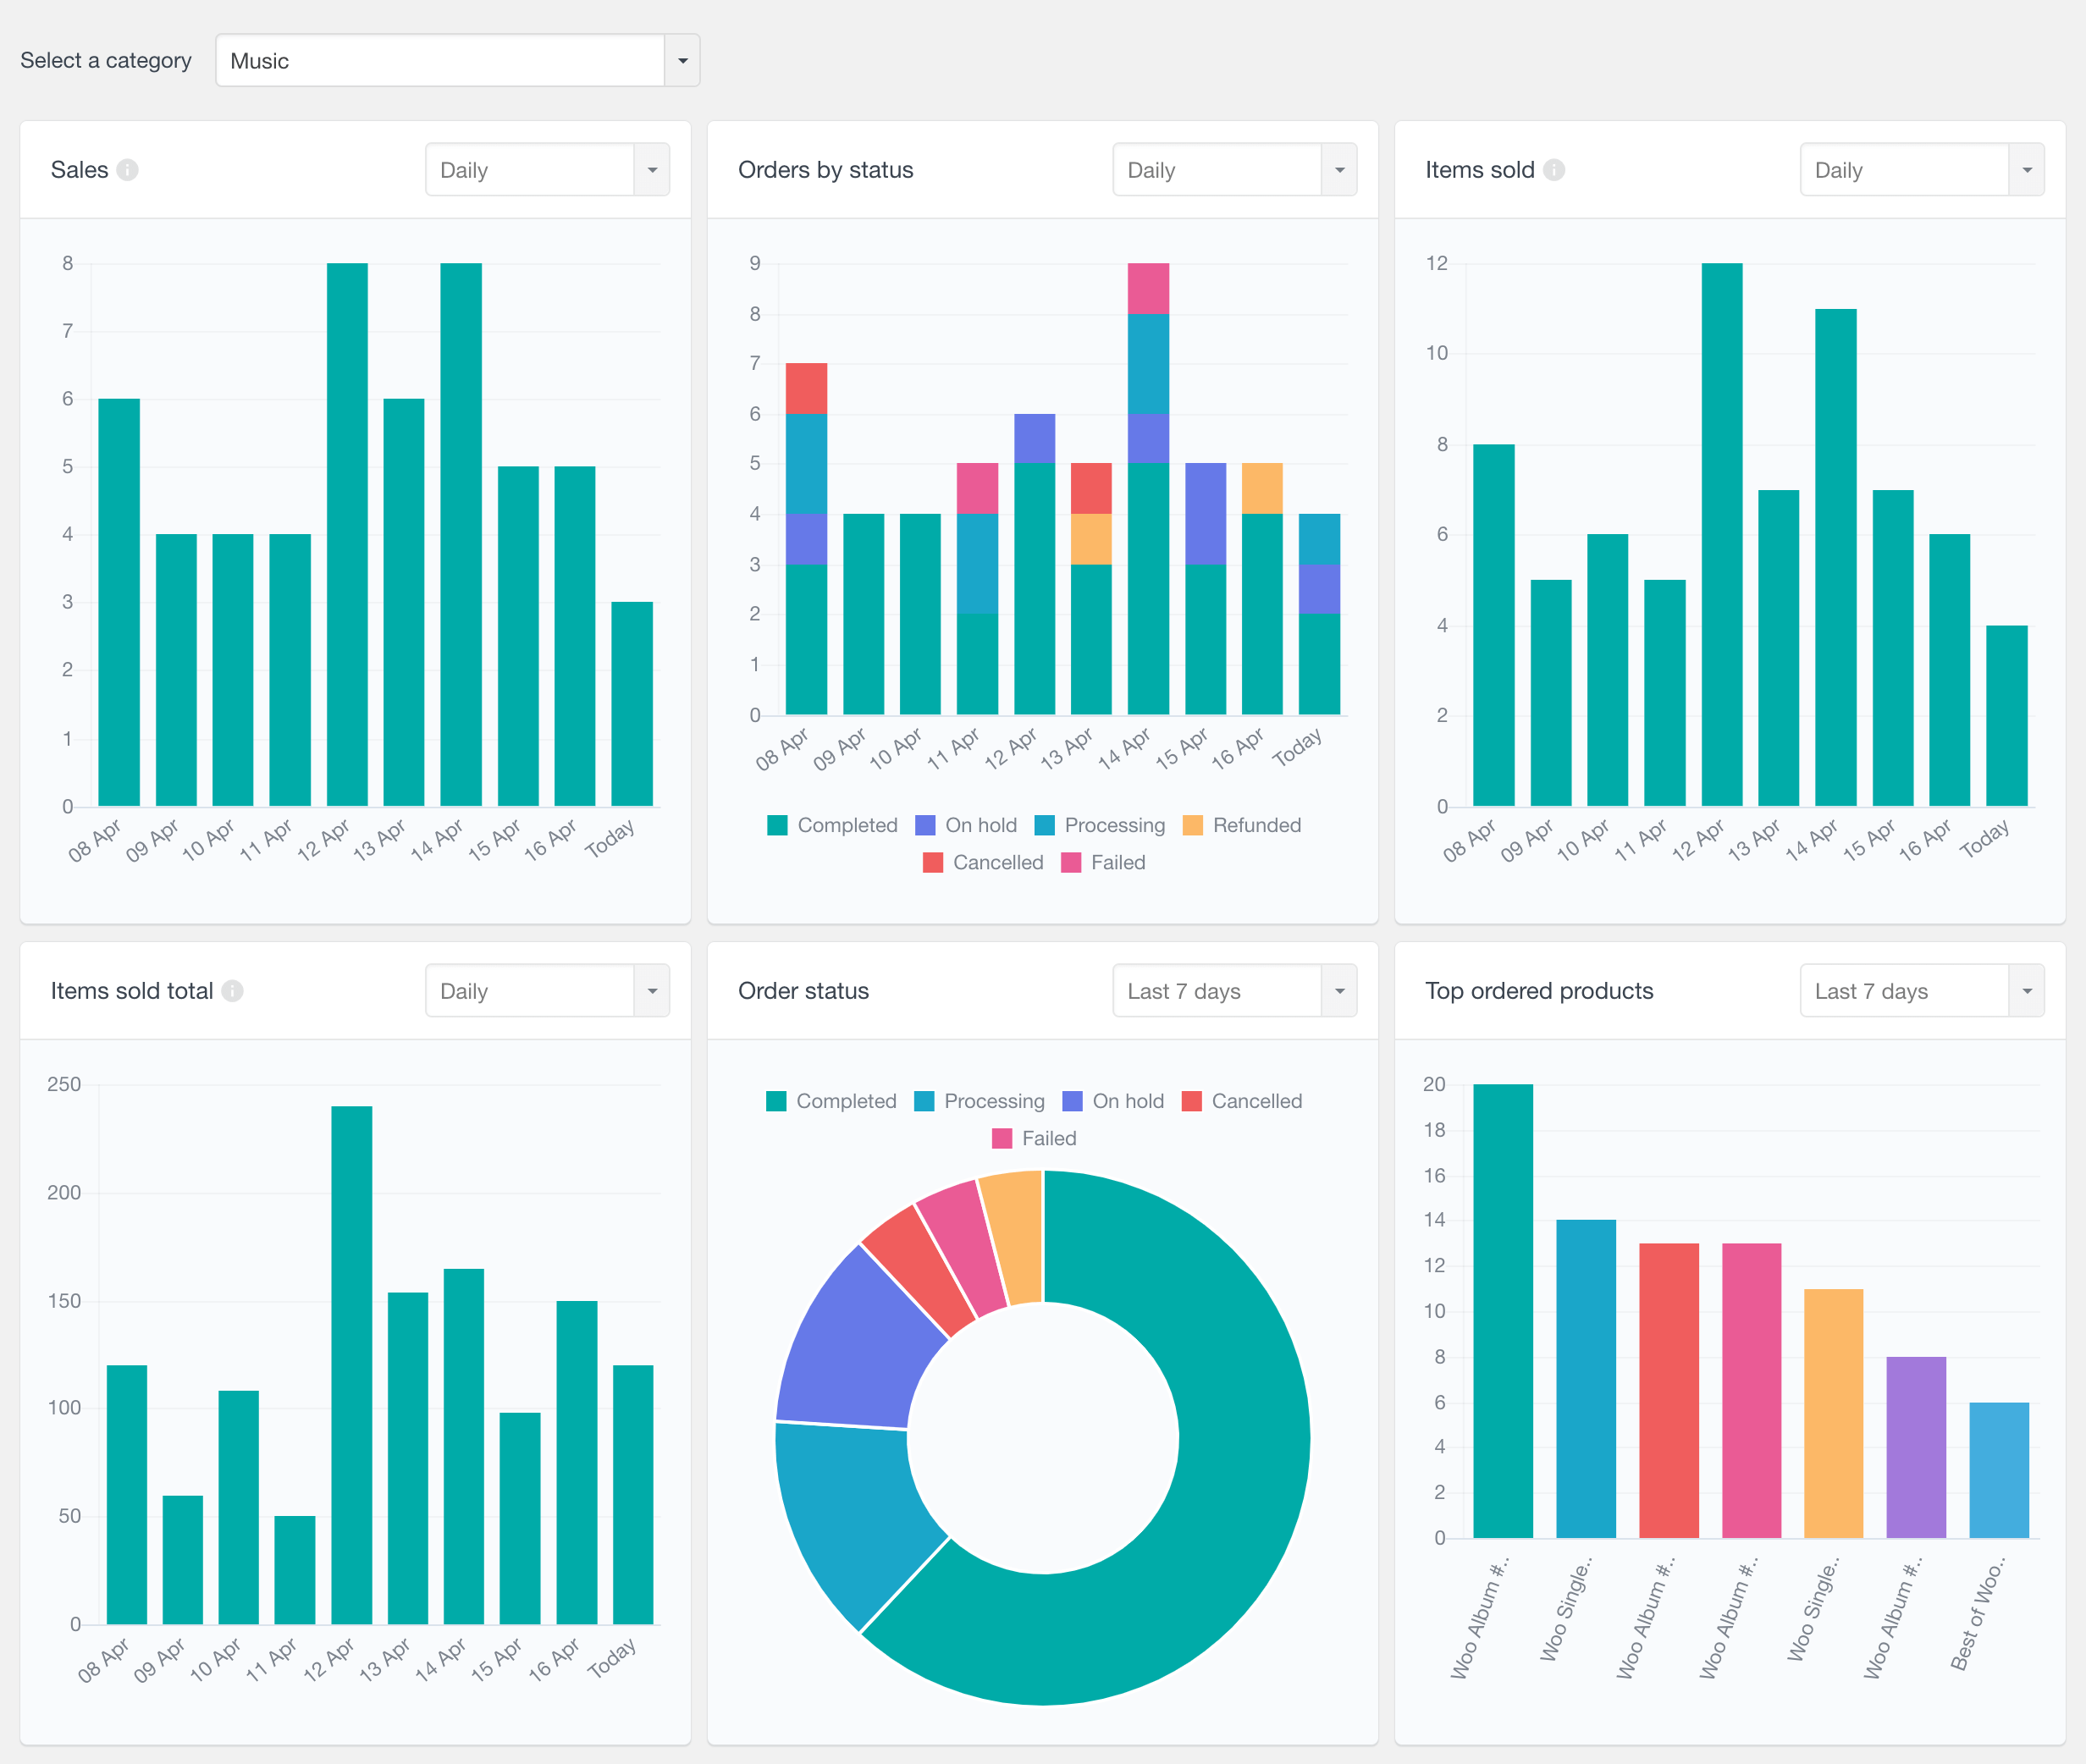
The following reports are available:
- Sales: Tracks the number of sales over time (orders with statuses marked as completed, processing, and on hold).
- Orders by Status: Visualizes orders over time with color-coded segments representing different statuses.
- Items Sold: total quantity of products from the category sold over time
- Total Amount of Items Sold: Calculates the total value of items sold from the selected category.
- Best Selling Products: Identifies top-selling products from the selected category with an option to filter results by specific periods.
- Order Status Breakdown: Displays a pie chart that breaks down order statuses for a chosen period.
When a parent category is selected, the reports will provide data for all products assigned to the selected category and its subcategories.
New LearnDash Reports
The Users Insights 4.6 update includes two new reports sections for LearnDash – Course reports and Quiz reports.
LearnDash Course reports
The new LearnDash Course Reports section is designed to provide detailed analytics for selected courses.
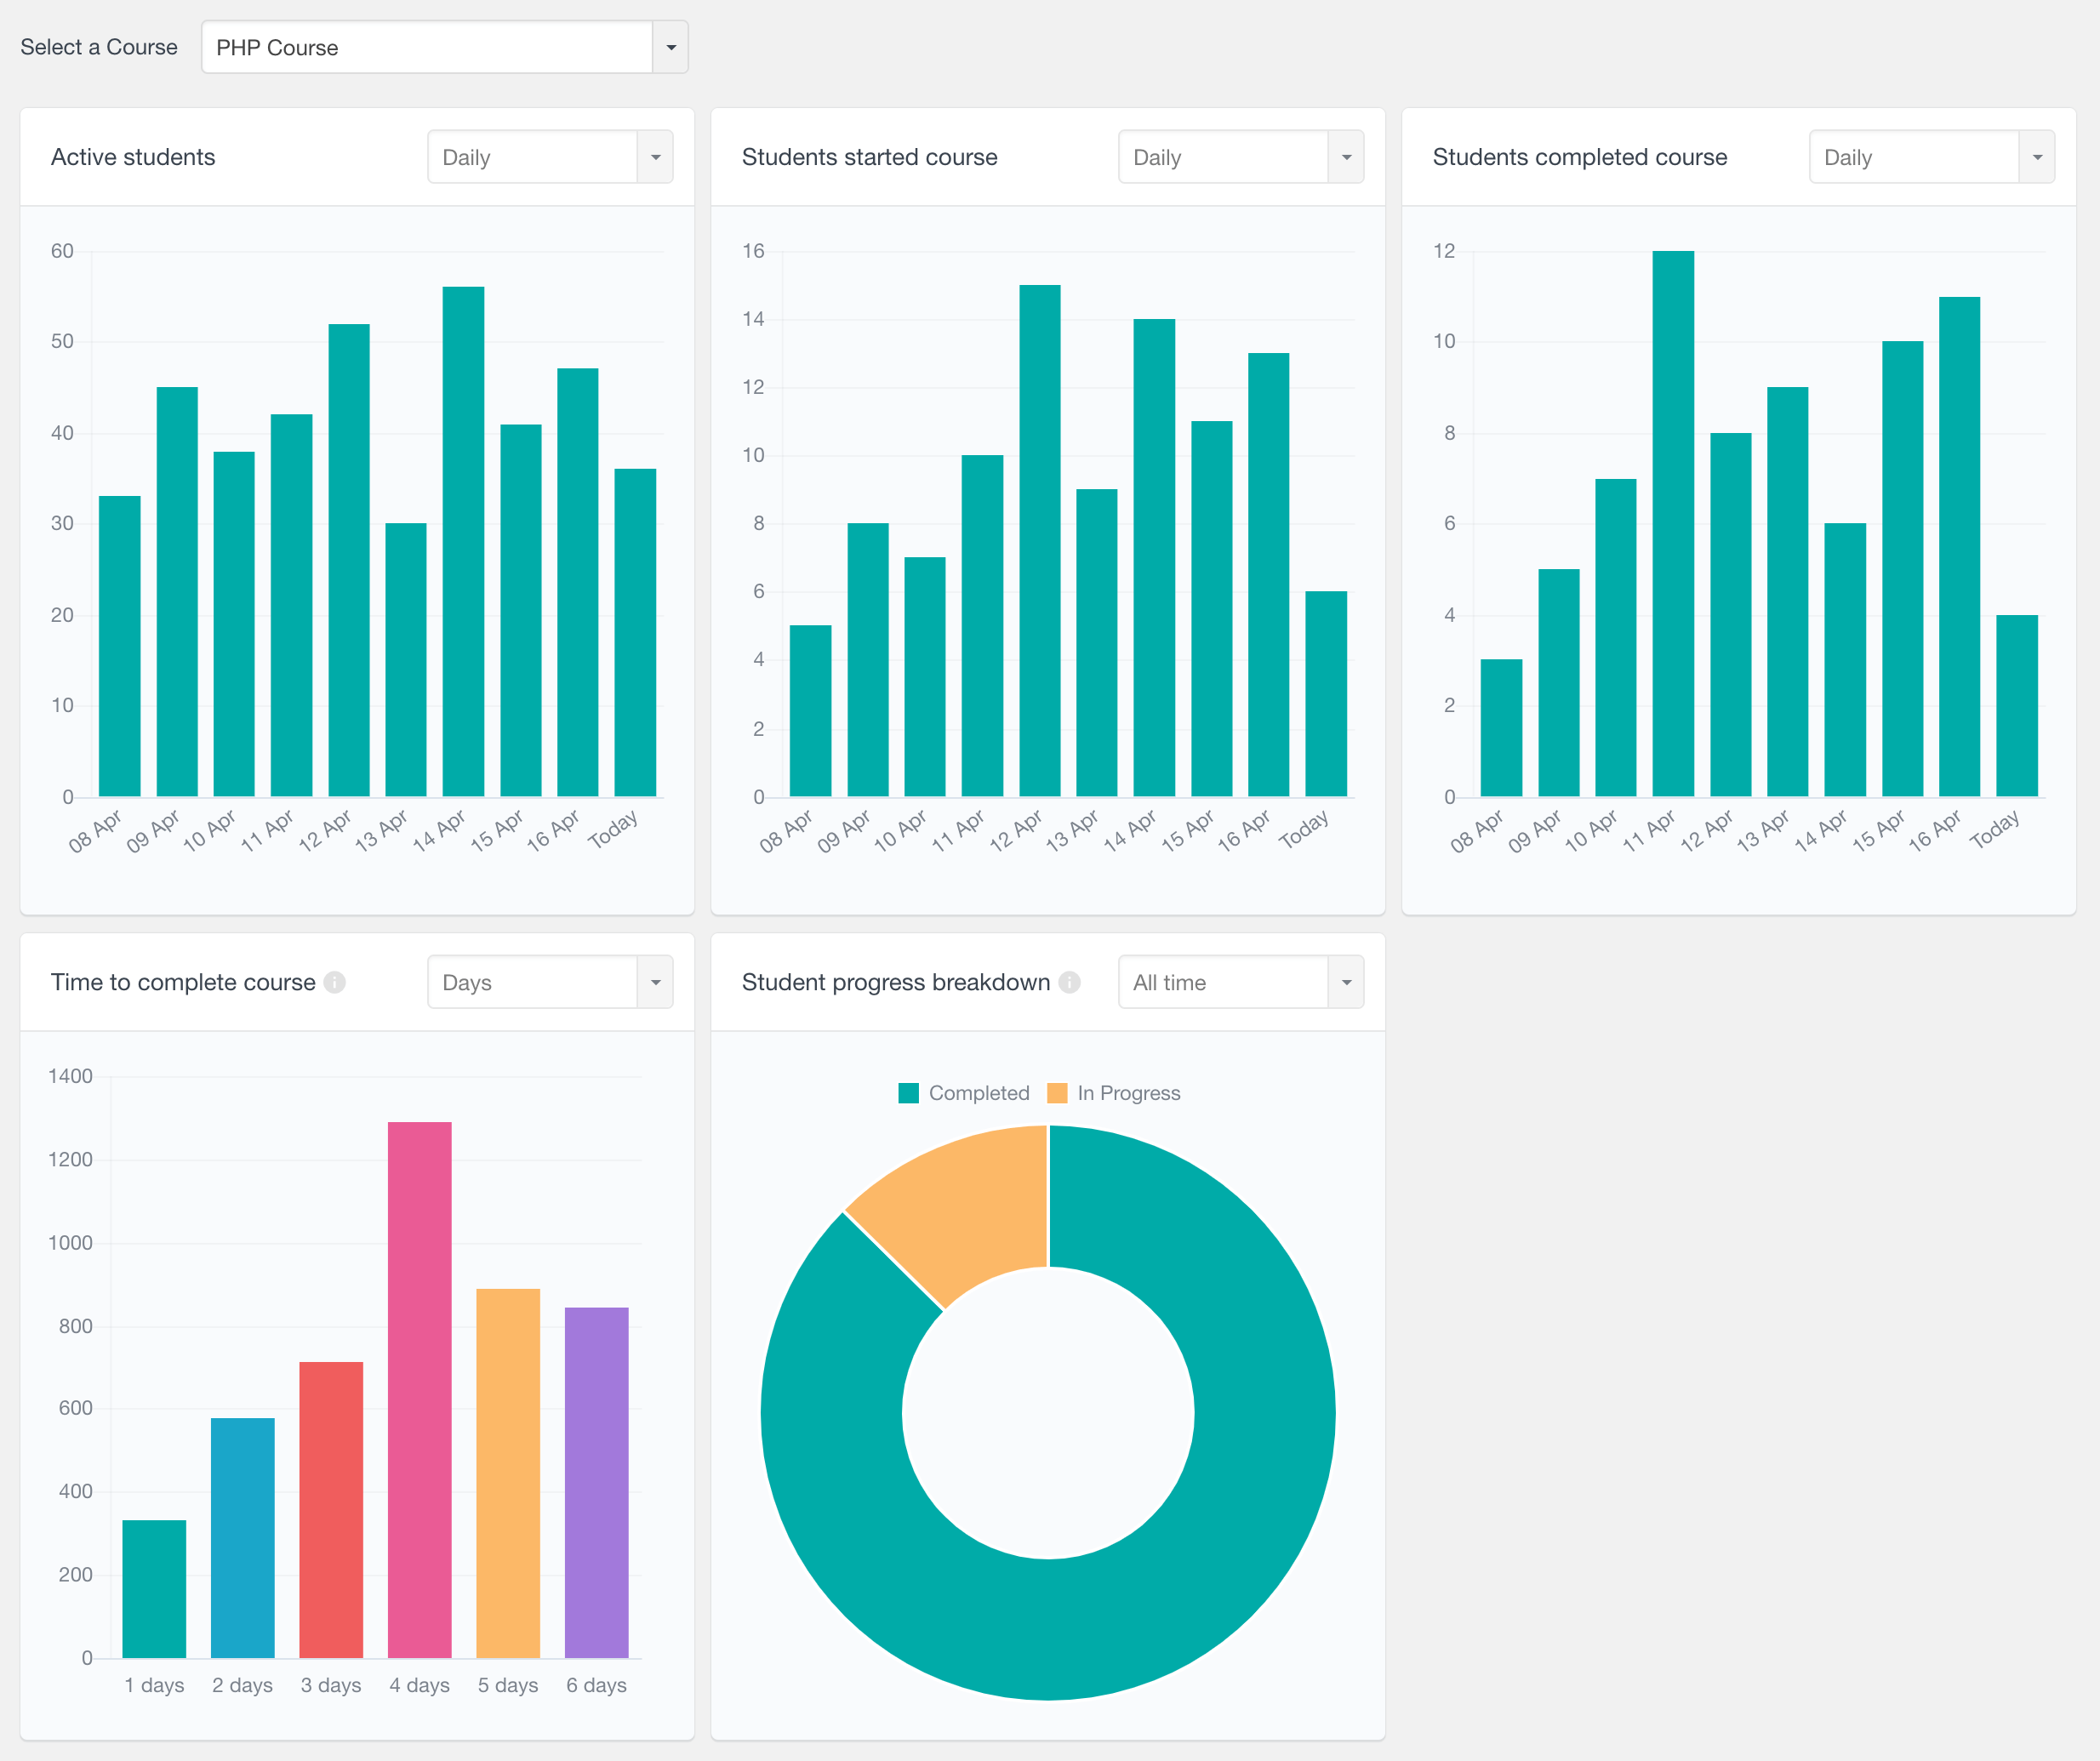
The available reports are:
- Active Students: Charts the number of active students in the course over time. Detects activity in lessons, topics and quizzes in the course.
- Students Started Course: Shows the number of students who have begun the course over time.
- Students Completed Course: Shows the number of students who have completed the course over time.
- Average Time to Complete Course: A distribution chart that illustrates the typical duration taken by students to finish the course. The default measurement is in days, but it can be adjusted to display hours, weeks, or months.
- Student Progress Breakdown: A pie chart that segments student progress into ‘in progress’ or ‘completed,’ with an option to filter by the start date of the course.
The “Students started course” and “Students completed course” reports that were available in the general LearnDash reports section have now been moved to this section.
LearnDash Quiz reports
Similarly, the new LearnDash Quiz reports section allows you to select a quiz and provides various reports for the selected quiz.
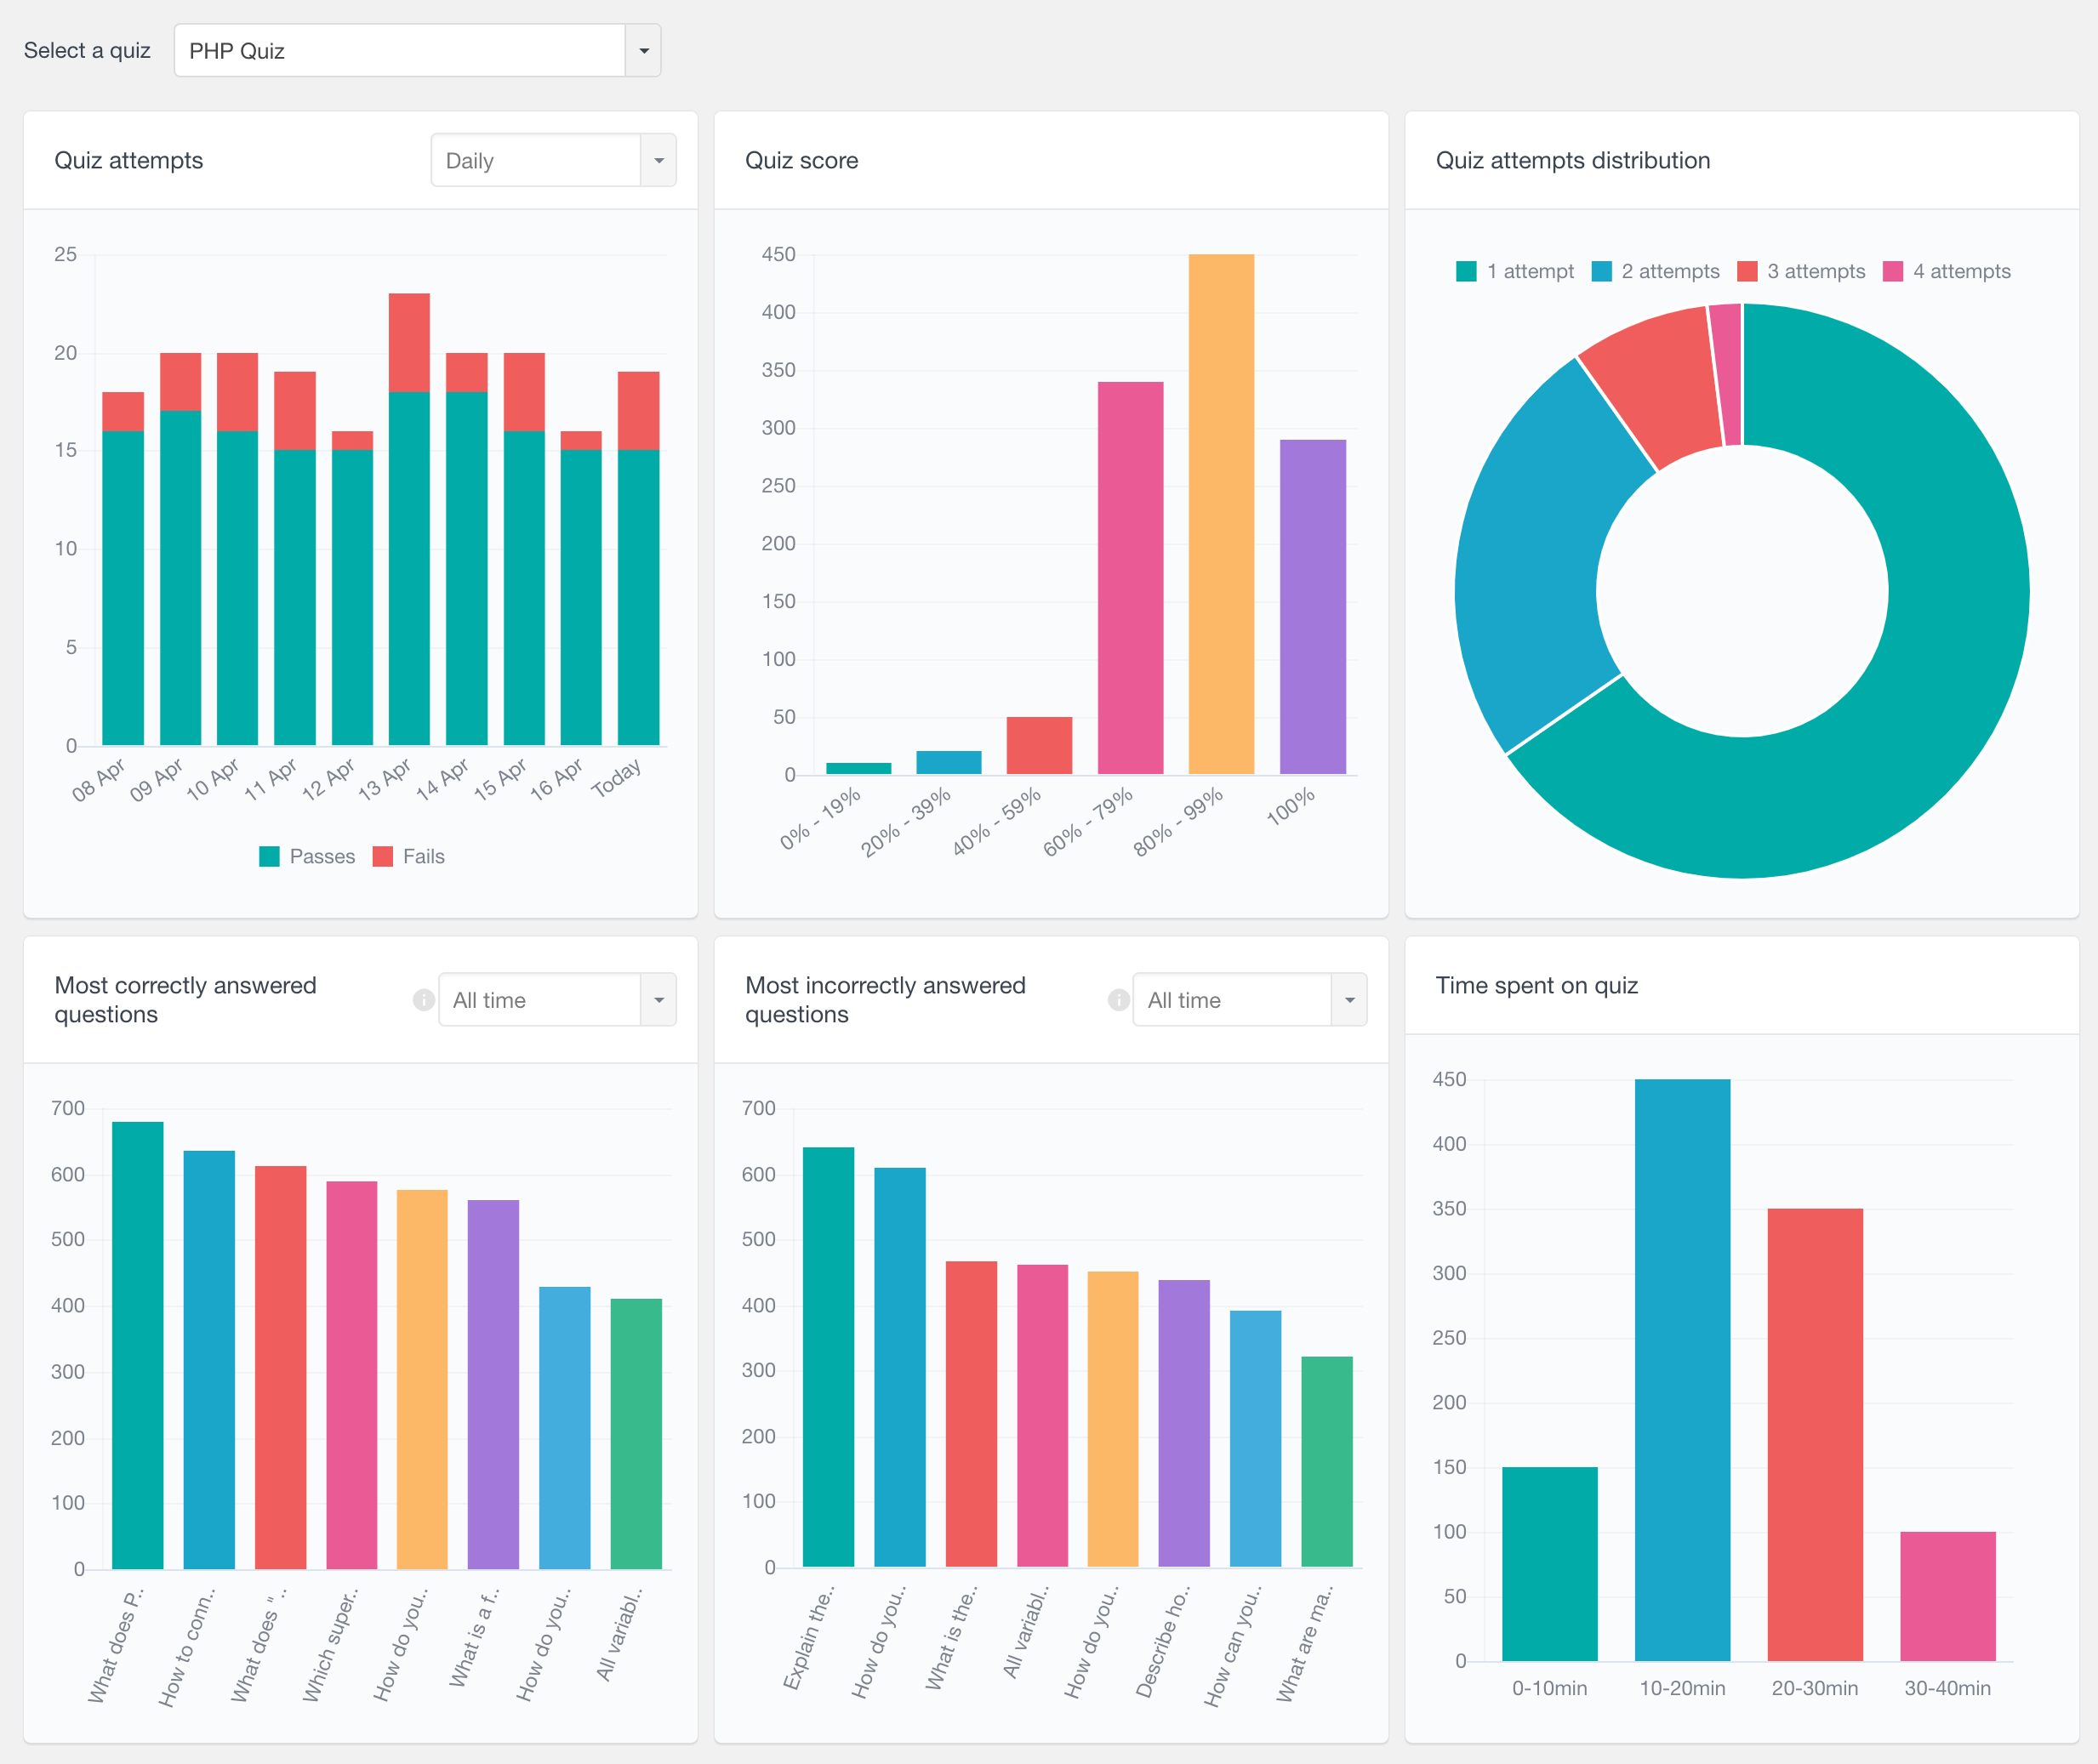
These reports include:
- Quiz Attempts: Displays the number of quiz attempts over time, with color-coded segments differentiating between passes and fails.
- Quiz Score: Shows the distribution of quiz scores to help visualize performance ranges.
- Quiz Attempts Distribution: A pie chart providing a breakdown of the number attempts made by students.
- Most Correctly Answered Questions: Shows questions that students most frequently answered correctly.
- Most Incorrectly Answered Questions: Highlights the questions that were most often answered incorrectly.
- Time Spent on Quiz: A distribution chart that shows the time participants spent on the quiz, helping to analyze the duration of quiz sessions.
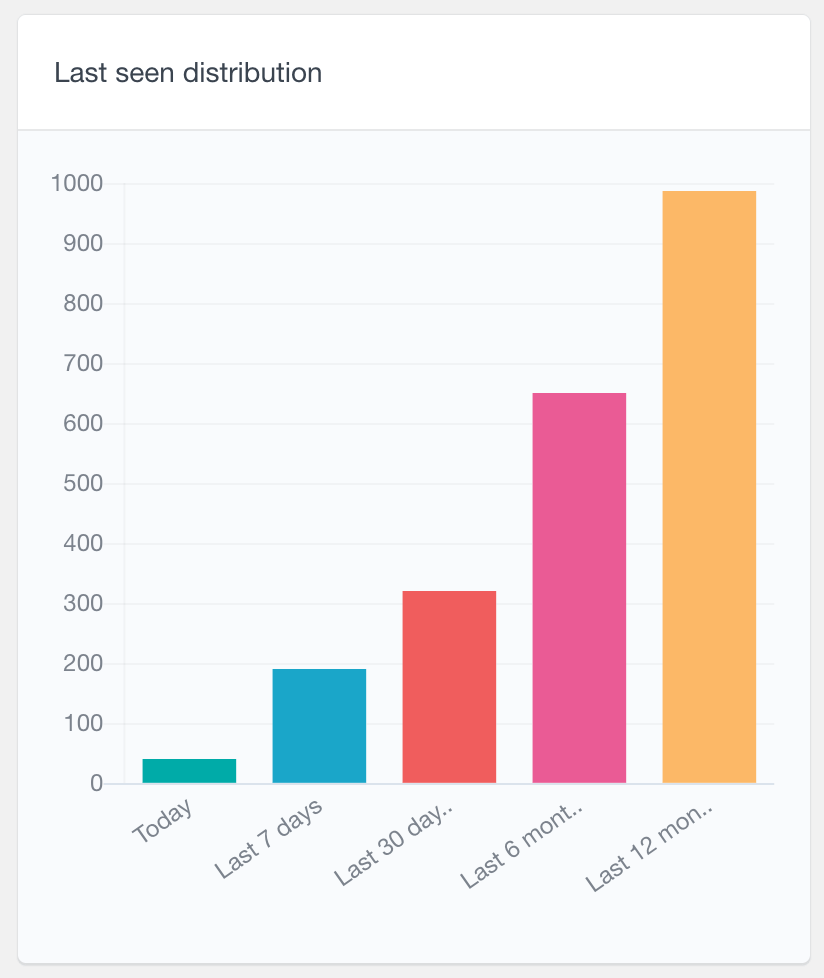
Last Seen report
If you’re using the Activity module, there is now a “Last seen” report showing you how many users have logged in in the most recent periods, such as Today, Last 7 days, Last 30 days, etc.
Other changes in Users Insights 4.6
This update also includes the following changes:
- LearnDash: added quiz attempt date and duration in the “Quiz attempts” section of user profile
- Fixed: Dark overlay on maps in Safari
- Fixed: Some WooCommerce product reports counting different variations of the same product within the same order separately
- Fixed: PHP 8.2 deprecation warnings
- Other minor bug fixes and improvements