The WooCommerce module of Users Insights comes with its own Reports page visualizing your sales and customer data with interactive charts inside your WordPress dashboard. In addition to the various filters and customer profile info that this module provides, the WooCommerce Reports feature can help you further analyze your store’s performance by turning your data (customer behavior and WooCommerce sales) into actionable insights. By unifying your WooCommerce customer data and turning it into a WooCommerce reports dashboard, Users Insights gives you a clear picture of your business performance and the leverage to use your customer data to make data-driven decisions.
Unlike the Users Insights table and filters that are designed to work with WordPress users only, the advanced WooCommerce reporting feature shows both user and guest data. The reason for this is that the reports mainly show order-related data, which might not be necessarily linked to users.
Users Insights comes with the following WooCommerce reports and analysis tools, including:
- General WooCommerce Reports (on this page)
- WooCommerce Product Reports
- WooCommerce Product Category Reports
- WooCommerce Customer Table, Filters and Profiles
WooCommerce Analytics Dashboard
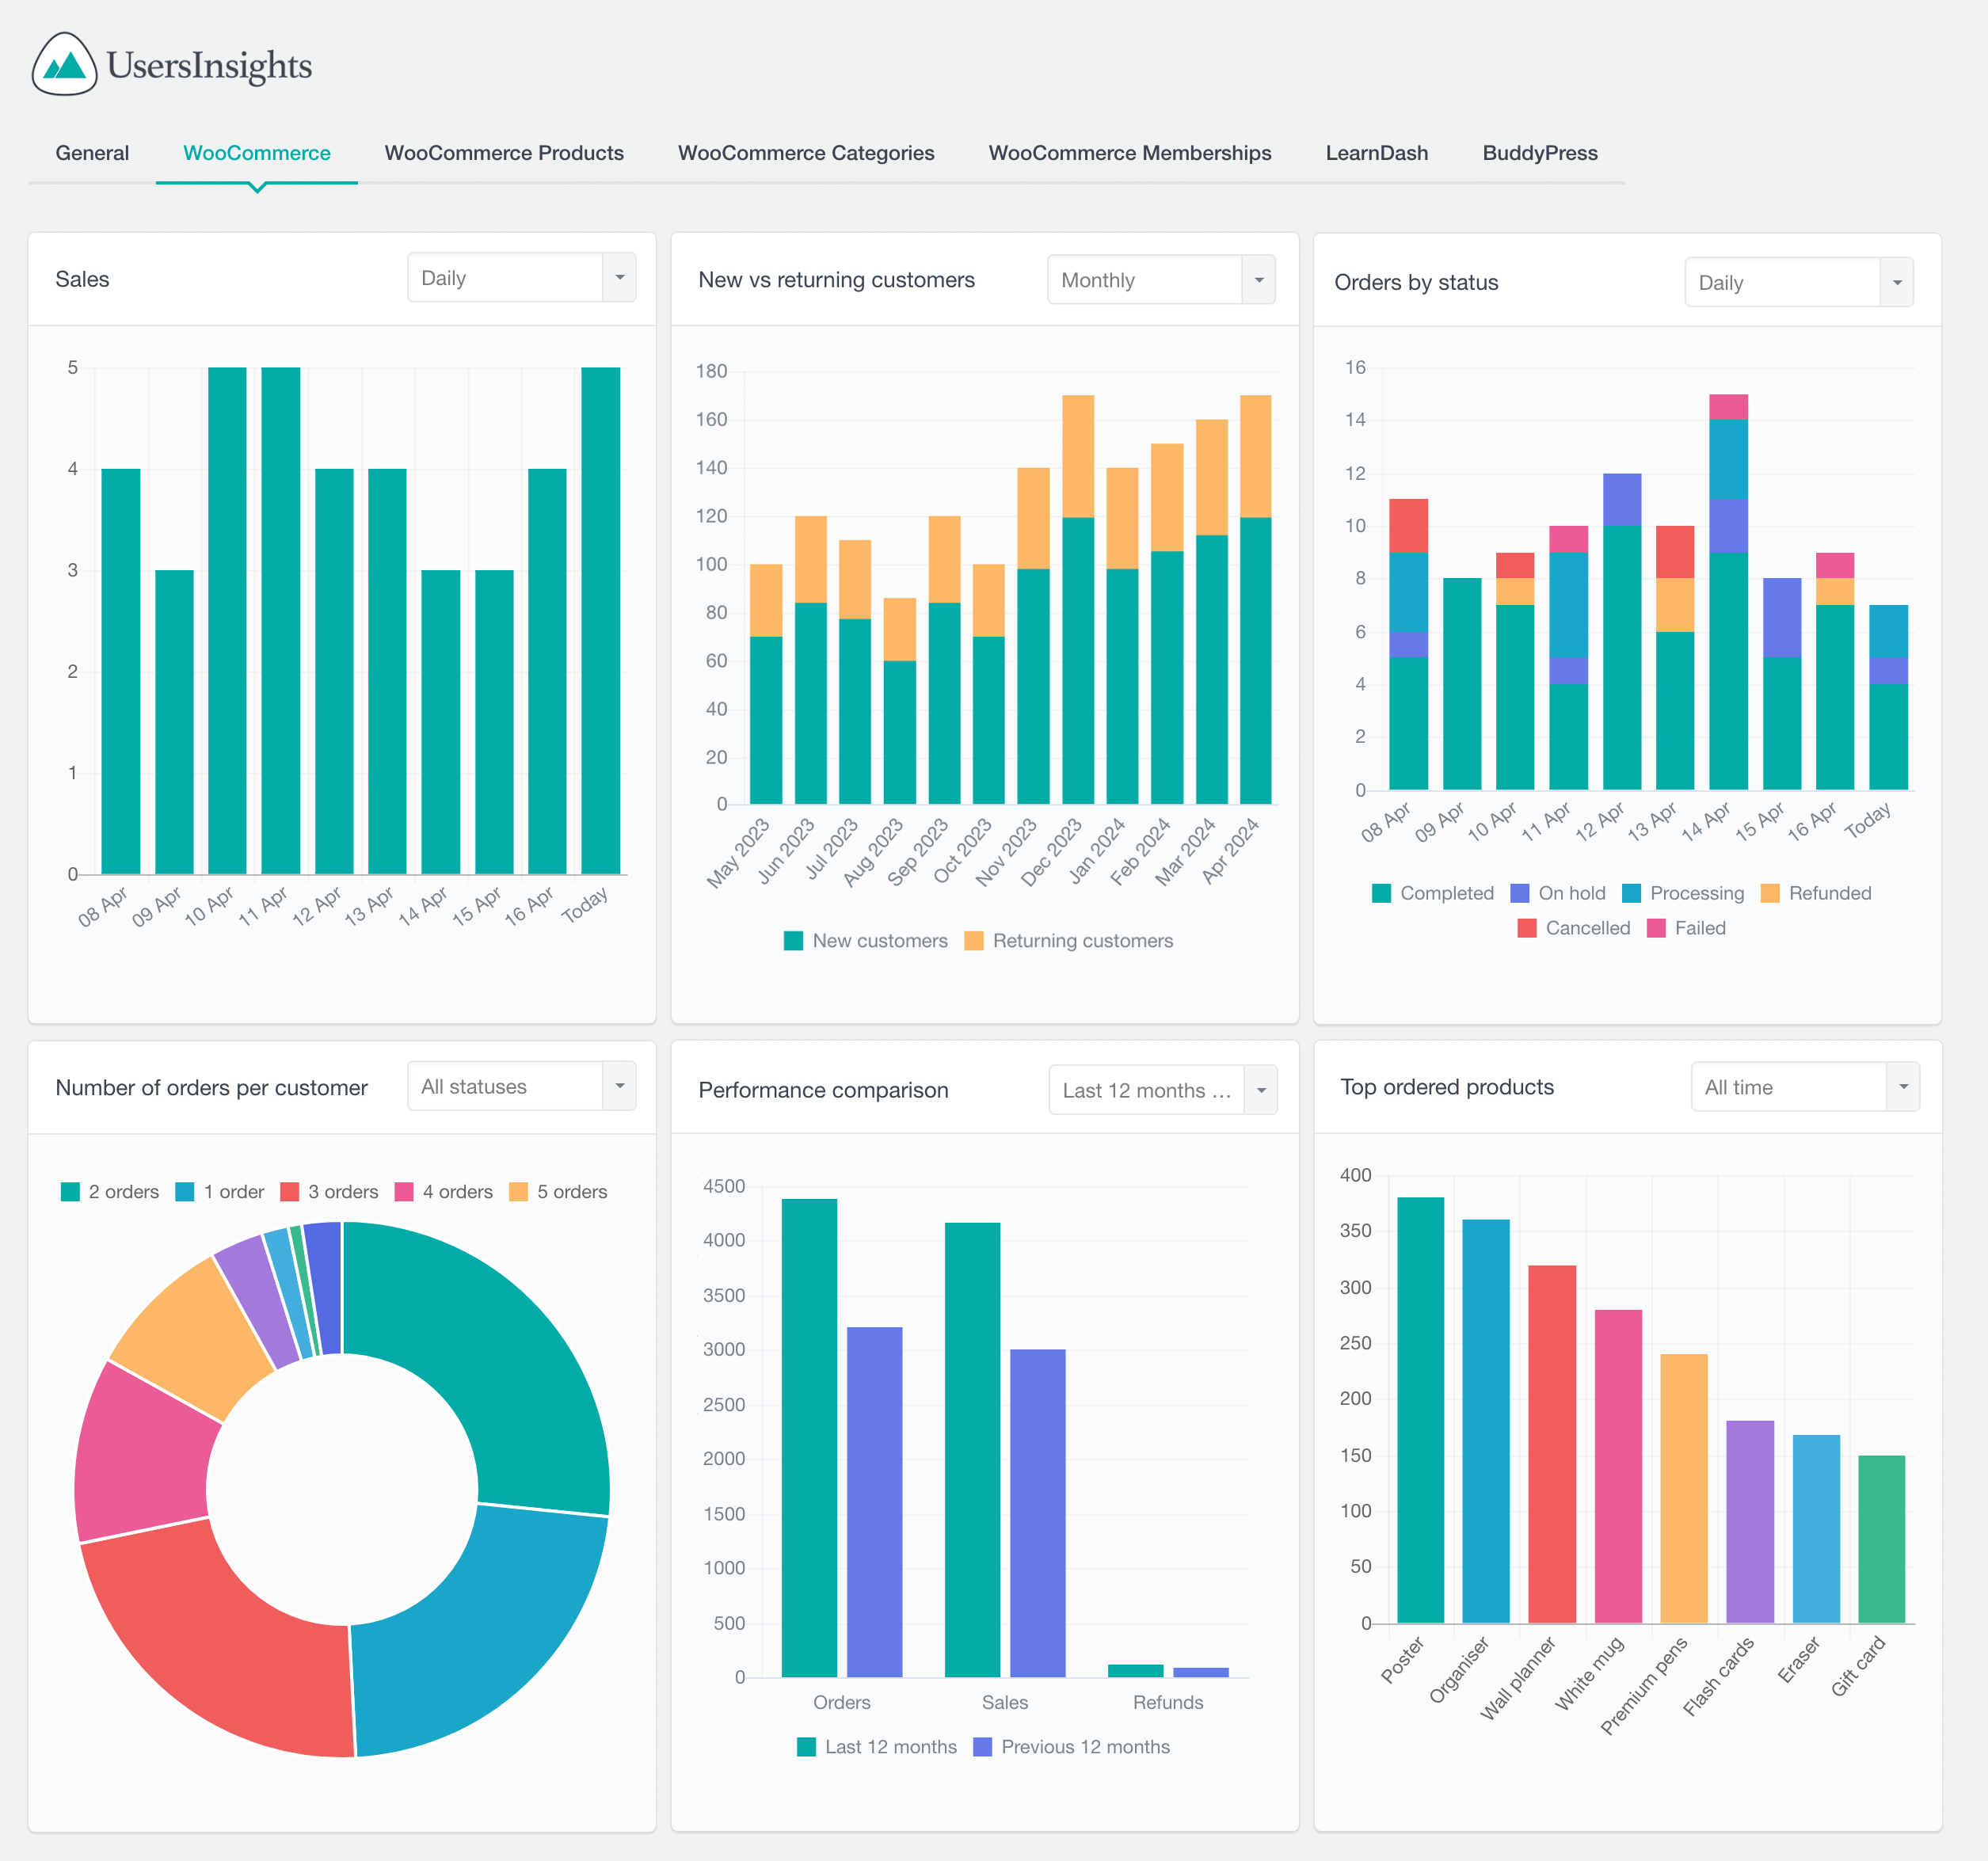
Users Insights includes a powerful WooCommerce analytics tool that provides store owners with valuable insights into their WooCommerce store. The WooCommerce analytics dashboard visualizes a wealth of information, including metrics and statistics on orders, customers, products, coupons, and more. In most reports, store owners can use the date range selector to view data for specific time periods. The WooCommerce analytics reports are an invaluable resource for store owners looking to improve their WooCommerce store.
WooCommerce Key Metrics Reports
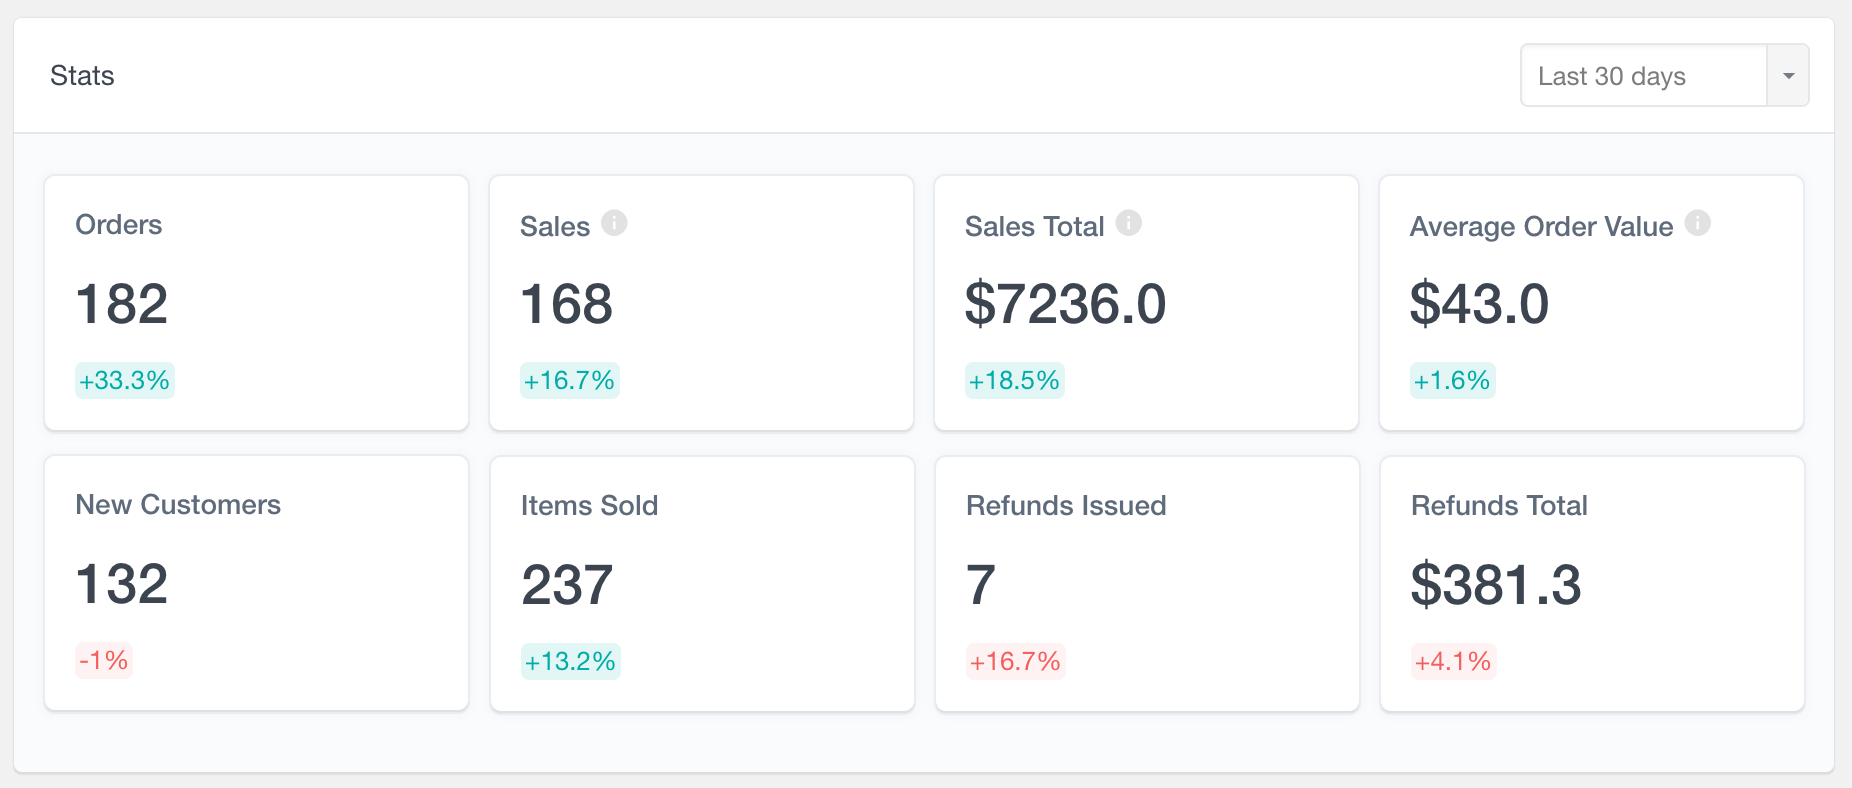
The key metrics reports provide a quick overview of key store metrics, offering insights at a glance into performance over a selected time period. Each stat includes the current value – such as total sales, number of orders, or new customers – and shows the percentage change compared to a previous period. You can choose from predefined ranges like “Last 30 days” or “Last 6 months”, or select a custom date range. The available metrics are:
- Orders – total number of orders
- Sales – orders with status Completed, Processing, or On Hold
- Sales Total – total amount of sales orders (does not reflect partial refunds)
- Average Order Value – average value of sales (does not reflect partial refunds)
- New Customers
- Items Sold
- Refunds Issued – number of refunds issued in the selected period. This could include refunds on orders made outside of the selected period.
- Refunds Total – total amount of the refunds issued in the selected period
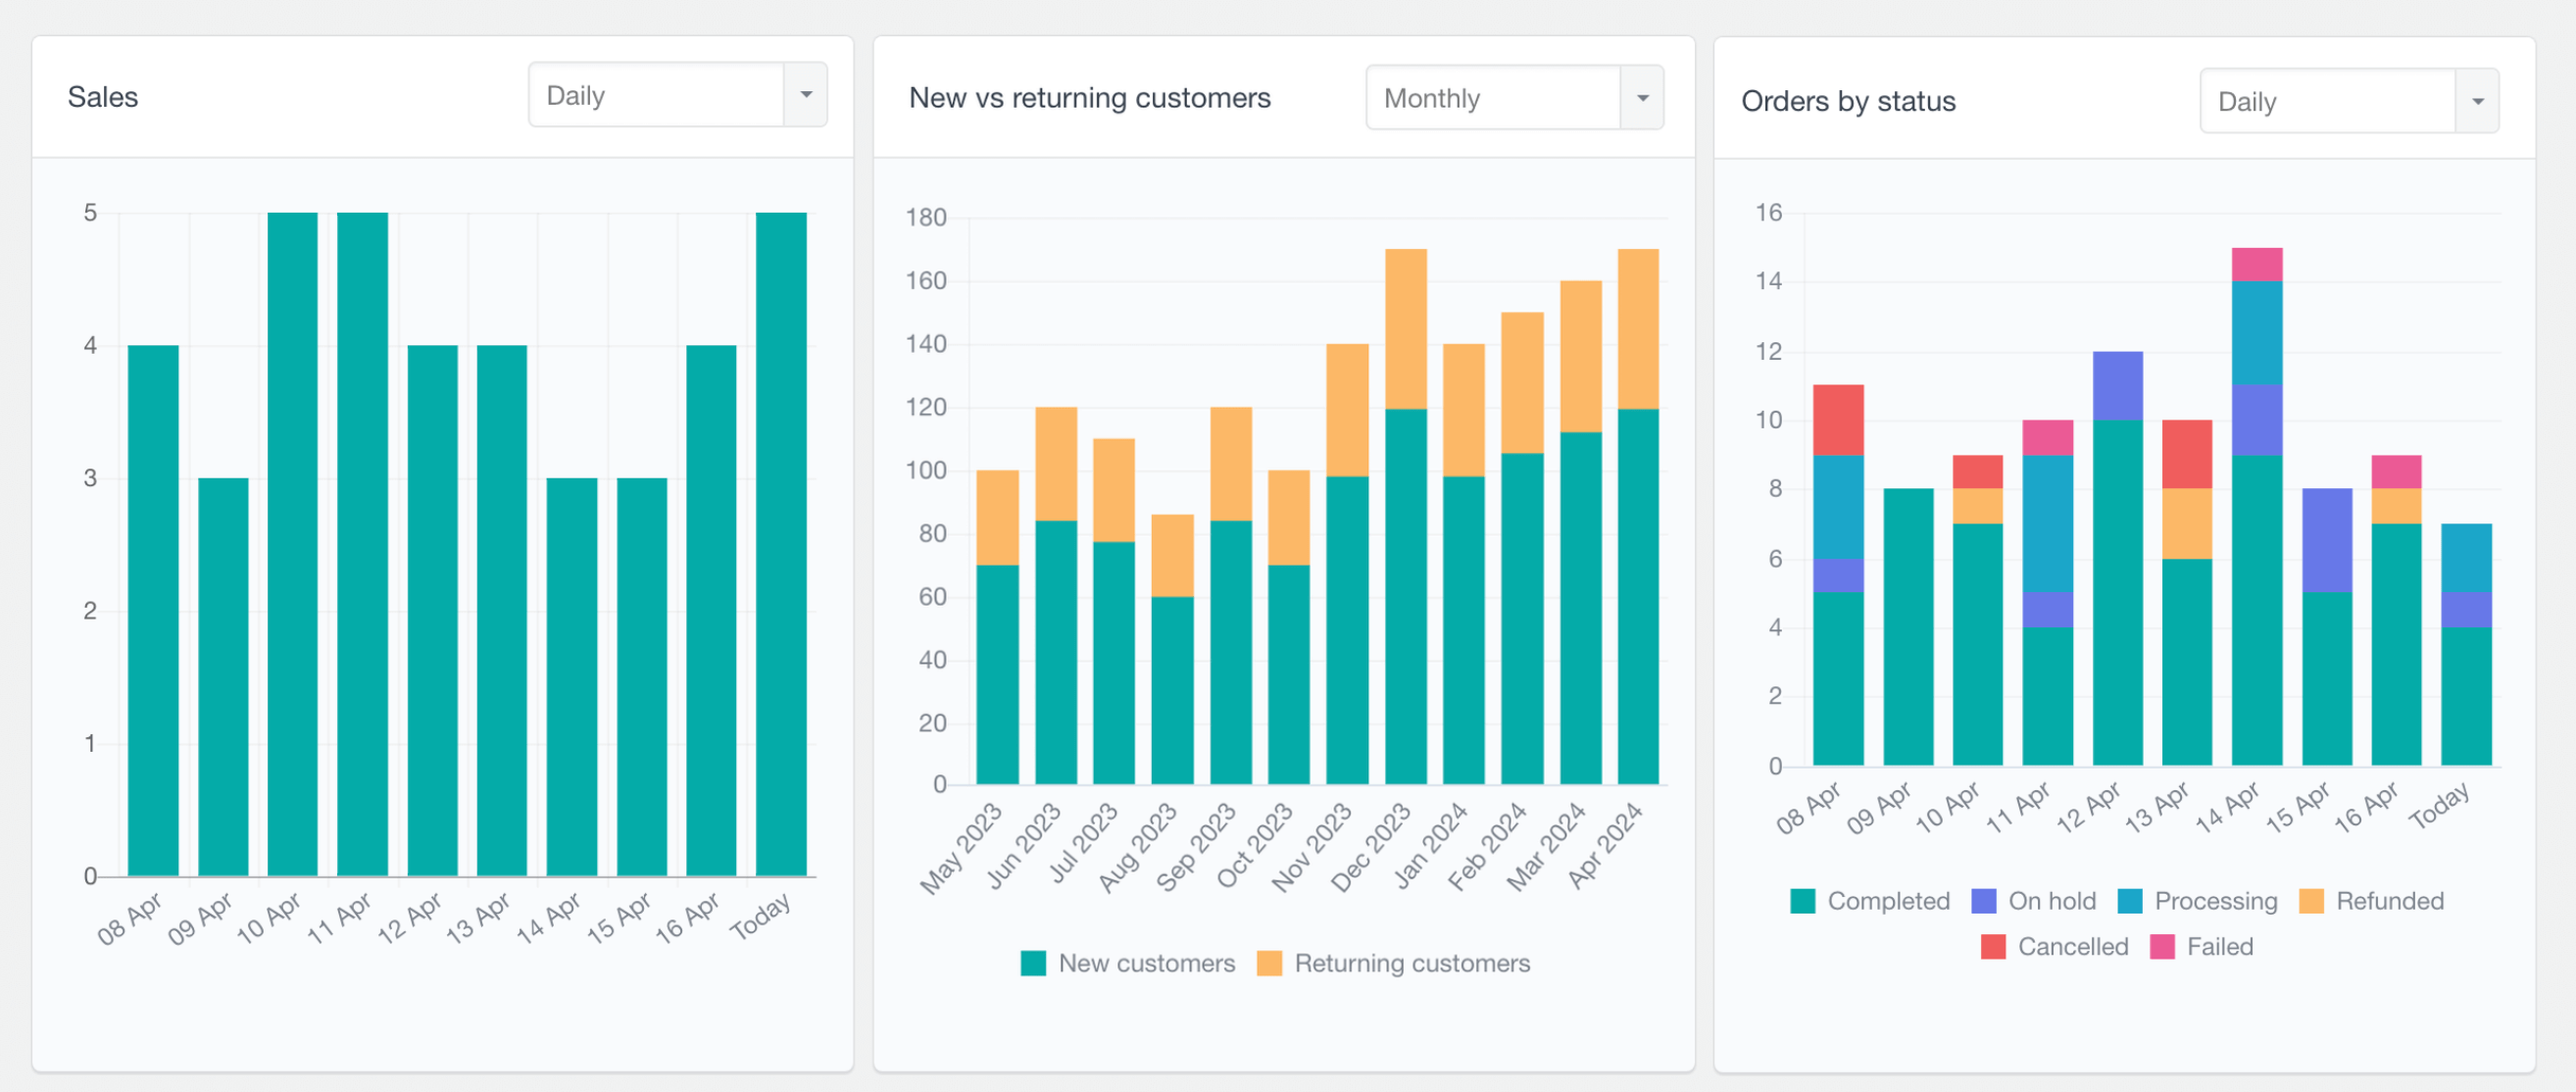
WooCommerce sales report
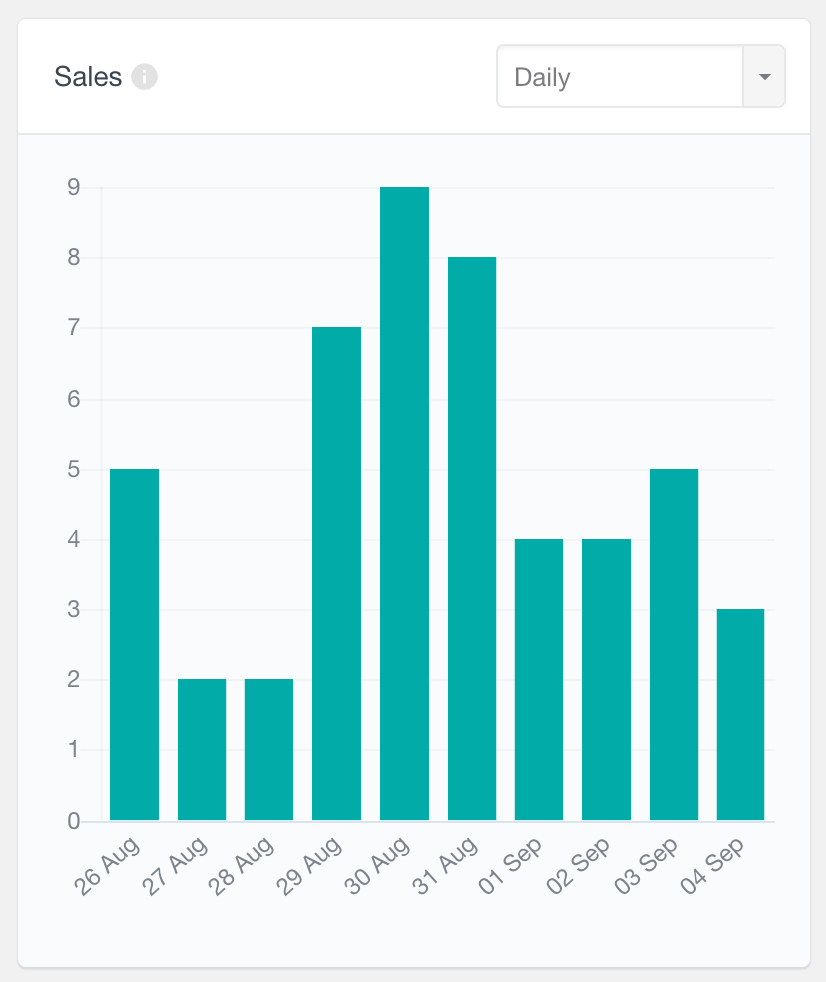
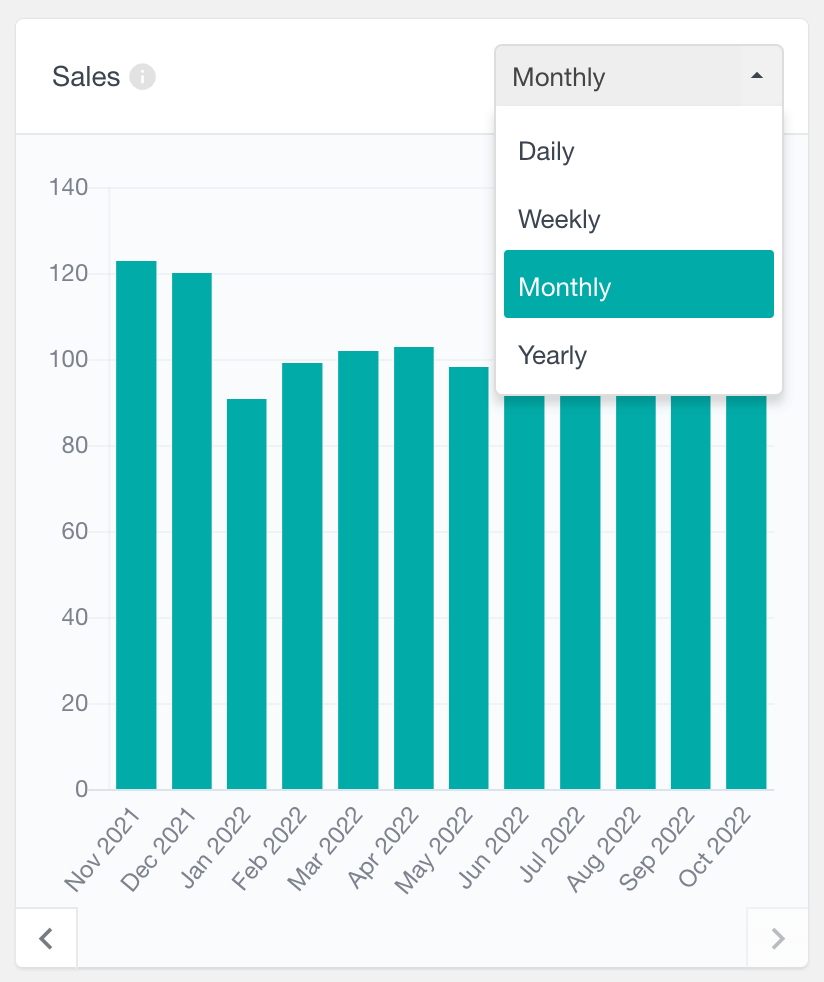
The Sales Report shows the number of sales made over time. You can see the number of sales made in the last several days, weeks, months, or even years. This report can best show you how your store is performing over time. An order is considered a sale if it has one of the following statuses: Completed, Processing, or On hold. In this way, orders that are canceled or failed are not counted, so you can only analyze the successful orders. Just like with any other time-based report, the most recent period is shown, however you can also use the navigation buttons to explore previous periods.
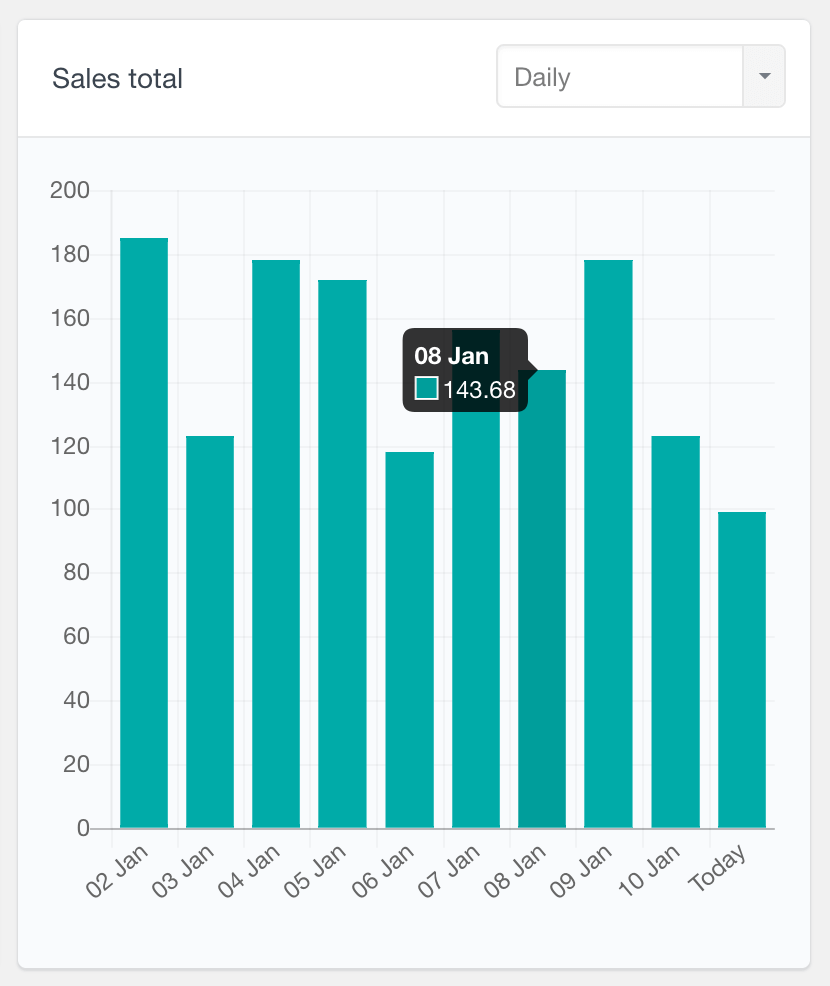
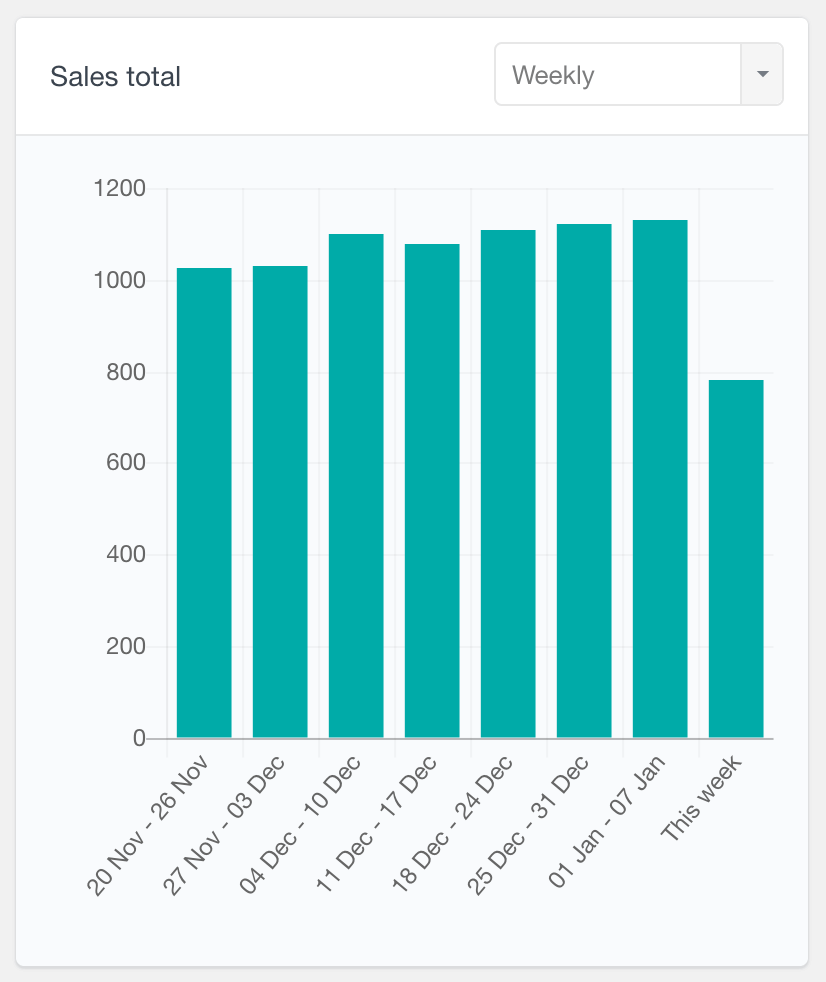
WooCommerce sales total report
This report represents the total amount of sales (a form of gross sales) made for the selected period. As we mentioned above, we consider a sale for every order that is in a completed, processing, or on hold status. Therefore, this WooCommerce report reflects the total amount of these orders (please note that partial refunds are not deducted from the total amount).
While the number of sales can show you the overall buying activity on your site, the sales total report can be useful to analyze the financial performance of your store over time.
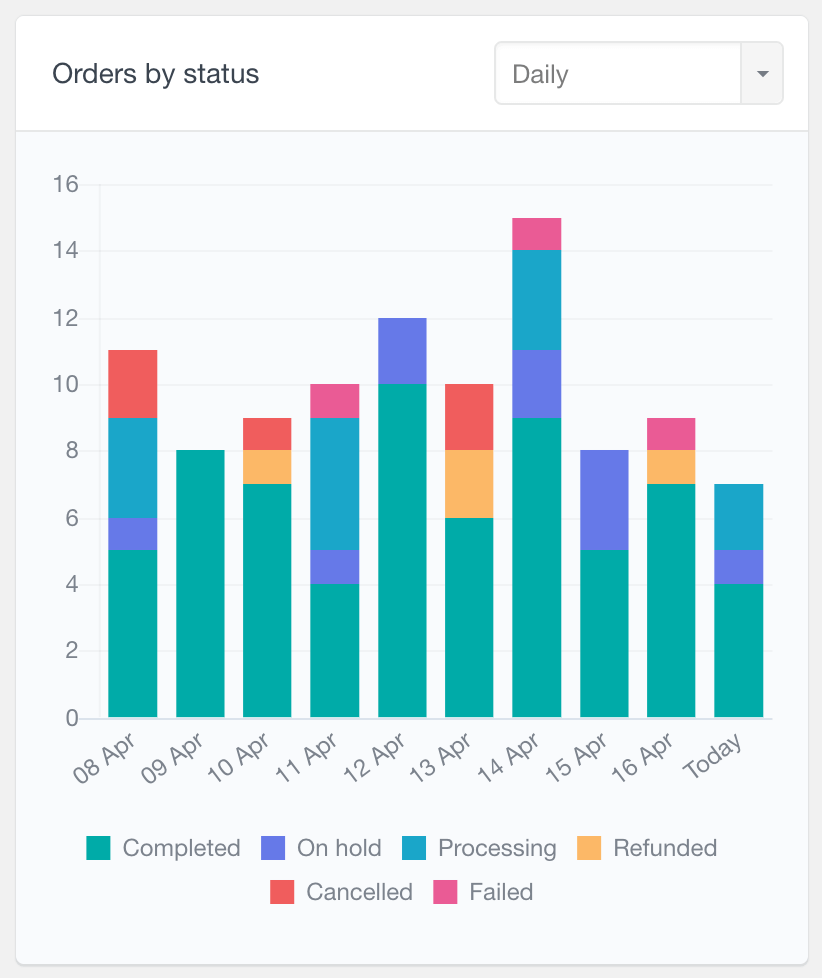
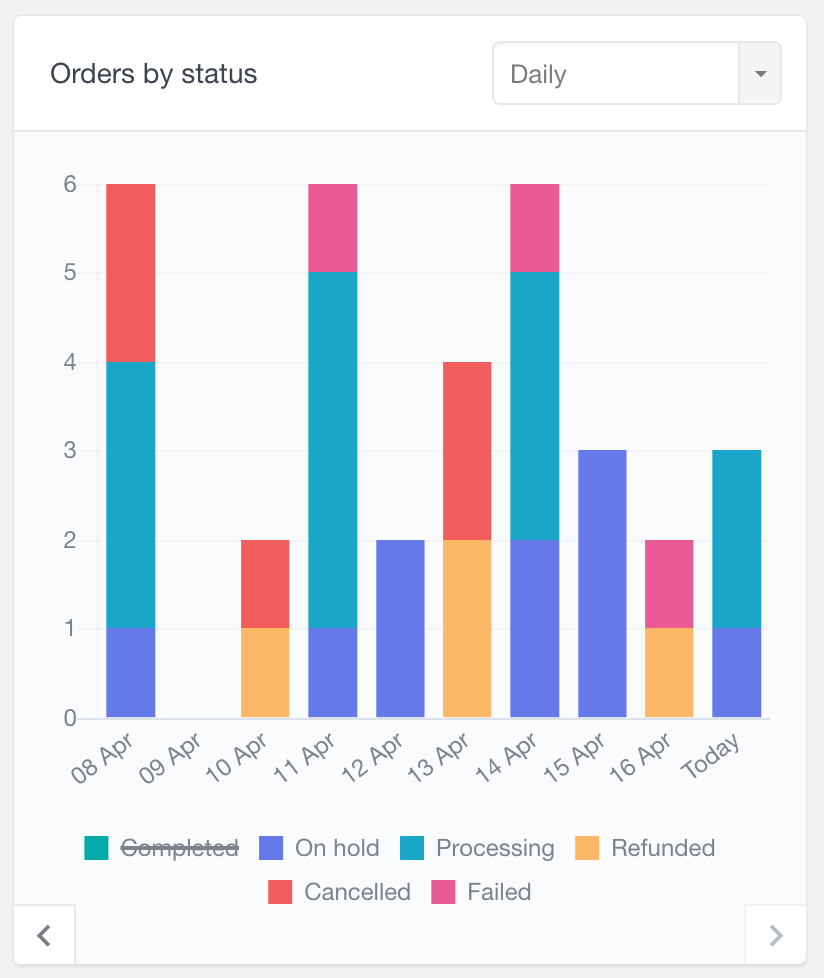
WooCommerce orders by status report
The “Orders by Status” report provides a detailed breakdown of your WooCommerce orders, presented in a stacked bar chart format with each order status highlighted in a distinct color. You can analyze the order data over daily, weekly, monthly, or yearly periods, and you can easily scroll back in time to view historical data. This report also features interactive labels, allowing you to tailor the chart to highlight relevant data. For example, by clicking on a status label such as “Completed,” you can hide all orders with that status from the chart. This report can help you efficiently manage and visualize order trends based on their status.
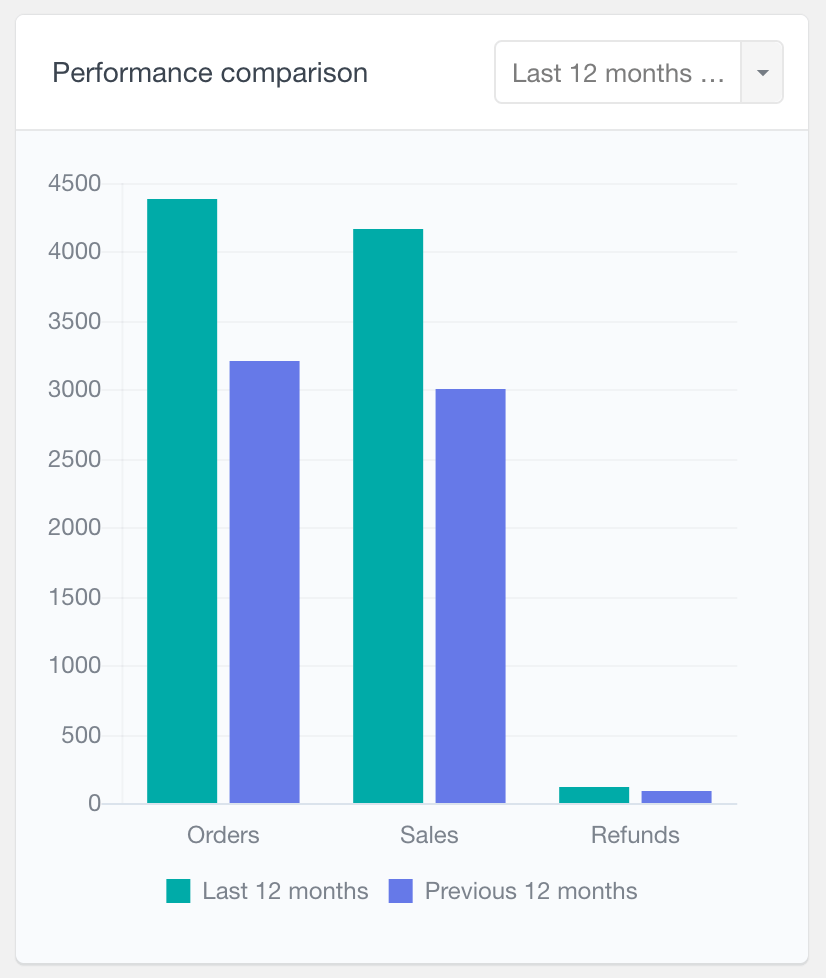
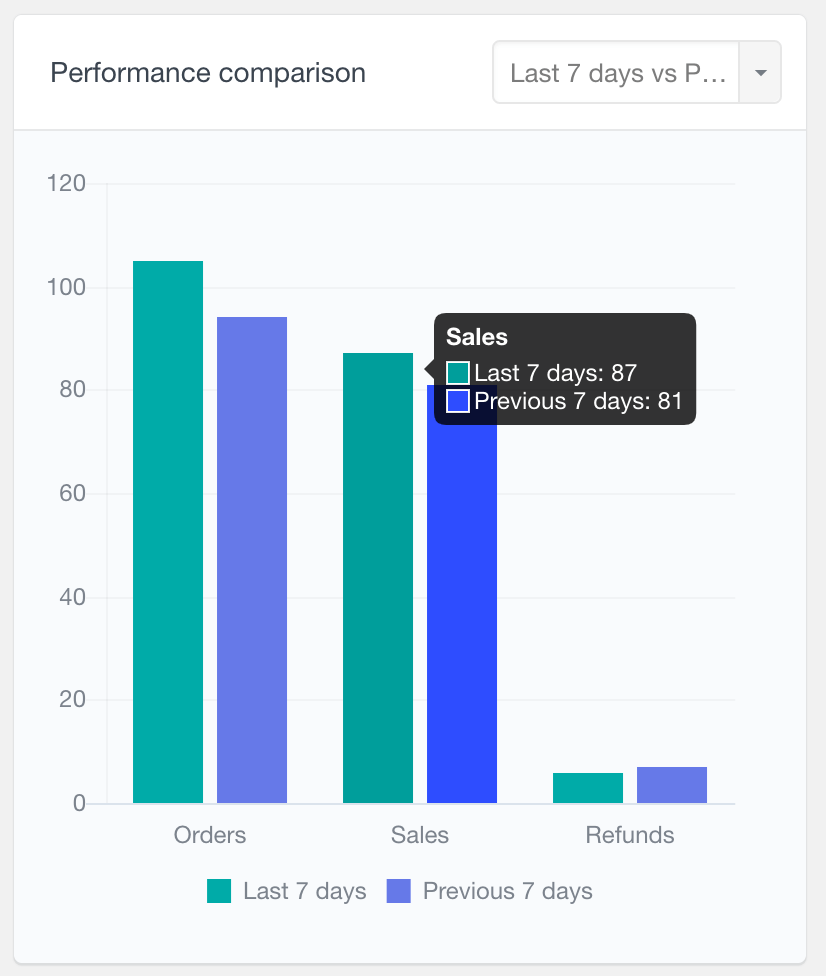
WooCommerce performance comparison report
The “WooCommerce Performance Comparison” report allows you to directly compare the number of orders, sales, and refunds between a selected recent period and the corresponding previous period. You can choose to view data from the last 7 days, last 30 days, last 6 months, or last 12 months. Additionally, when you hover over the data in the chart, tooltips appear providing more detailed information about each group. This report aims to provide a straightforward overview of your store’s performance over different periods.
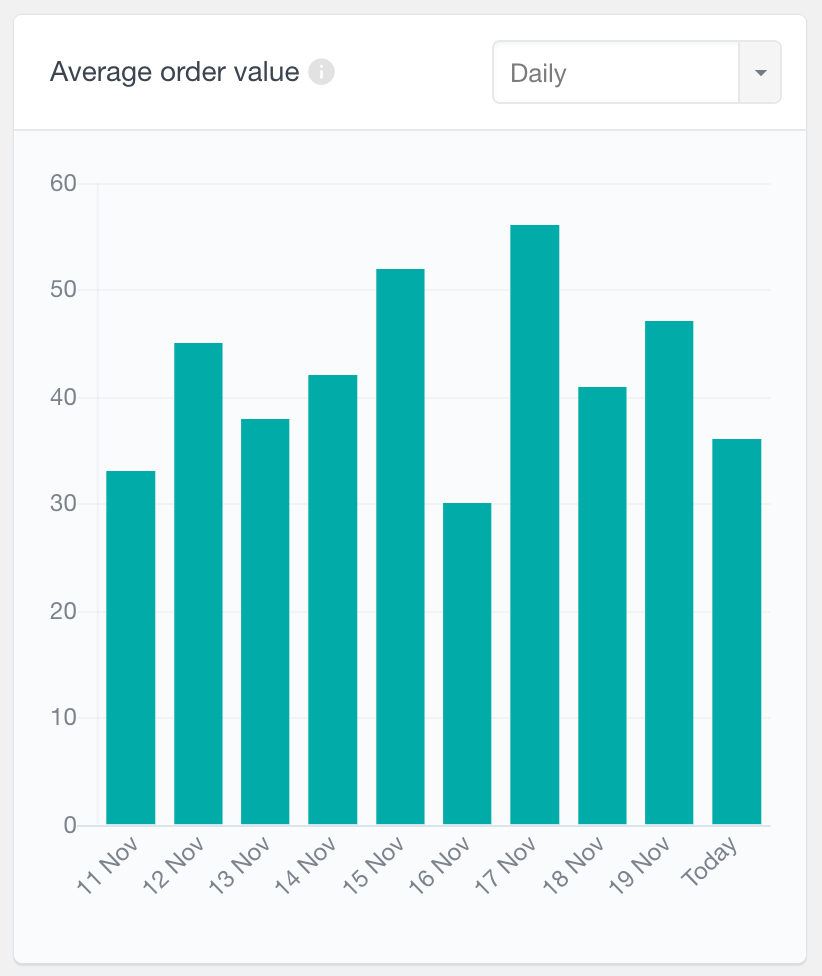
WooCommerce average order value report
This is a periodic report showing the average order value of all sale orders (with status Completed, Processing, or On hold) over time. The report calculates average order value by dividing the order total value (not reflecting partial refunds) for the selected period by the number of qualifying orders. The report can be filtered by date range and compared against previous periods to identify changes in purchasing patterns or order size.
WooCommerce cost of goods sold (COGS) report
If you are using the Cost of goods sold feature which can be enabled under WooCommerce > Advanced > Features, you can use this report to explore the total COGS value across different time periods. This data is available for all sale orders (with status Completed, Processing, or On hold, not reflecting partial refunds) made after the cost of goods sold value has been entered for the products. This information can help you understand overall cost performance, making it easier to monitor profitability trends and identify periods where total costs fluctuate.

WooCommerce customer reports
The Users Insights reporting plugin includes some customer-specific reports providing a general WooCommerce customer summary. With these reports, you can easily monitor vital metrics, such as how many new customers you have over time, where your customers come from and the WooCommerce sales by customer. These customer analytics are customizable, allowing you to change the reporting based on your eCommerce store needs.
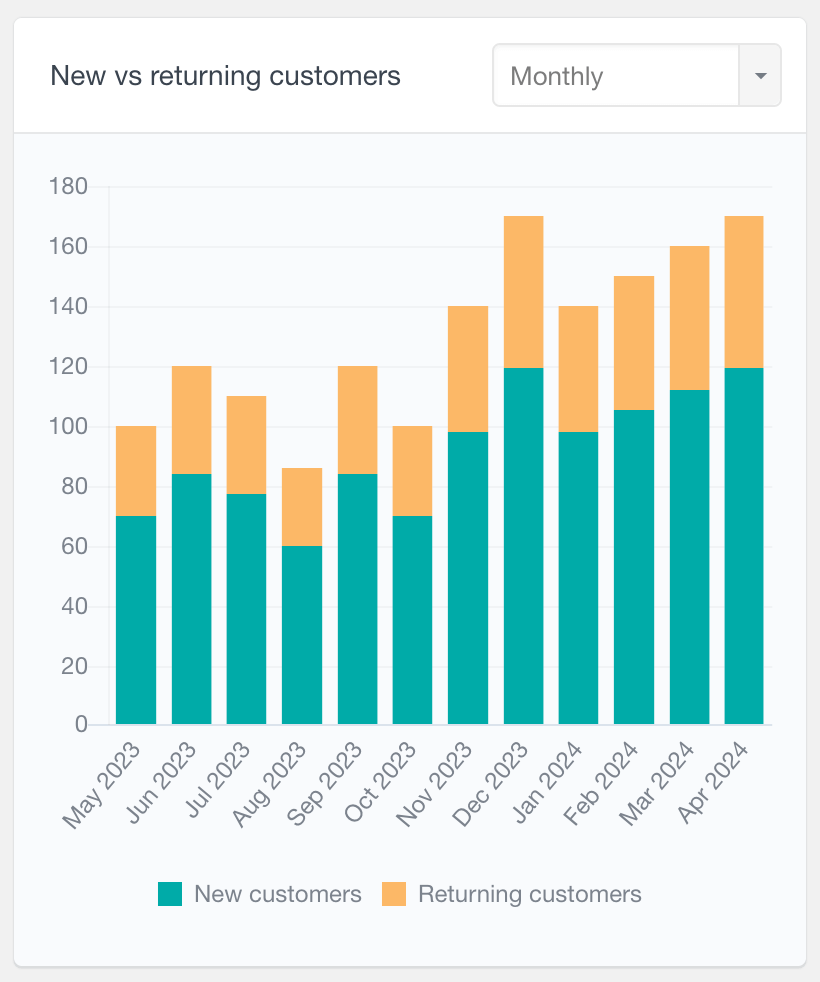
WooCommerce new vs returning customers report
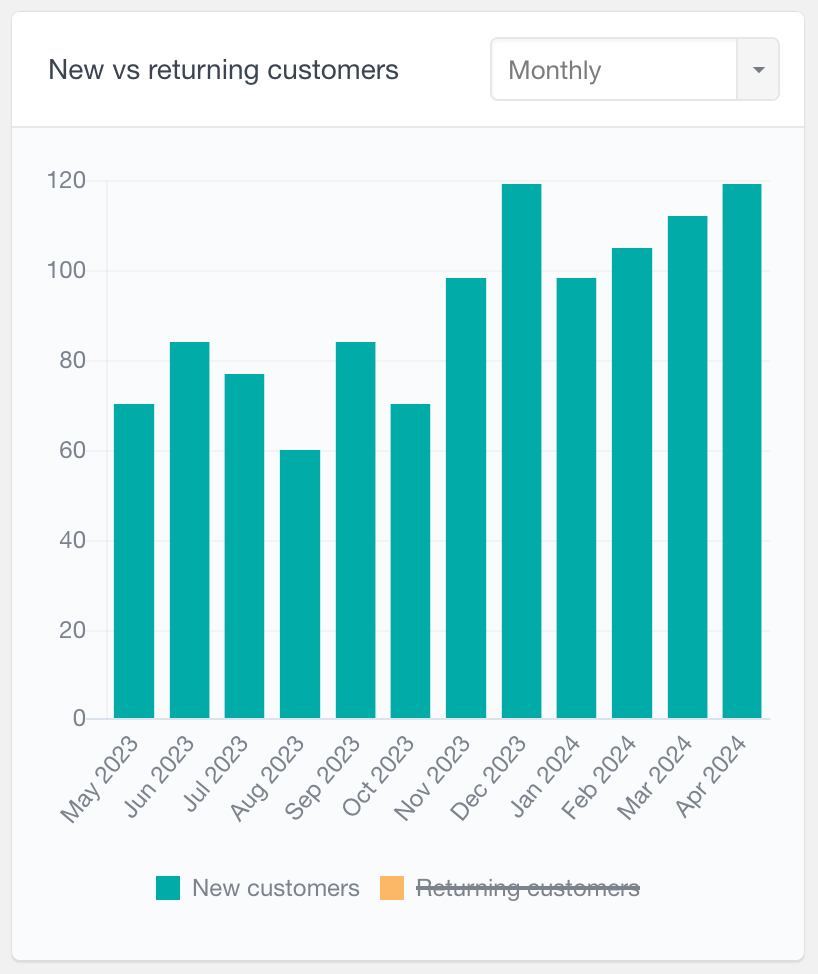
The New vs Returning Customers Report can show the number of new vs returning customers over time. This report distinguishes between new and returning customers using different colors for each group. You can view data across various time frames—daily, weekly, monthly, or yearly. Additionally, the interactive labels allow you to toggle the visibility of each customer group. For example, clicking on “Returning Customers” will hide this group, enabling a focused view of only new customers. A “new customer” is defined as someone who has placed their first order within the selected reporting period. This feature is particularly useful for tracking customer retention and acquisition trends.
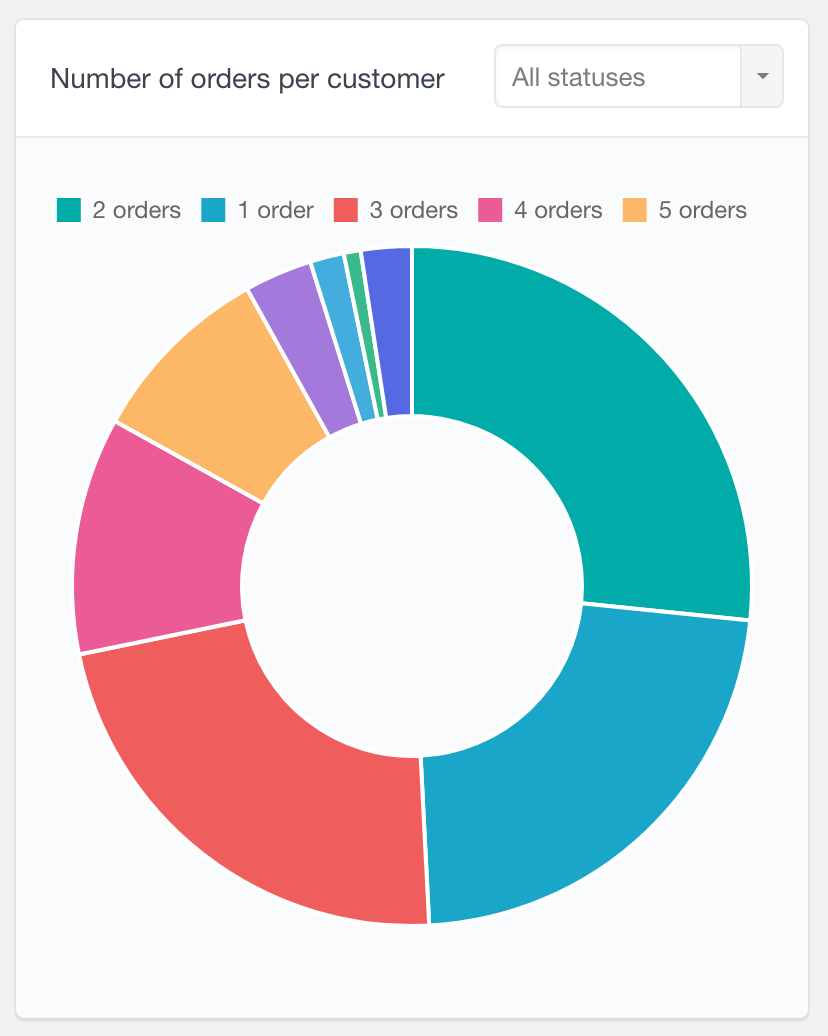
WooCommerce sales by customer report
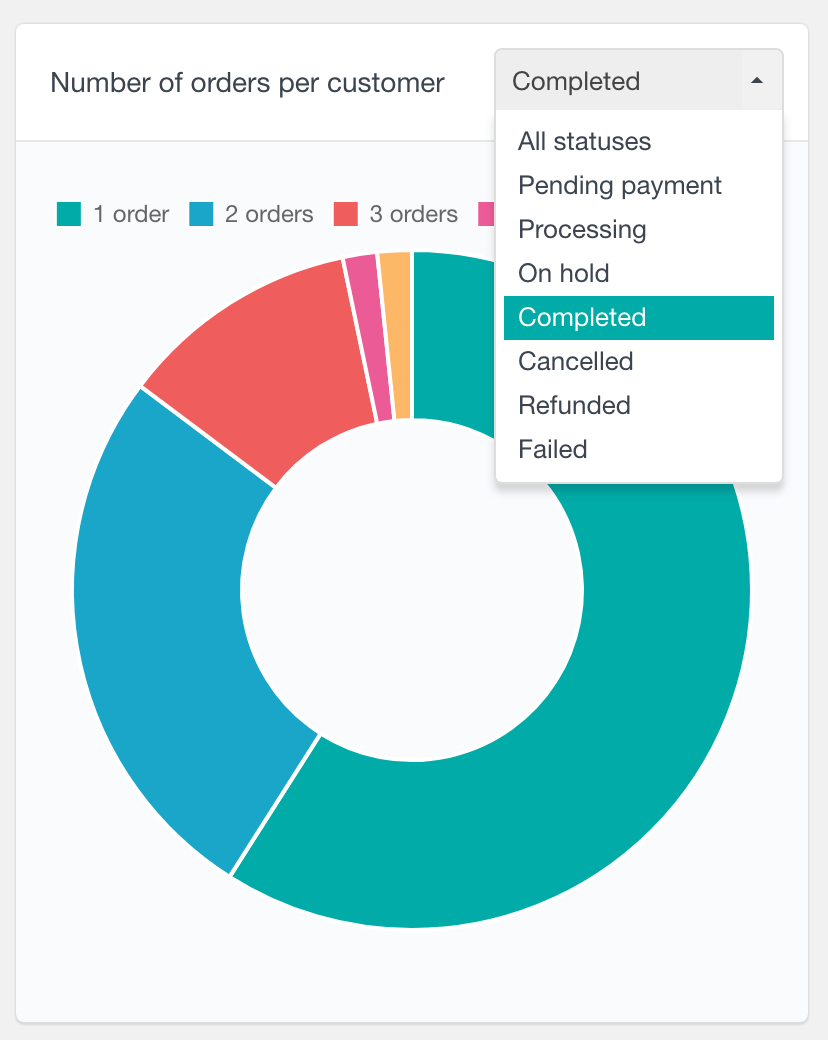
The number of orders per customer metric is a pie chart report, that can help you visualize the percentage of your repeat buyers. With this report, you can easily monitor customer sales and see how many customers you have with one order, two orders, and so on. Additionally, this WooCommerce customer report allows further filtering of the orders by their status, so for example, selecting the “Completed” order status can give you a general overview of the WooCommerce sales per customer.
Top WooCommerce billing countries report
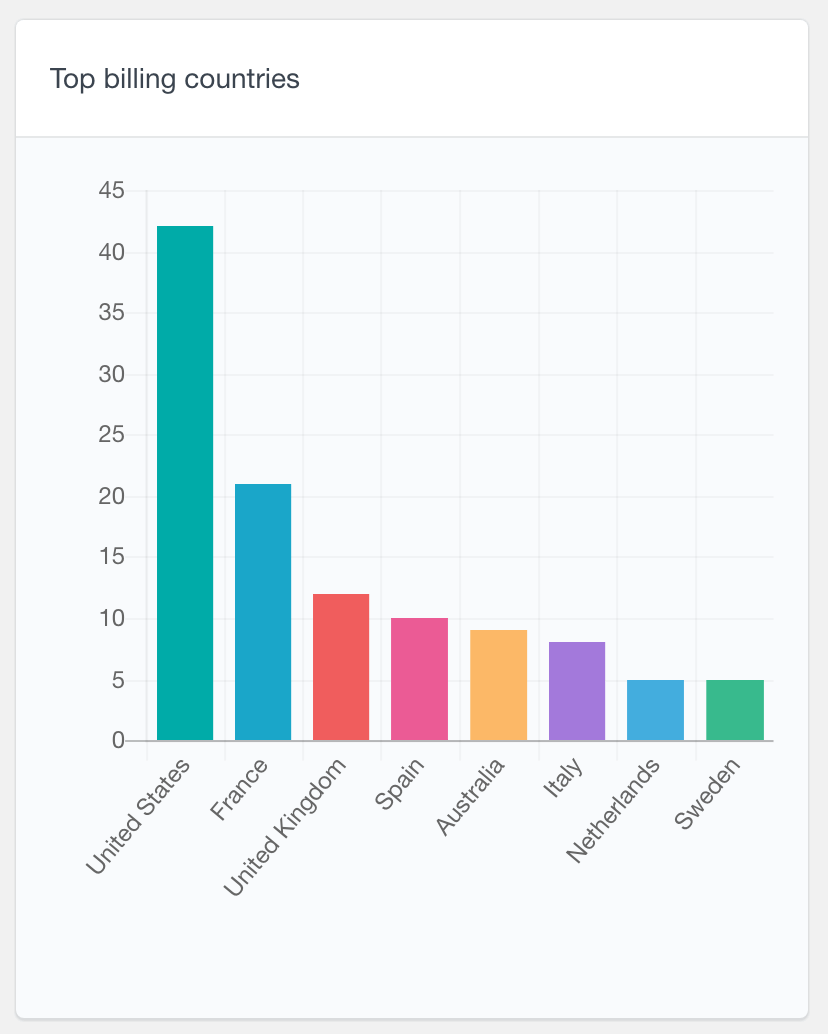
As its name suggests, this report will show you the top billing countries based on your WooCommerce orders. The report is available as a bar chart, by default displaying the top 8 countries.
The billing countries report can help you understand where most of your customers come from and improve your services and products accordingly. Perhaps you could create translations of your stores’ top countries languages, which can further increase your visits and sales from these countries. Or you could use this information to further optimize your marketing strategies.
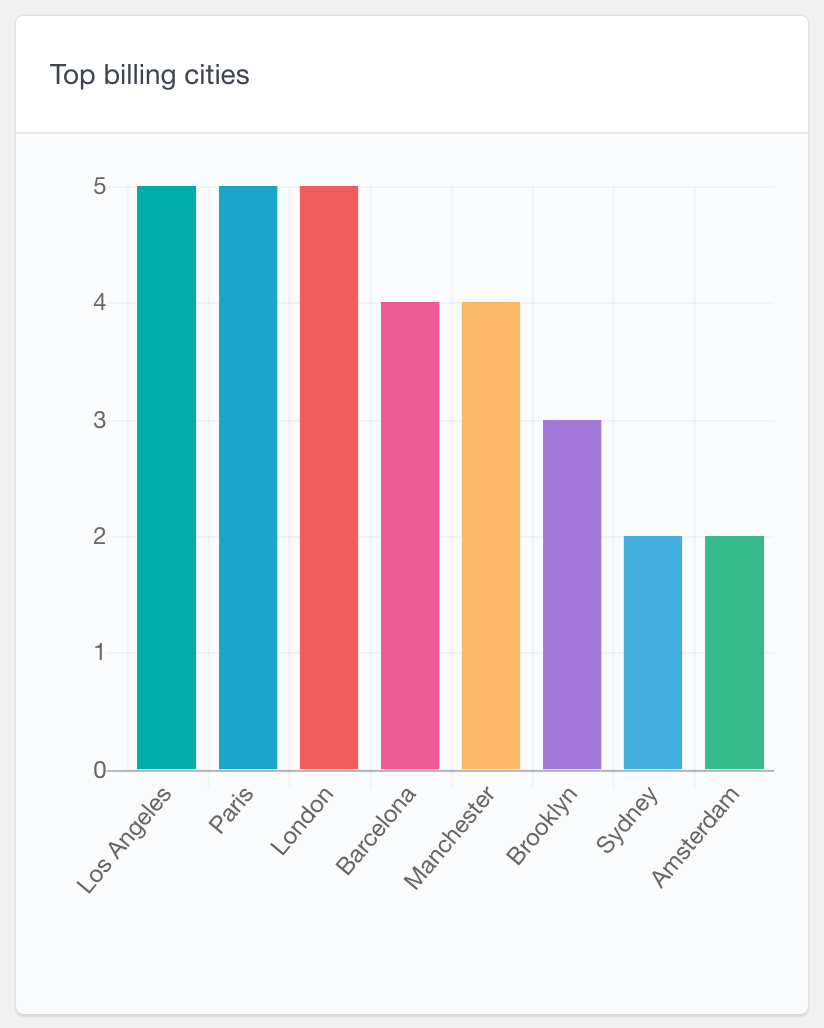
Top WooCommerce billing cities and states report
Similarly, reports are also available for the top billing cities and states. These reports can be most useful if your business operates within a single country. You can see which regions most of your customers come from, which can help you make demographic based decisions. For example, if you find that you have a large number of customers coming from a distant region, you may consider opening a storehouse in that area, in order to provide more affordable shipping options and faster delivery.
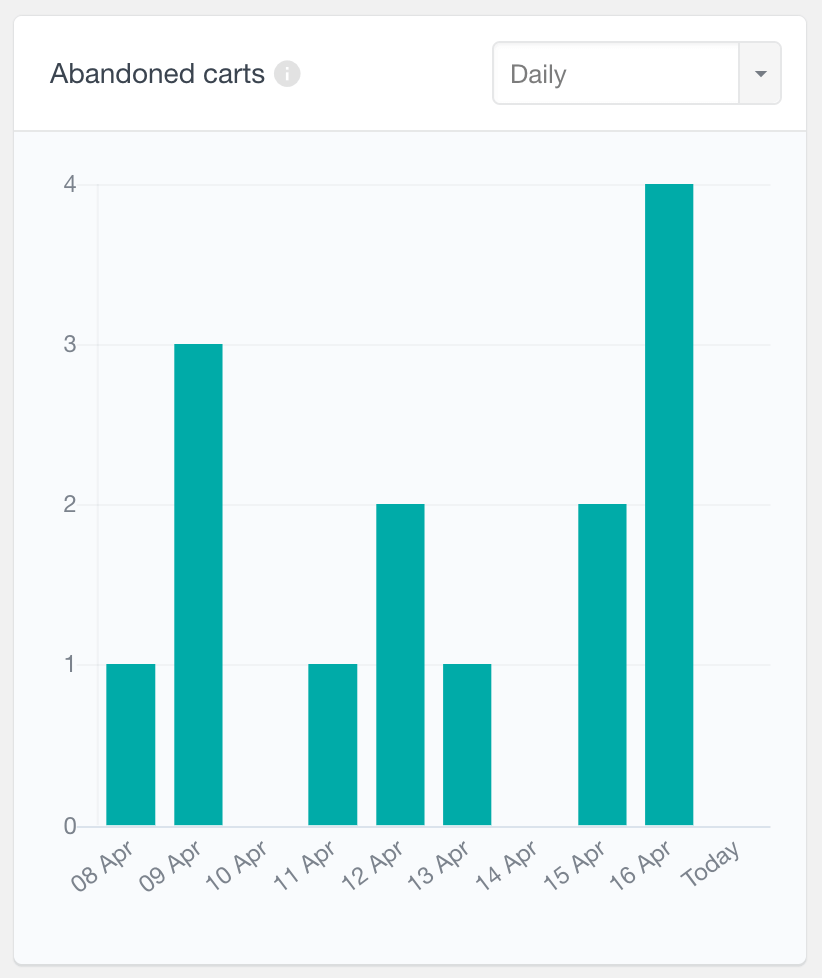
WooCommerce abandoned carts report
The “WooCommerce Abandoned Carts” report tracks the number of abandoned carts from logged-in users over selected time periods. This report requires the WooCommerce persistent cart option to be active, which it is by default. You can view data on a daily, weekly, monthly, or yearly basis. This feature can help you understand trends in cart abandonment, allowing you to take targeted actions to reduce lost sales and improve the checkout process.
WooCommerce order reports
The Users Insights reporting plugin also includes a set of additional order specific reports that provides a summary of your WooCommerce store orders performance. Some important metrics include WooCommerce analytics data like how many items are purchased per order, a general overview of the order statuses, as well as a metrics breakdown of the top coupons and payment methods used.
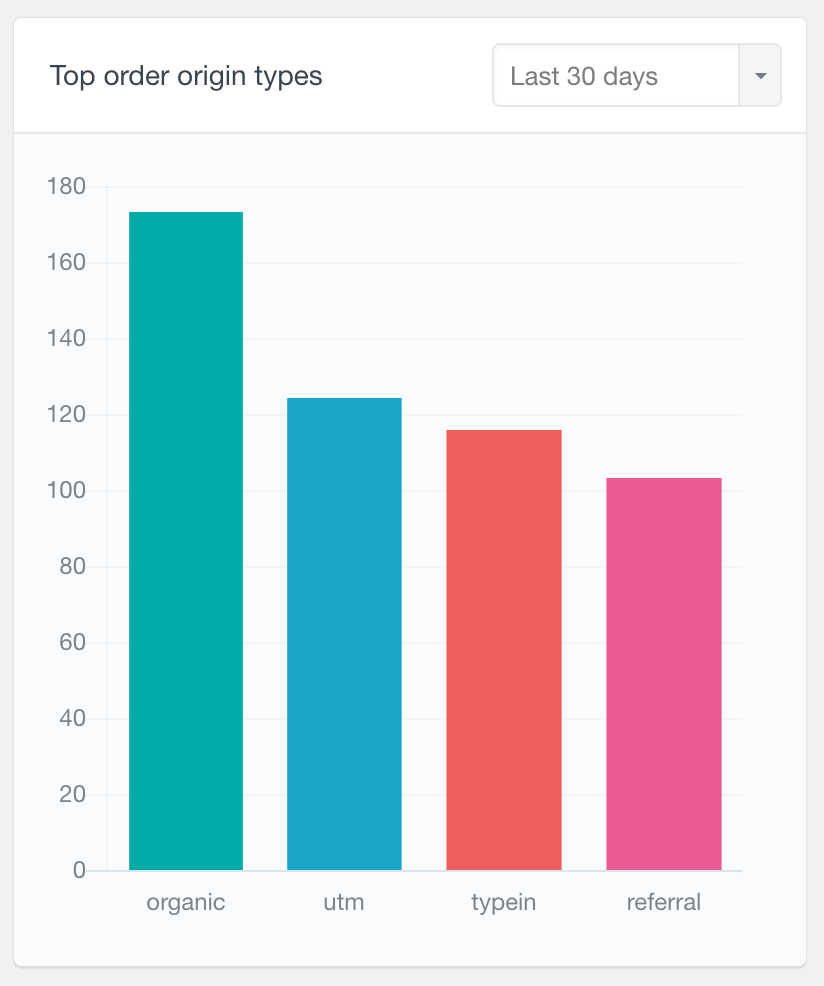
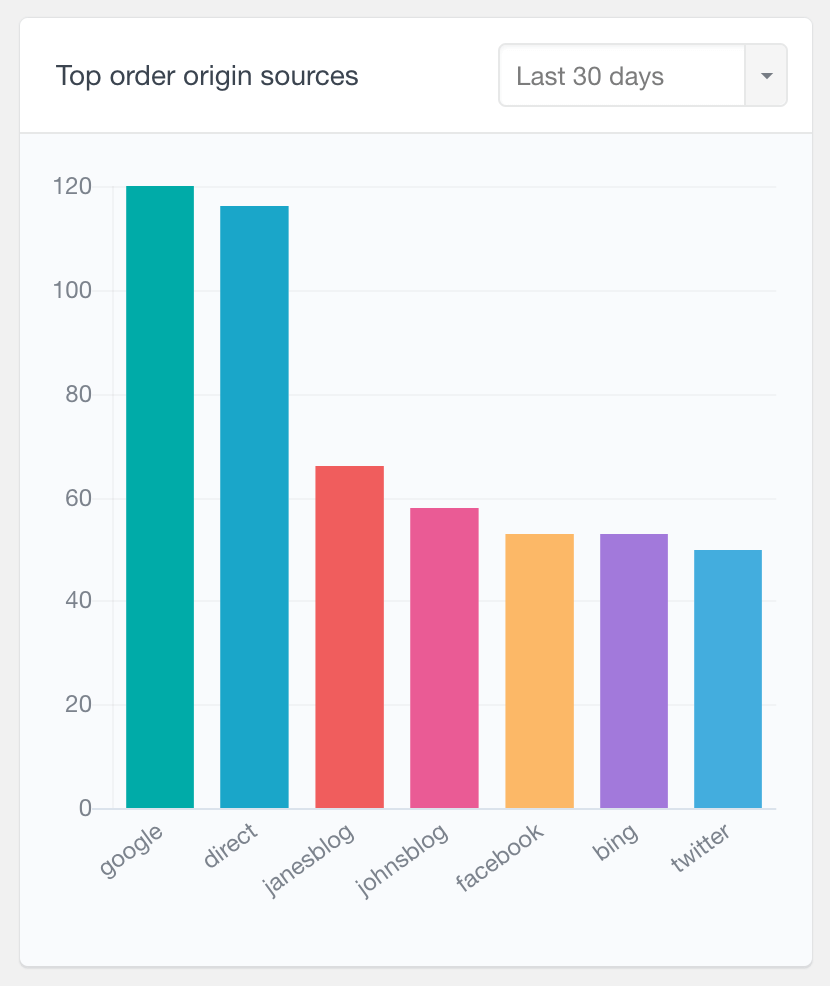
Top Order Origin Types and Top Order Origin Sources
Top Order Origin Types and Top Order Origin Sources help you understand the most common order sources over time. You can explore this information for all orders, or a selected period.
The Top Order Origin Types and Top Order Origin Sources reports in Users Insights help you analyze the effectiveness of their marketing channels by identifying where customer orders are coming from. Origin Types categorize the source of traffic, such as direct visits, organic search, or referrals, while Origin Sources provide more specific details like UTM parameters, referral links, or campaign names. These insights allow store owners to evaluate, and focus efforts on high-performing channels to improve sales.
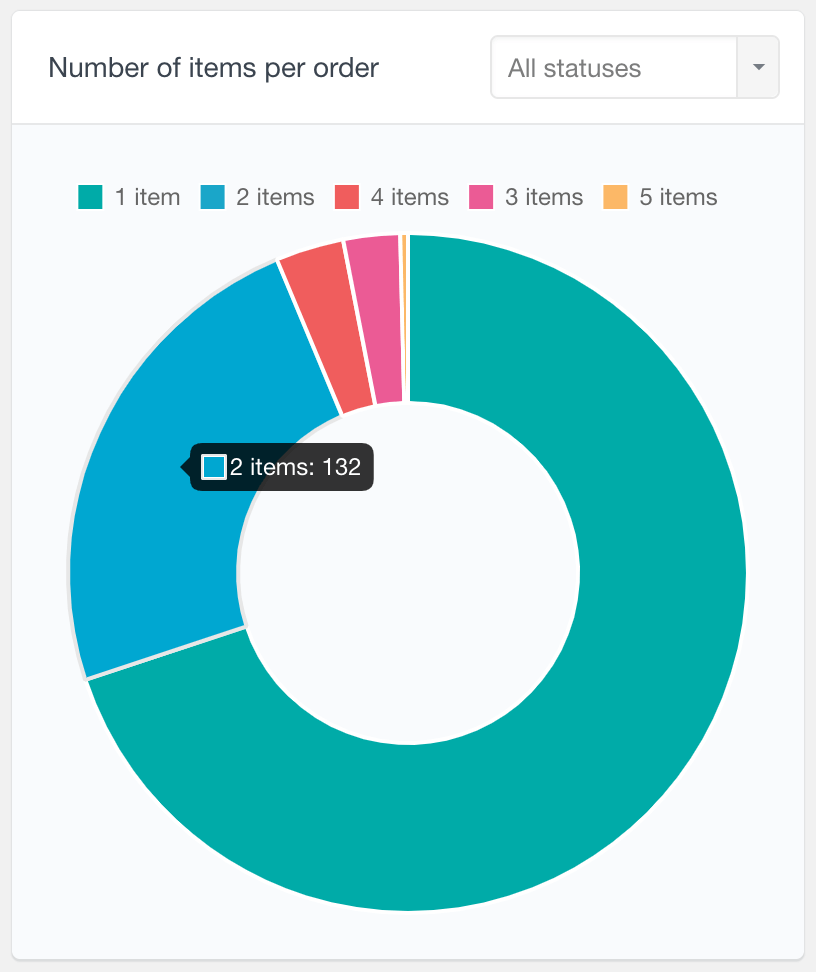
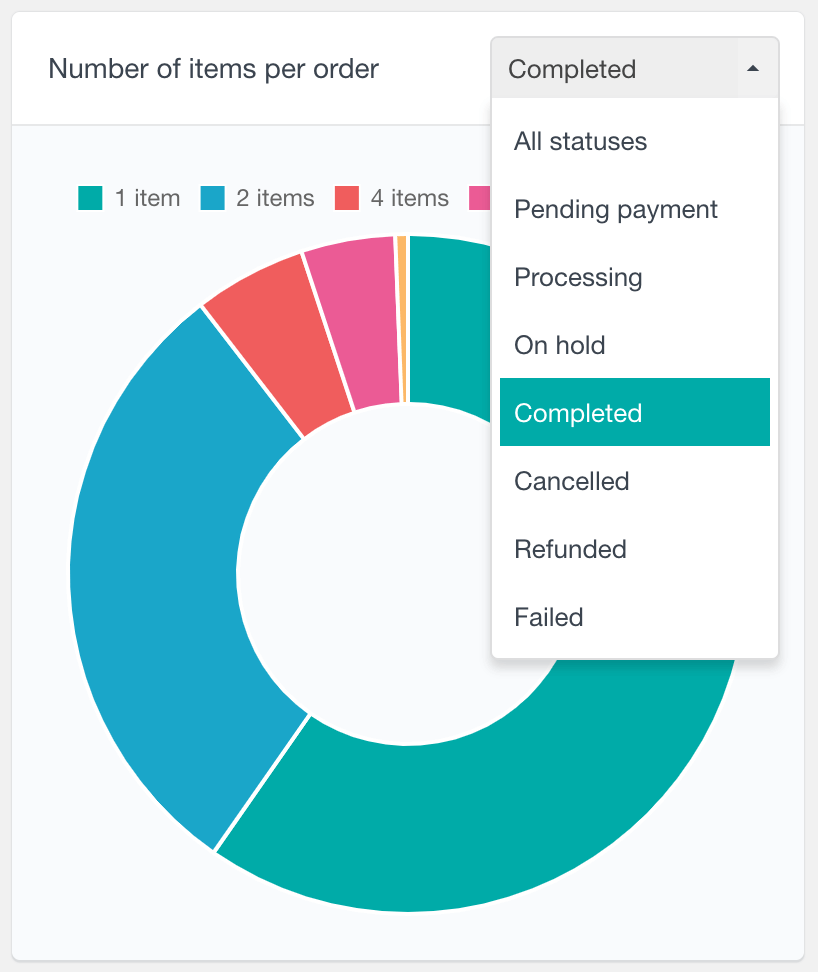
Number of items per order report
With the number of items per order report, you can see the most common total number of items that are purchased per order. It is a pie chart report where each slice represents the number of WooCommerce orders that correspond to each quantity. This WooCommerce analytics plugin can be useful for monitoring customer sales and tracking your average order value. Similarly, this report can also be filtered by the status of the orders, so you can explore the purchase patterns of each order status on your eCommerce store.
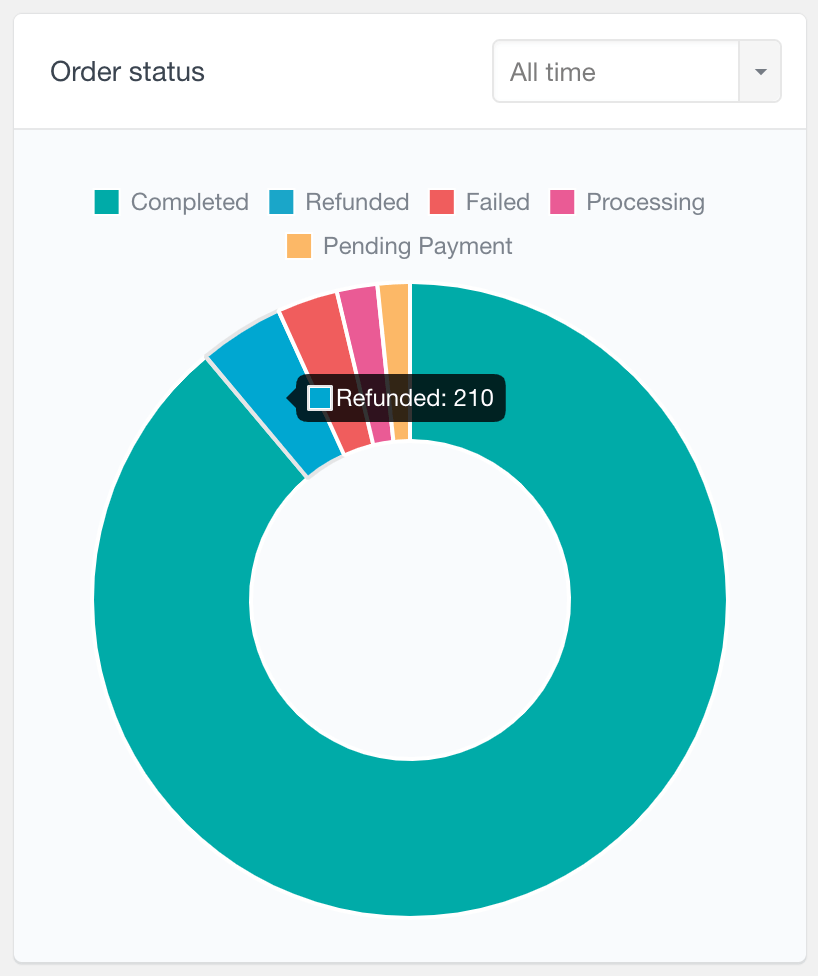
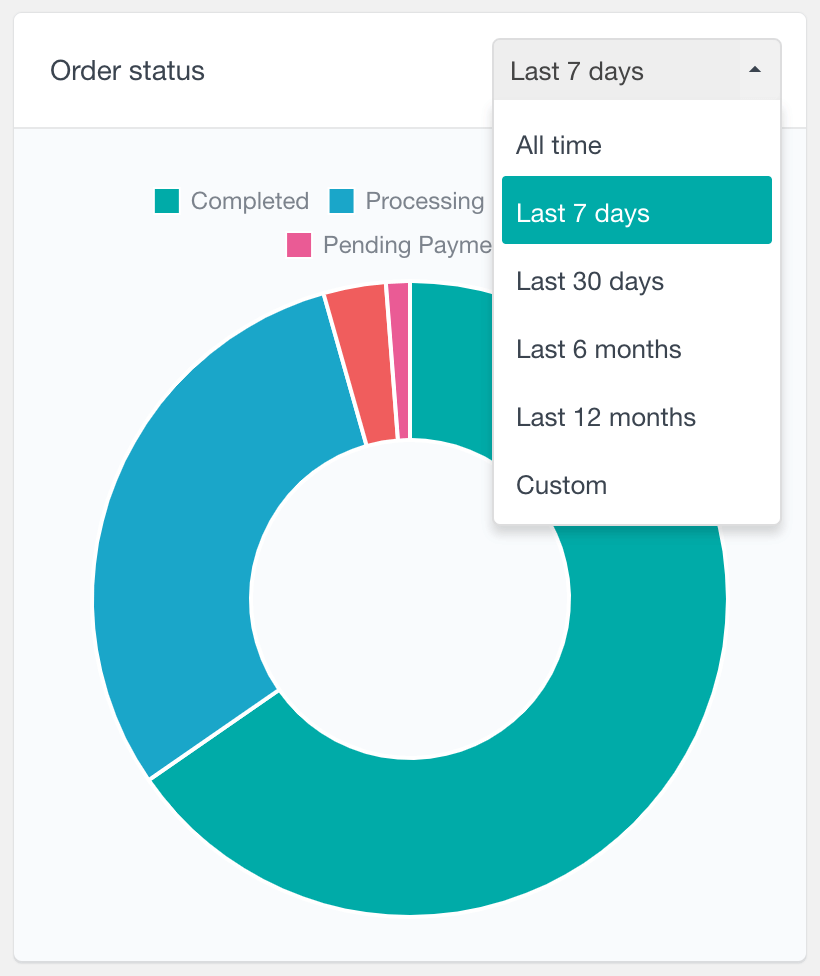
WooCommerce order status report
Another report that the WooCommerce module provides is the Order Status report. It is available as a pie chart, visualizing the number of orders from each status. With this chart, you see what portion of the orders have not been successful or are on hold, and try to minimize these numbers.
For example, you might find that there is a larger number of failed orders than you thought. Perhaps you could try to figure out why this is happening or introduce more payment options in order to minimize the chance of a failing order. This could therefore increase the percentage of your successful orders over time.
Additionally, this report can be filtered by a date range. This option gives you another way to monitor order performance analytics over time.
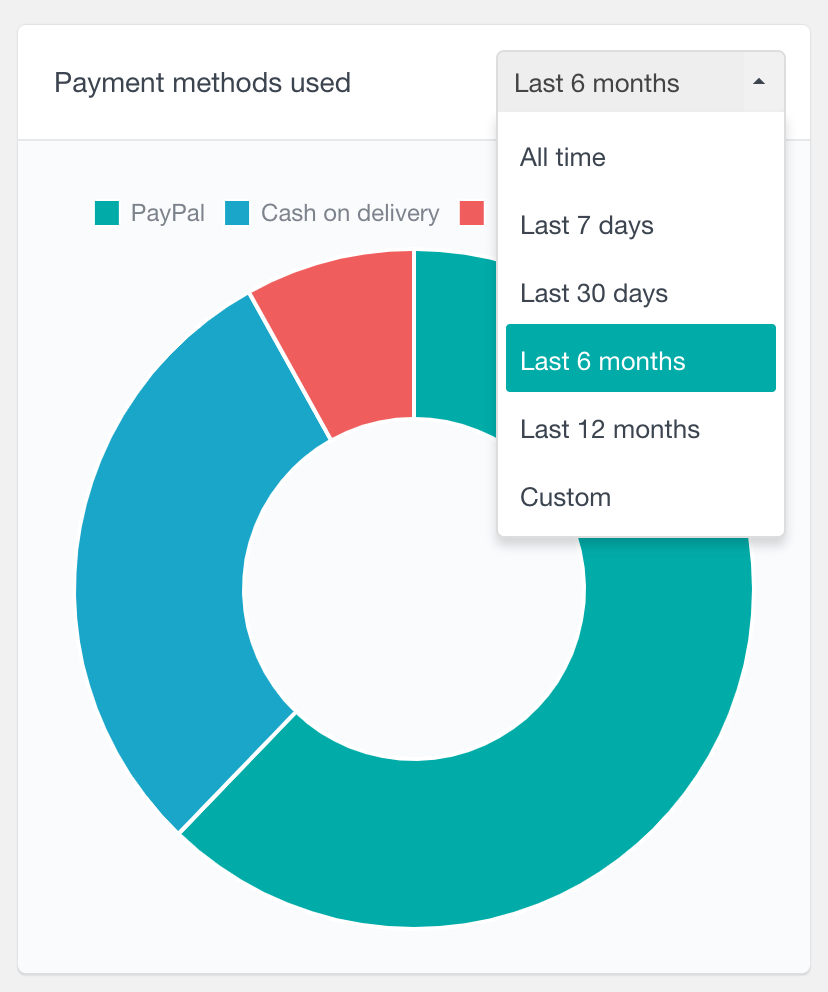
WooCommerce payment methods report
The Payment Methods is a pie chart report showing the percentage of each payment method / payment gateway used. The payment methods are automatically retrieved from the WooCommerce order data. This means that if you introduce a new payment method (via a WordPress plugin for example), it will be automatically detected as soon as your customers start using it.
Additionally, you can further filter this report by date, where you can choose a preset of the last several days or months, or select a custom dare range. This allows for a better understanding of changes in customer behavior over time, as well as identifying trends and patterns in payment method usage. The date filter can be also useful when introducing a new payment method, as it will allow you to test the effectiveness of the new payment method by analyzing its usage during the period when it was available.
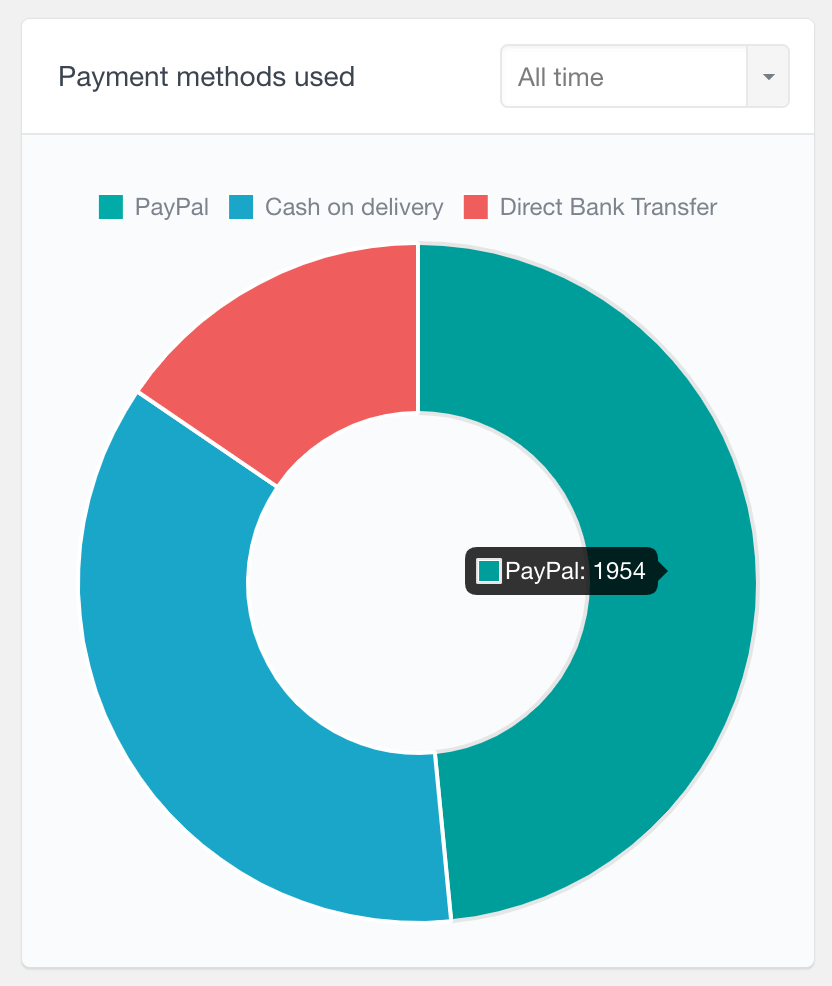
This report can help you make decisions based on the most popular POS methods used. For example, if you find yourself overwhelmed by having too many payment methods to manage, this chart can help you decide which ones are the most important to keep. Or if you find that most of your customers prefer online payments (instead of cash on delivery or bank transfers), you might consider introducing more online payment options.
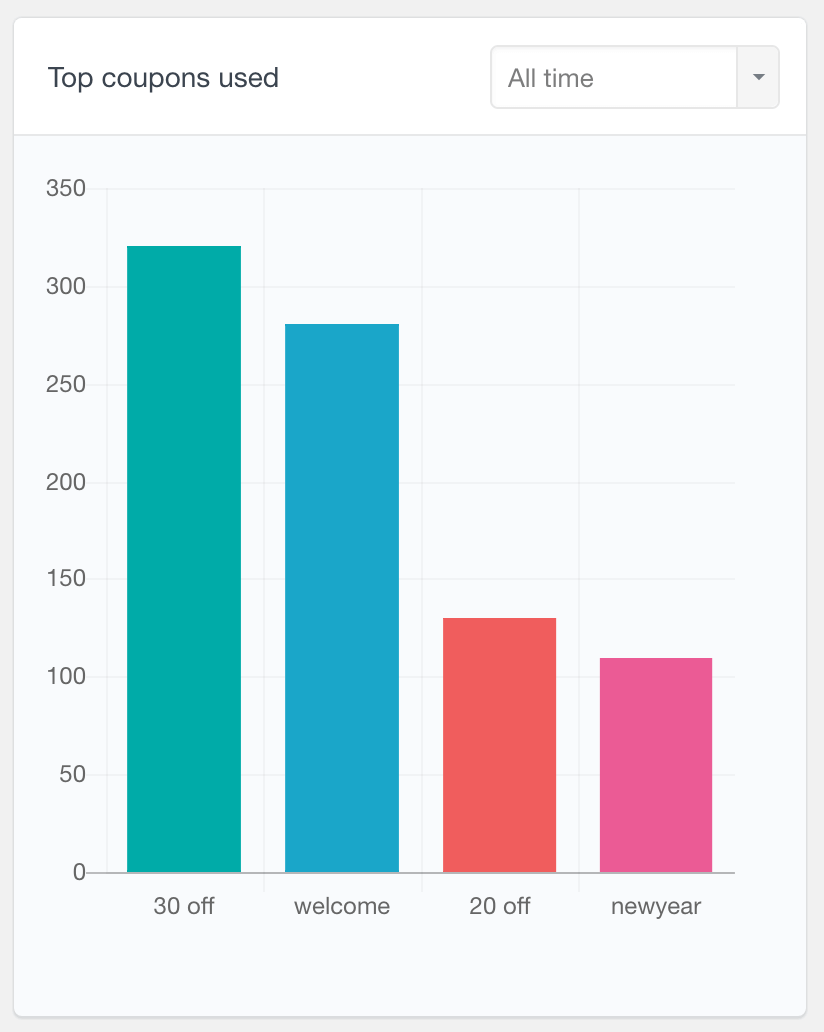
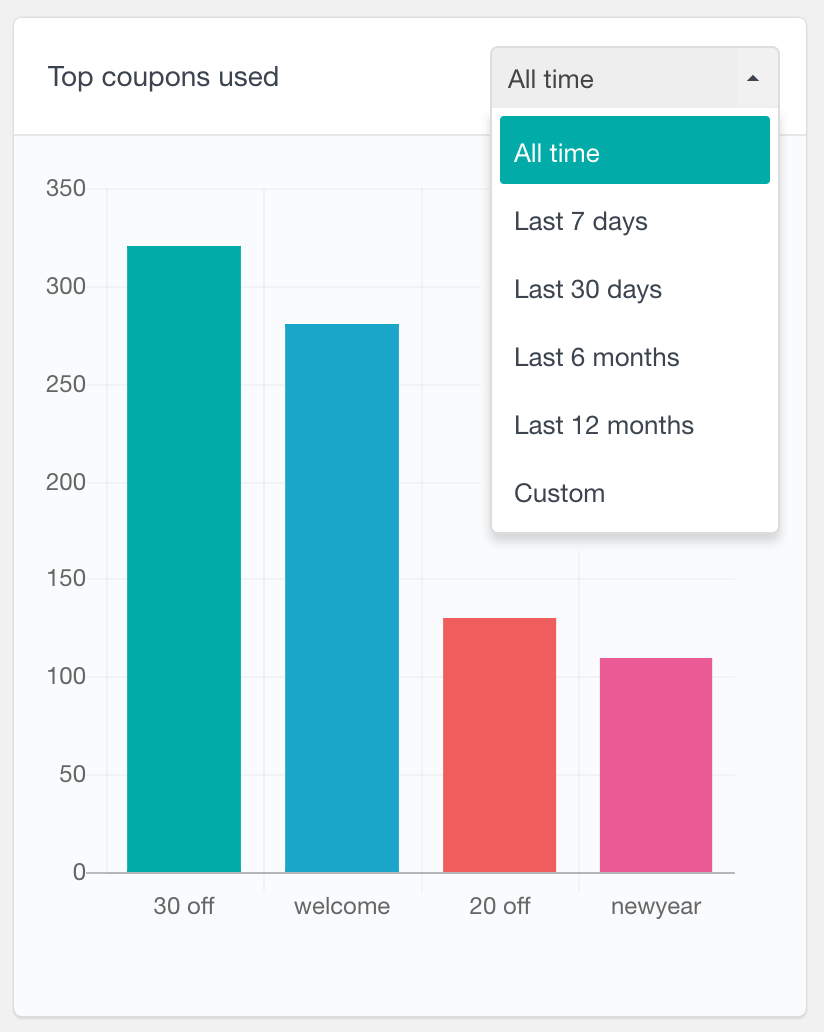
WooCommerce coupons used report
The WooCommerce coupons report shows the top most used coupons in your store. Providing discount coupons can undoubtedly increase your sales and conversion rates, so it is important to understand how they perform. This report can help you find which of your more successful campaigns and what kind of impact they have on your sales. By default this report shows all-time data, however, you can also filter it by date.
WooCommerce product reports
The WooCommerce product sales report can help you understand which products your customers are most interested in and how that changes over time. Additionally, you can also explore which products are most refunded which can be beneficial in improving your product sales performance.
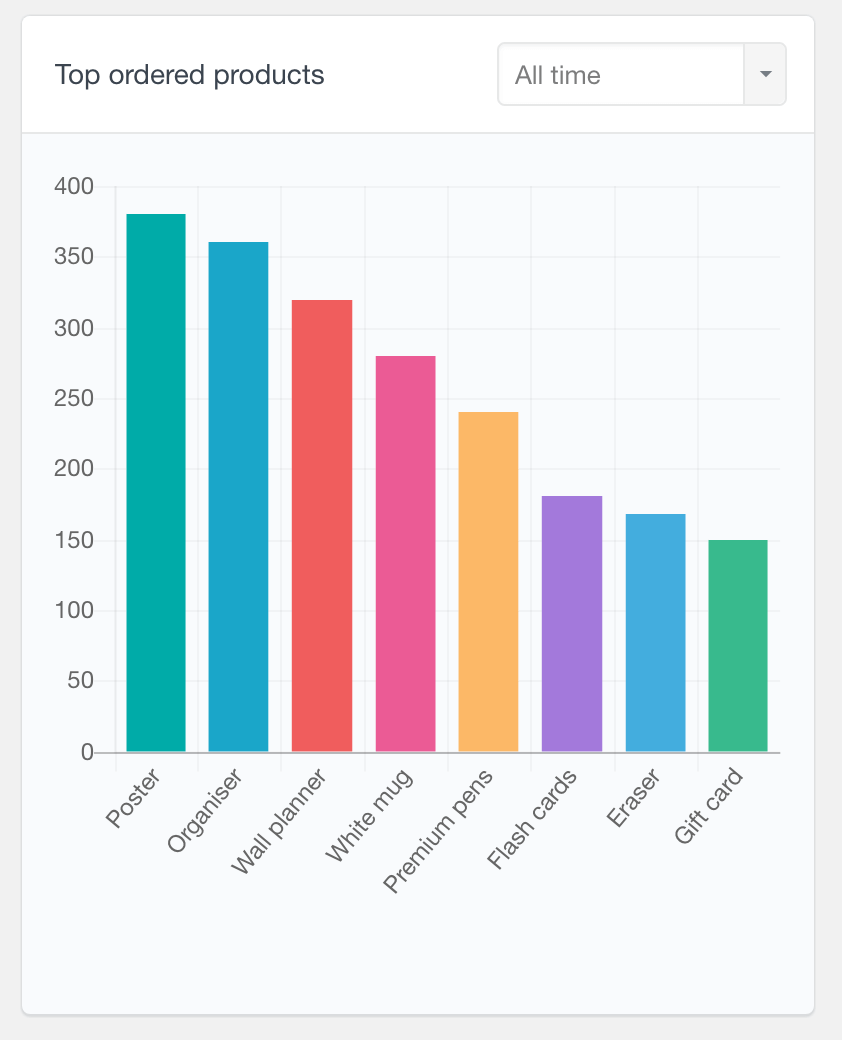
WooCommerce best selling products report
As its name implies, this product sales report shows the top most ordered WooCommerce products. The Users Insights reporting plugin analyzes each order’s products and calculates how many orders include each product. You can also filter the results by date – you can choose a preset option, such as the last 7 days or the last 6 months. Or you can also select a custom period between two dates. The dates that you choose are inclusive and you can optionally leave one of the dates blank to show the results from or until a certain date.
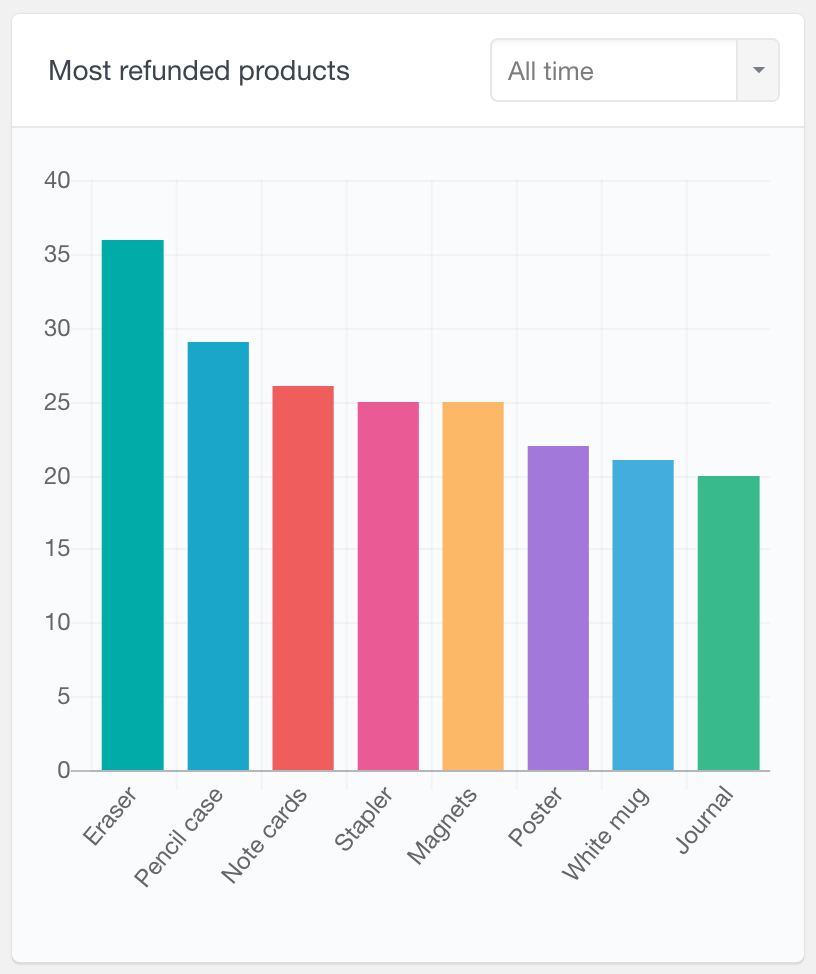
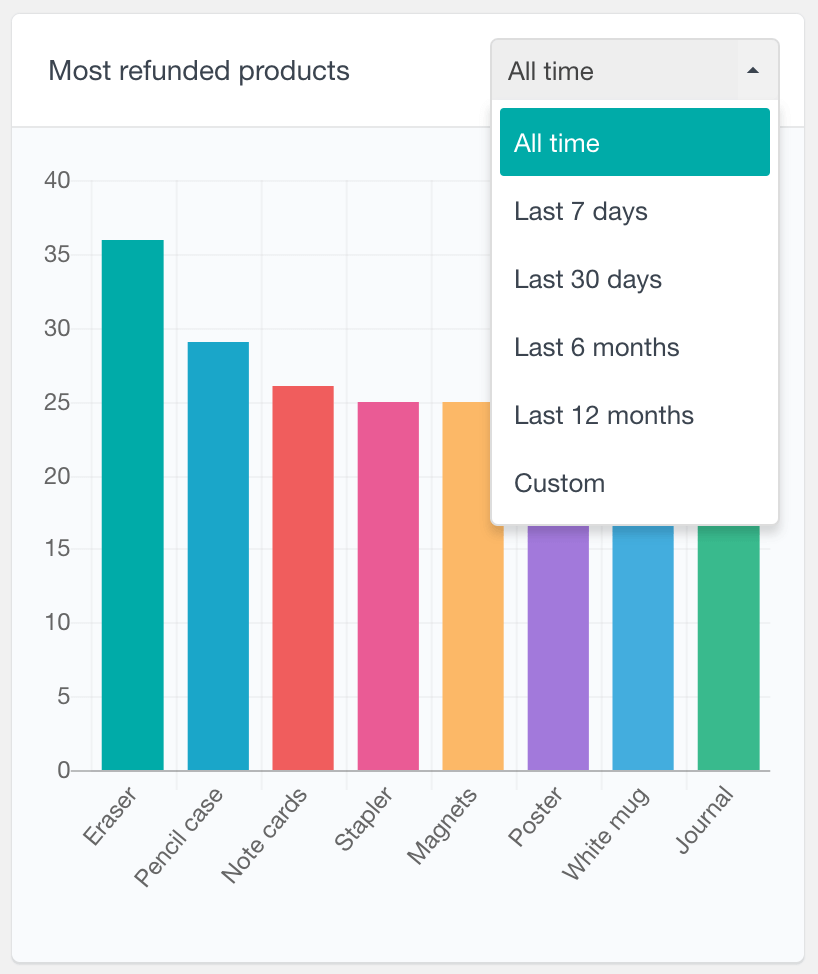
WooCommerce most refunded products report
The most refunded products report can be another useful tool to help you analyze your WooCommerce store activity. This report counts how many times each product appears in a refunded order. Please note that the quantity of each product ordered is not taken into account, but only how many times it is part of a refunded order. This report can also be filtered by the date range of the date of the order. This can be particularly useful if you compare it with the same period in the “Top ordered products” report. In this way, you might be able to find products that are refunded disproportionally to the shop’s average refund rate.
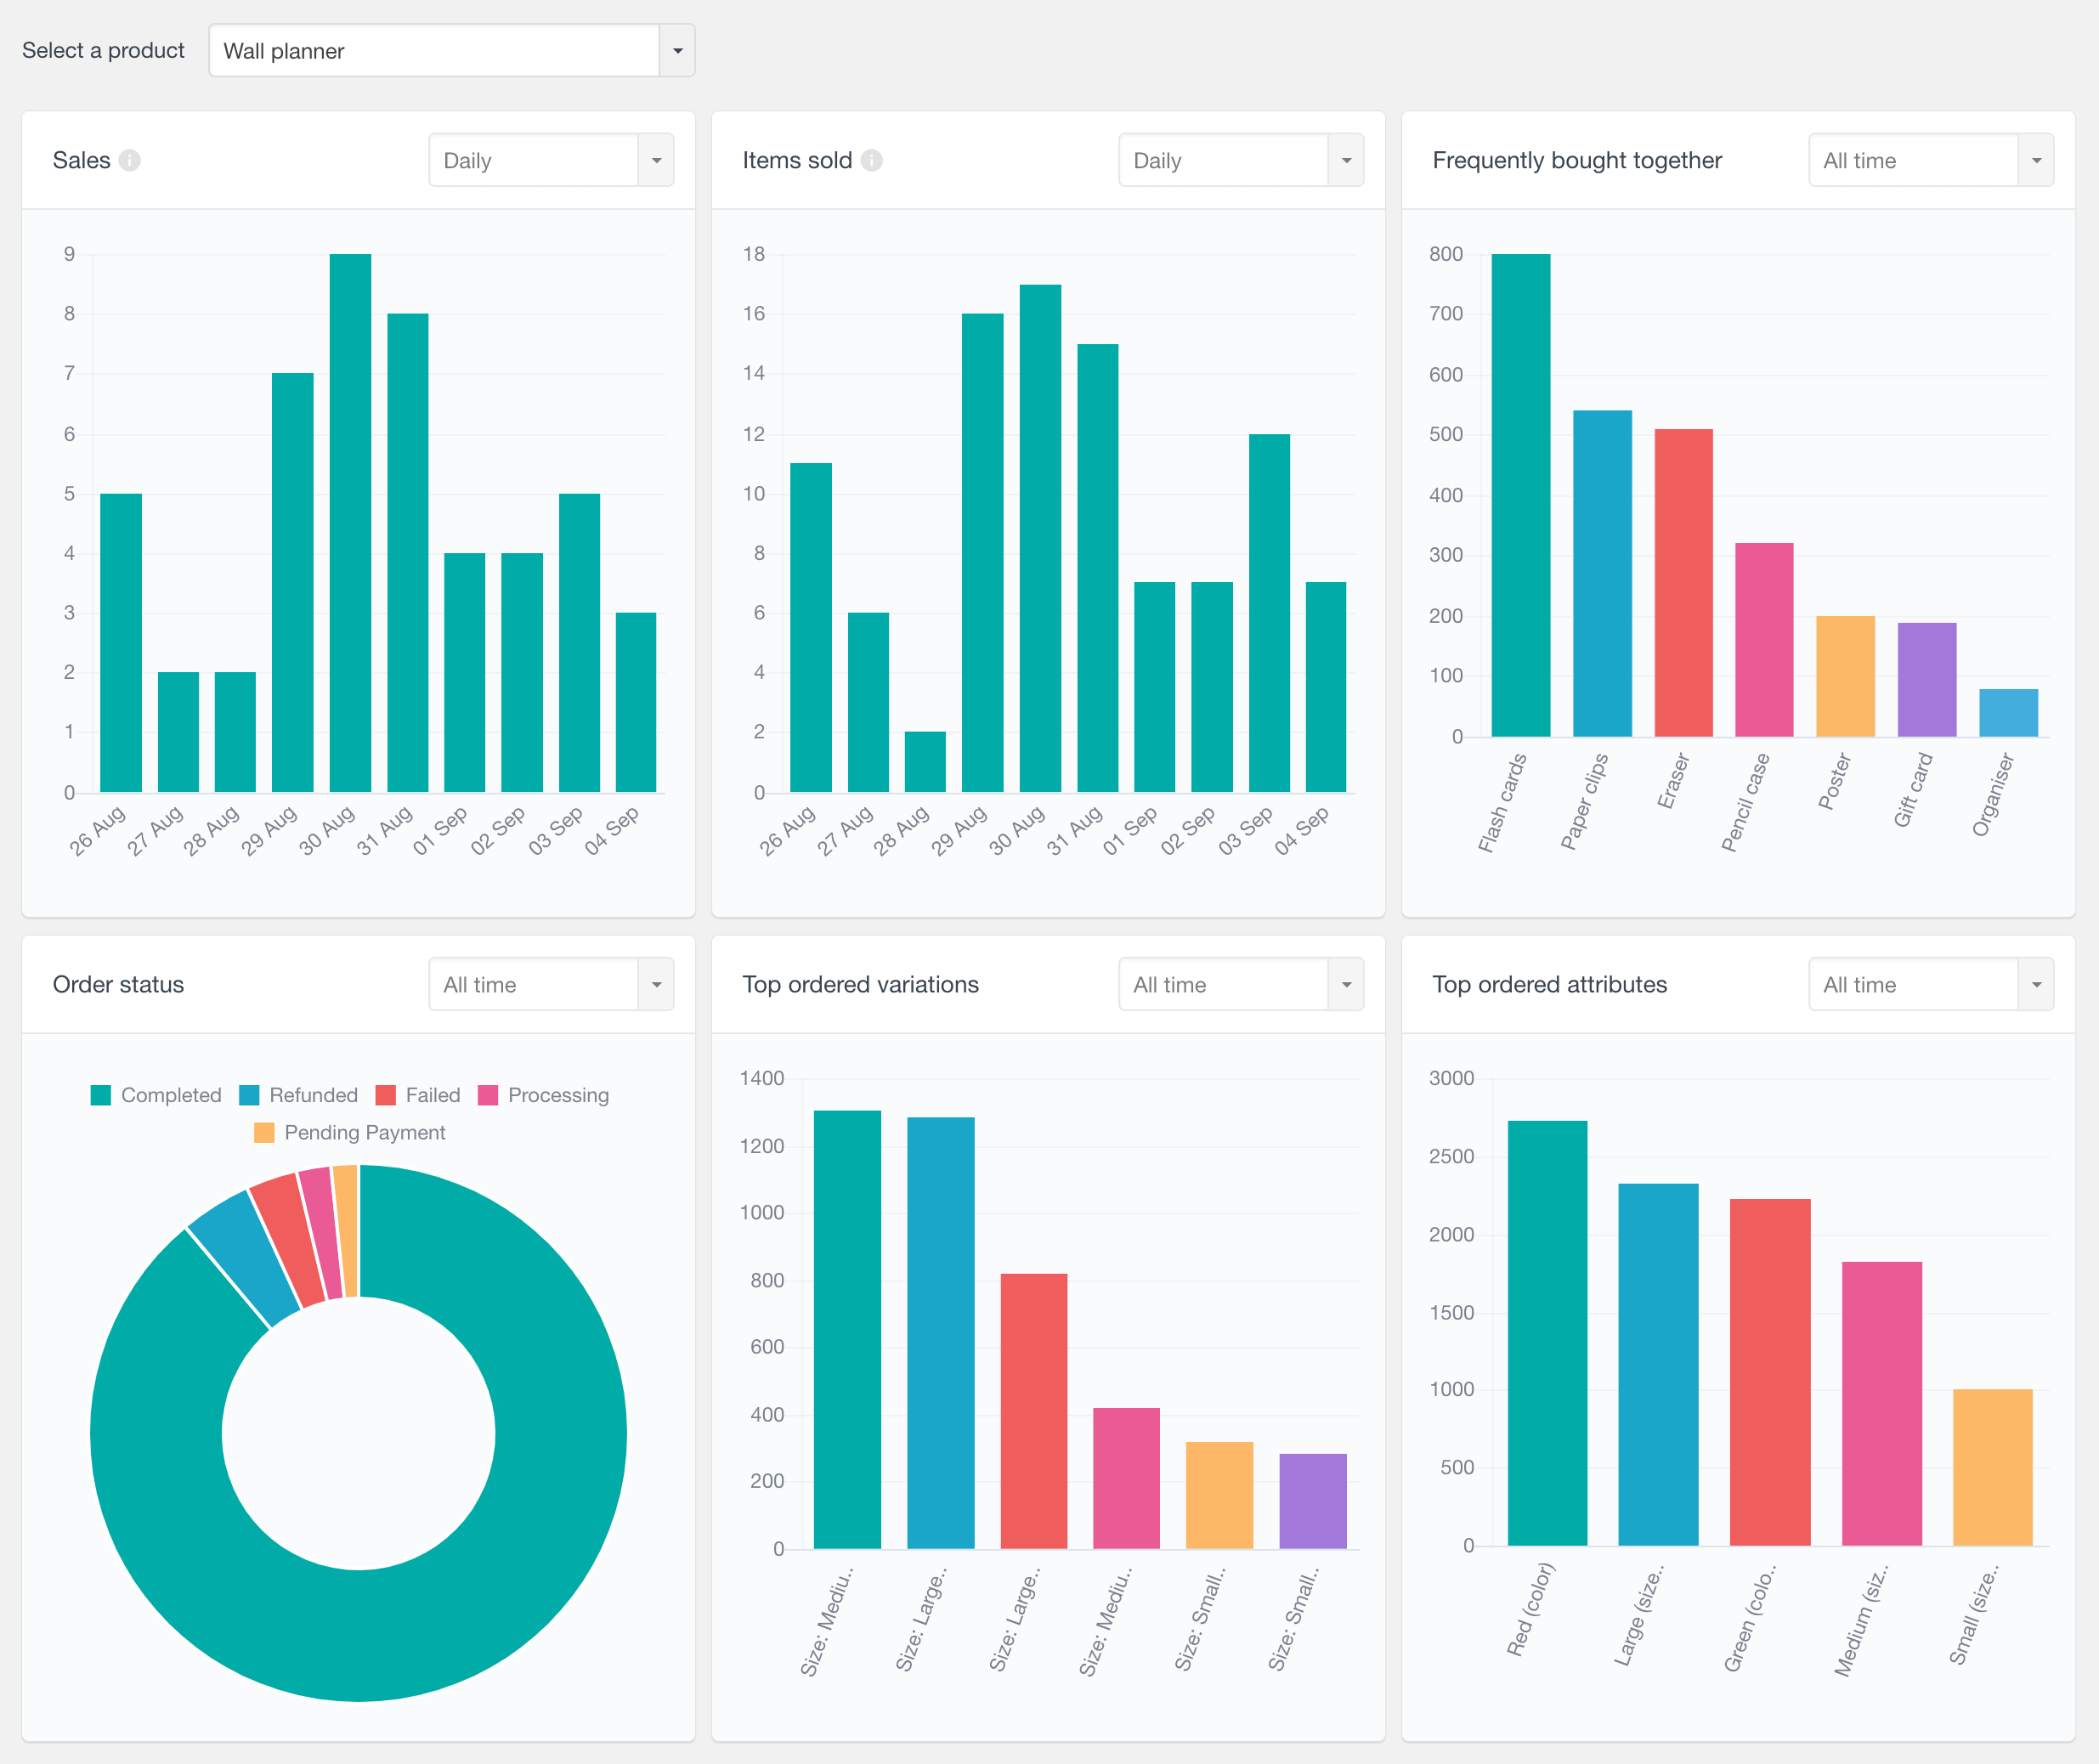
WooCommerce product sales reports
Users Insights also includes a dedicated WooCommerce product analysis page, which provides an in-depth analysis of each individual product. In this section you can select the product you wish to analyze, and explore the following reports:
- Frequently bought together (top products that are frequently ordered with the selected product)
- Sales – number of orders containing the selected product with status completed, processing, and on hold
- Items sold – number of items sold in sale orders
- Items sold total amount – the total value for items in sale orders
- Top ordered variations (for variable products) – showing the names of the top ordered variations
- Top ordered attributes (for variable products) – showing the names of the top ordered attributes
- Order statuses – showing the statuses of the orders containing the selected product with the option to filter by date
To learn more, visit the WooCommerce Product Sales Reports page.
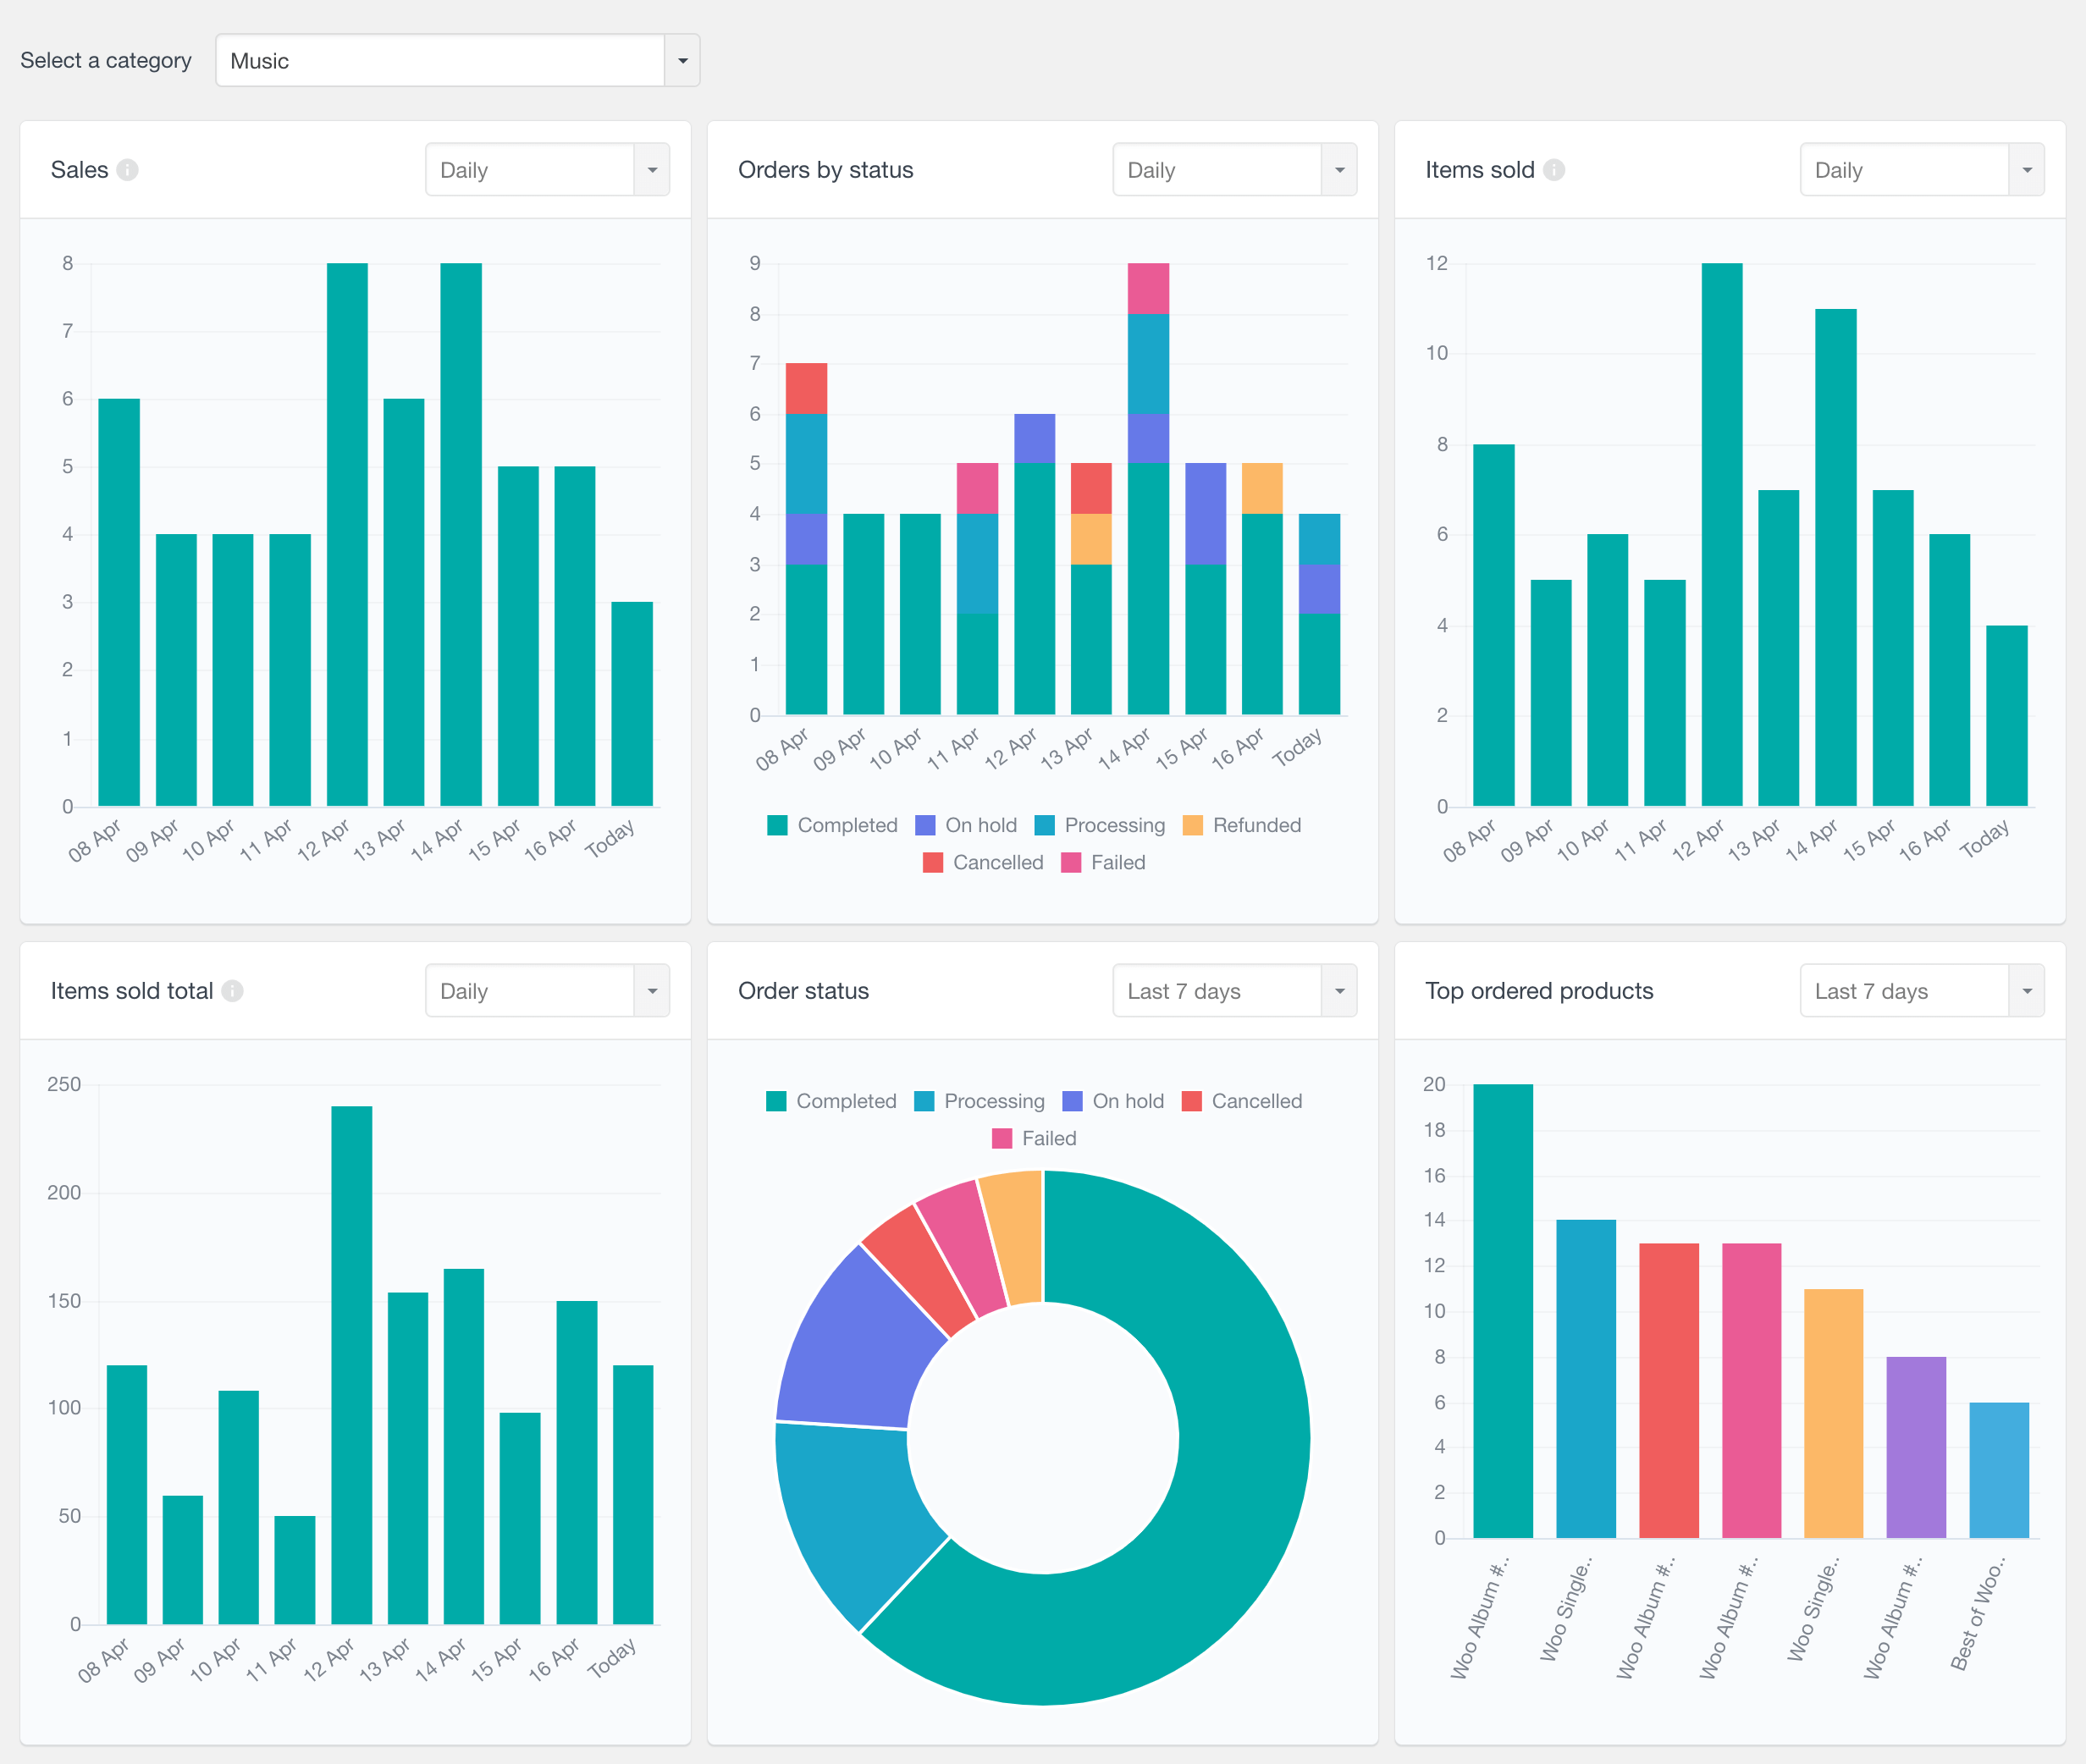
WooCommerce product category reports
Additionally, Users Insights provides reports for WooCommerce product category sales. This section allows you to choose a product category and provides various performance reports for the selected category. These reports include:
- Number of sales over time
- Number of orders over time with a status breakdown
- Number of items sold from products of the selected category over time
- Value of items sold from selected category products over time
- Order status chart
- Best selling products from the category
You can learn more on the WooCommerce Product Category Reports page.
WooCommerce reports plugin and WooCommerce customer analysis
The WooCommerce reports are only a fraction of the WooCommerce reporting plugin capabilities of Users Insights. By combining the report’s data with the custom WooCommerce user filters and searches, you can create more advanced customer reporting and analytics. To learn more about how to create your own WooCommerce custom reports with different metrics and CSV data exports, you can visit the WooCommerce module page.
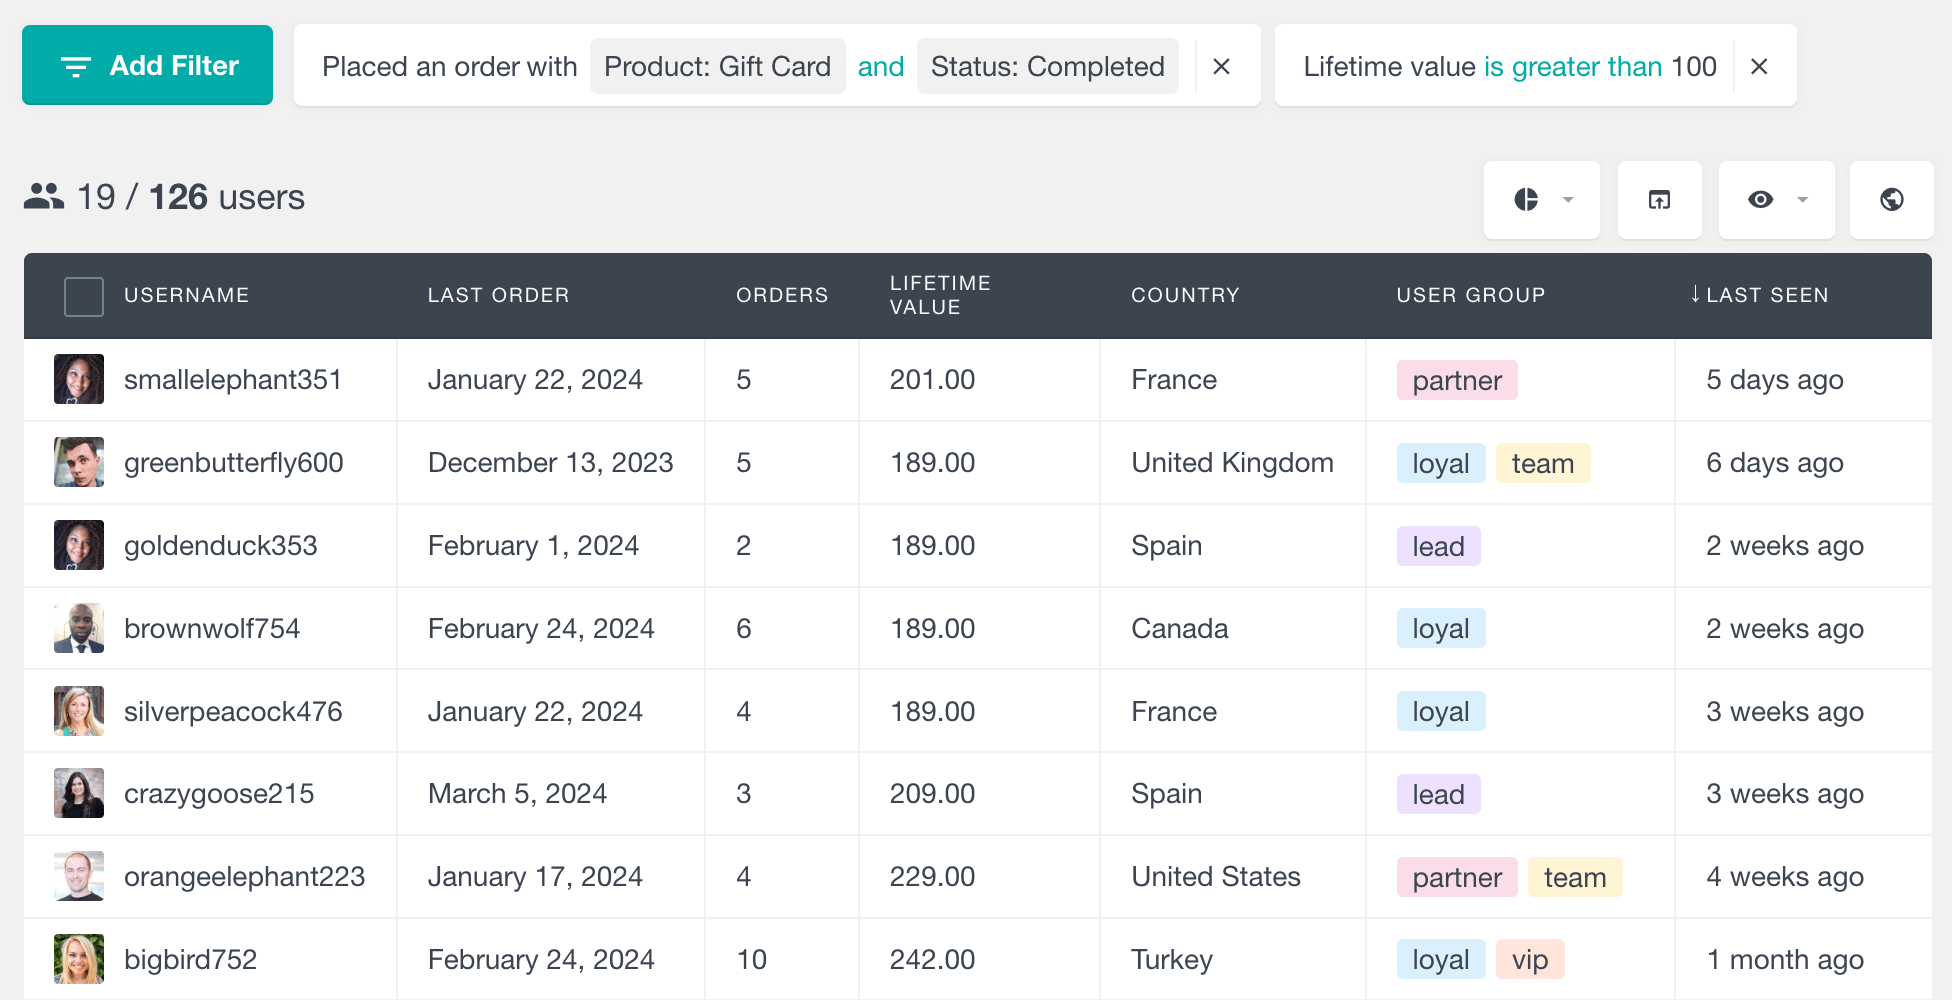
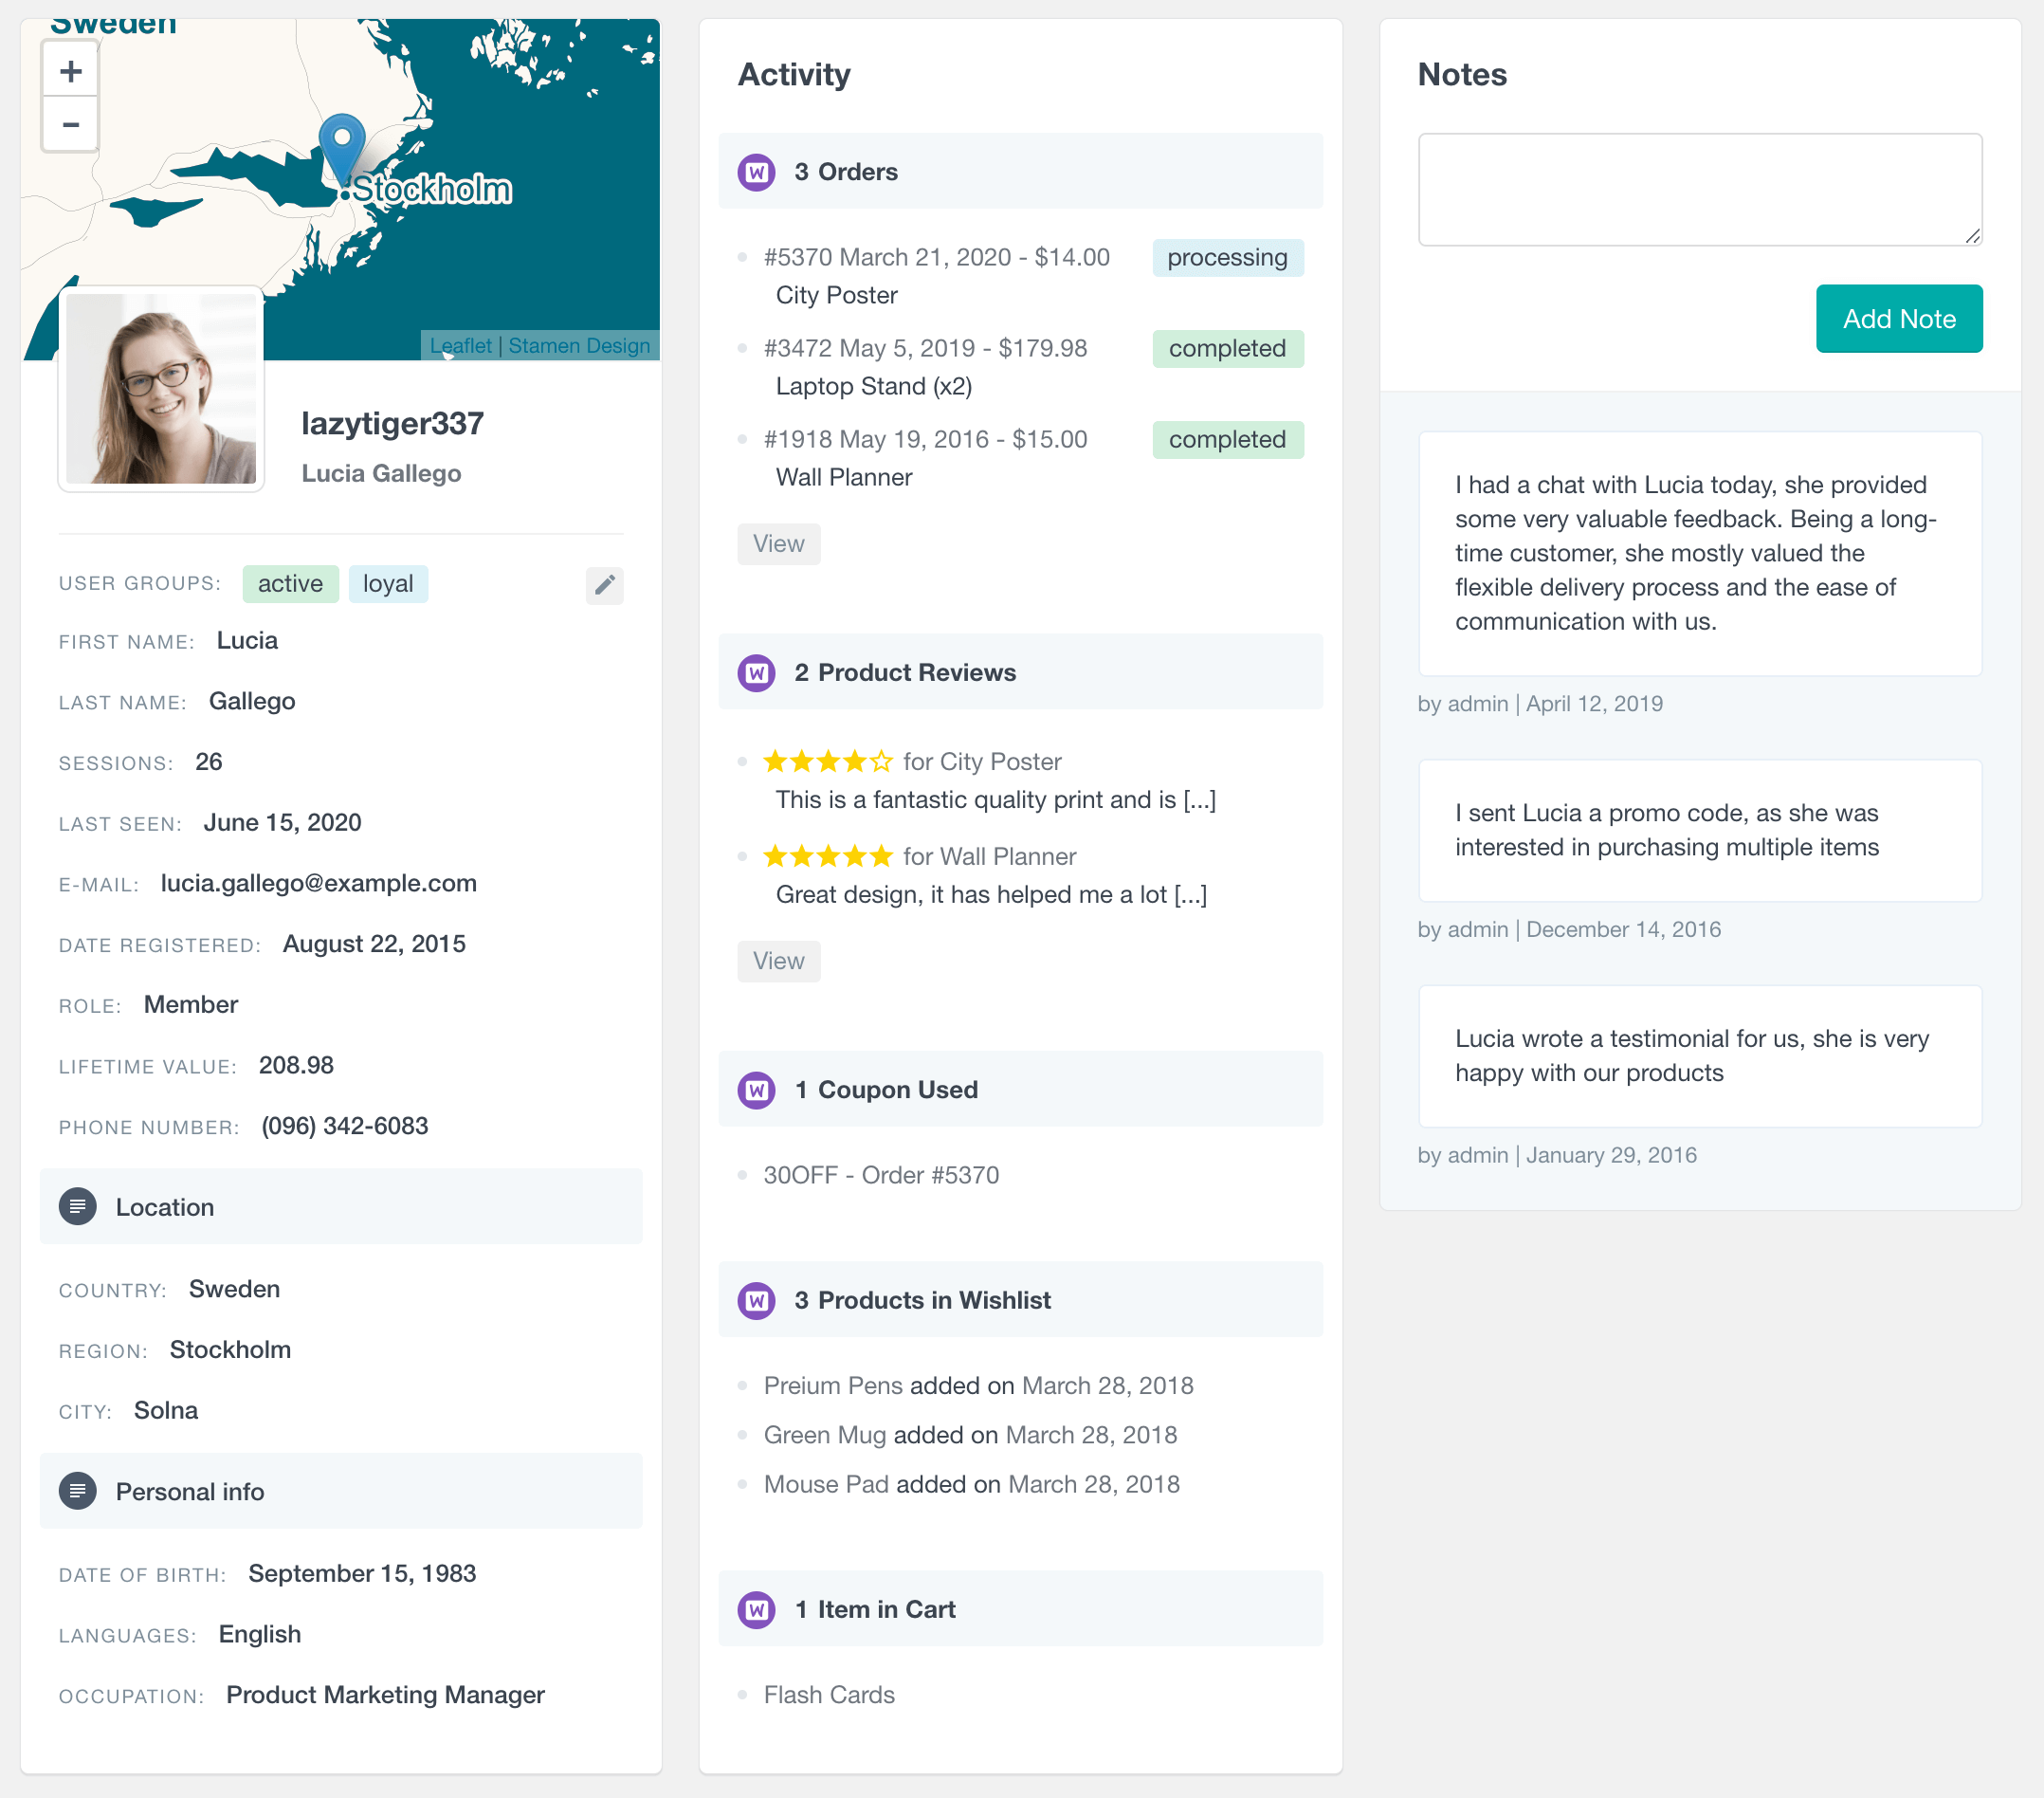
Additionally, you can explore the individual WooCommerce order reports per customer in their corresponding profile section. This section provides a detailed WooCommerce customer report including their order history, their activity, and any other user-based information that is available for them.